

Key Insights
The global food preservatives market, valued at $3.40 billion in 2025, is projected to experience robust growth, driven by increasing consumer demand for extended shelf life and enhanced food safety. The compound annual growth rate (CAGR) of 4.81% from 2025 to 2033 indicates a significant expansion in market size. Several factors contribute to this growth. The rising prevalence of foodborne illnesses globally fuels the demand for effective preservation techniques. Furthermore, the growing processed food industry and the expanding global population are key drivers. Changing consumer lifestyles, with increased reliance on convenience foods and ready-to-eat meals, further intensify the need for preservatives to maintain product quality and safety during extended storage and distribution. Technological advancements in preservation methods, leading to safer and more effective solutions, also contribute to market expansion. However, growing consumer awareness regarding the potential health implications of certain preservatives and the increasing preference for natural and minimally processed foods present challenges to the market's growth trajectory. Regulation changes regarding the use of specific preservatives also influence the market dynamics. Key players in the market, including Kemin Industries Inc, Givaudan SA, and BASF SE, are continually innovating to meet evolving consumer needs and regulatory standards. The market is segmented based on preservative type (natural vs. synthetic), application (meat, dairy, bakery, etc.), and geographic region, offering diverse opportunities for growth within specific niches.
The forecast period (2025-2033) suggests a continued upward trend for the food preservatives market. While challenges exist concerning consumer preferences and regulations, innovation in both natural and synthetic preservatives, along with a focus on sustainable and eco-friendly options, is expected to drive future growth. The market's future success will depend on companies' ability to address consumer concerns regarding the safety and health implications of preservatives, while simultaneously ensuring the preservation of food quality and safety throughout the supply chain. Strategic partnerships, acquisitions, and research and development efforts focusing on novel preservation technologies will be critical for market leaders to maintain competitiveness and capitalize on future growth opportunities.

Deep Dive into the Food Preservatives Industry: A Comprehensive Market Report (2019-2033)
This comprehensive report provides a detailed analysis of the global food preservatives market, offering invaluable insights for industry stakeholders, investors, and strategic decision-makers. The study period covers 2019-2033, with a base year of 2025 and a forecast period of 2025-2033. The report leverages extensive primary and secondary research to deliver actionable intelligence on market size, growth drivers, key players, and future trends. The market is projected to reach xx Million by 2033, exhibiting a CAGR of xx% during the forecast period.
Food Preservatives Industry Market Concentration & Dynamics
The global food preservatives market is characterized by a moderately concentrated landscape, with a few major players holding significant market share. Key players such as Kemin Industries Inc., Givaudan SA, BASF SE, and Tate & Lyle PLC, collectively account for approximately xx% of the global market. However, the market also features several smaller, specialized players catering to niche segments. Innovation plays a crucial role, with companies continually developing new preservatives to meet evolving consumer preferences and regulatory requirements. The regulatory framework varies across different regions, impacting product approvals and market access. Substitutes for synthetic preservatives, such as natural alternatives, are gaining traction, driven by growing consumer demand for clean-label products. End-user trends are significantly influenced by health consciousness, with increasing preference for products with longer shelf life and minimal artificial ingredients. The industry has also witnessed several mergers and acquisitions (M&A) activities in recent years, with xx M&A deals recorded in the past five years, primarily focused on expanding product portfolios and geographical reach.
- Market Share: Kemin Industries Inc. (xx%), Givaudan SA (xx%), BASF SE (xx%), Tate & Lyle PLC (xx%), Others (xx%).
- M&A Activity: xx deals in the past five years, primarily focused on expanding product portfolios and geographical reach.
- Innovation Ecosystem: Strong focus on natural preservatives and clean-label solutions.
- Regulatory Landscape: Varies across regions, influencing product approvals and market entry.
Food Preservatives Industry Insights & Trends
The global food preservatives market is experiencing robust growth, driven by several factors. The rising global population and increasing demand for processed and convenience foods are major contributors. Technological advancements have led to the development of more effective and safer preservatives, further propelling market expansion. Evolving consumer preferences towards clean-label products and health-conscious eating habits are also shaping market trends. The market size was valued at xx Million in 2024 and is projected to reach xx Million by 2033. The increasing awareness of food safety and the need to extend the shelf life of food products are further fueling market growth. Technological disruptions, such as the adoption of advanced preservation techniques and the development of novel preservation ingredients, are also creating opportunities for market expansion. The demand for natural and organic preservatives is steadily growing, offering significant growth potential. These developments, coupled with increasing consumer spending on food products, are expected to drive significant market growth in the coming years.

Key Markets & Segments Leading Food Preservatives Industry
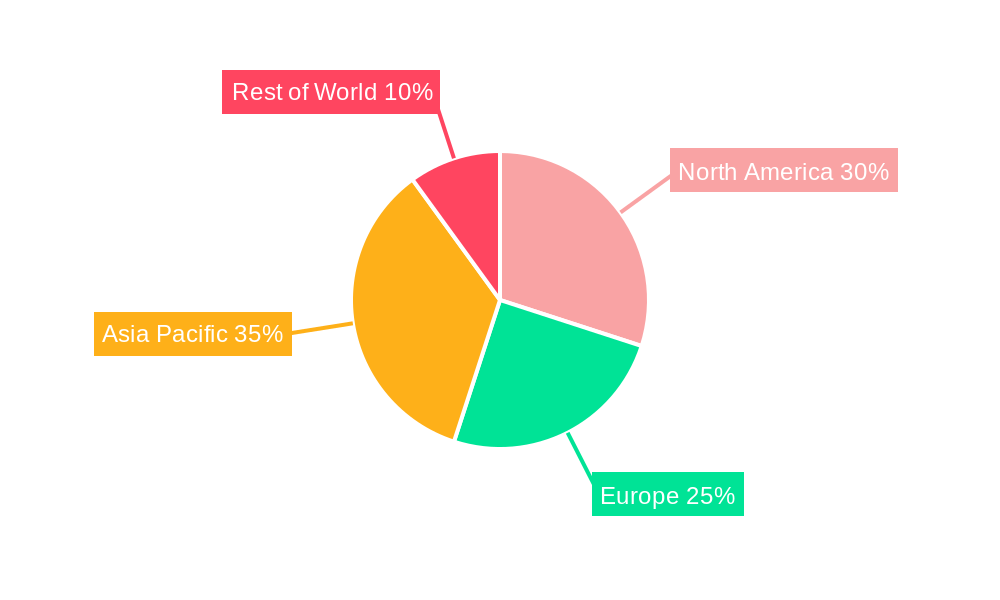
The North American region currently holds the dominant position in the global food preservatives market, primarily driven by the high consumption of processed foods and robust infrastructure for food processing and distribution. Europe also holds a significant share, followed by Asia-Pacific, which is expected to experience considerable growth in the coming years.
- North America Dominance Drivers: High consumption of processed food, well-established food processing infrastructure, and high disposable income.
- Europe Market Dynamics: Stringent regulations, increasing demand for clean-label products, and a focus on sustainability.
- Asia-Pacific Growth Potential: Rapid economic growth, increasing urbanization, and rising disposable incomes.
Food Preservatives Industry Product Developments
Recent product innovations in the food preservatives market are largely focused on developing natural and clean-label alternatives to synthetic preservatives. Companies are actively investing in research and development to create preservatives that meet consumer demands for healthier and more sustainable food products. These innovations are enhancing product shelf life, improving food safety, and broadening the applications of food preservatives across various food categories. Key advancements include the development of natural antimicrobial agents, enzymatic preservatives, and modified atmosphere packaging solutions, providing manufacturers with competitive edges in the market.
Challenges in the Food Preservatives Industry Market
The food preservatives industry faces several challenges, including stringent regulatory hurdles and increasing scrutiny on the use of synthetic preservatives. Fluctuations in raw material prices and supply chain disruptions impact production costs and availability. Intense competition from both established players and new entrants also presents a challenge. These factors can impact market growth and profitability. For example, xx% of companies reported supply chain disruptions in 2024, resulting in xx Million in lost revenue.
Forces Driving Food Preservatives Industry Growth
Several factors are driving growth in the food preservatives industry. Technological advancements, including the development of new preservation technologies, are enabling the production of safer and more effective preservatives. Economic growth and increasing disposable incomes are leading to higher food consumption, particularly in developing economies. Furthermore, favorable government regulations and policies are creating a supportive environment for market expansion.
Long-Term Growth Catalysts in Food Preservatives Industry
Long-term growth in the food preservatives industry will be driven by continuous innovation in preservation technologies, strategic partnerships between food companies and preservative manufacturers, and expansion into new and emerging markets.
Emerging Opportunities in Food Preservatives Industry
Emerging opportunities lie in the development of natural and sustainable preservatives, catering to the growing consumer demand for clean-label products. Expansion into emerging markets with high growth potential presents significant opportunities. Furthermore, the development of innovative preservation technologies and packaging solutions can unlock new avenues for market expansion.
Leading Players in the Food Preservatives Industry Sector
- Kemin Industries Inc
- Givaudan SA
- Synthite Industries Ltd
- International Flavors & Fragrances Inc
- Mane Kancor Ingredients Pvt Ltd
- BASF SE
- Tate & Lyle PLC
- Corbion NV
- Hawkins Watt Limited
- Eastman Chemical Company
- *List Not Exhaustive
Key Milestones in Food Preservatives Industry Industry
- July 2022: Kemin Industries Inc. launched RUBINITE GC Dry, a natural food preservative alternative to sodium nitrite.
- March 2022: DSM launched DelvoGuard cultures, extending the shelf life of dairy products with clean-label solutions.
- November 2021: Tate & Lyle PLC announced a new biomass boiler at its Brazilian acidulants plant.
- April 2021: Kemin Industries Inc. expanded its distribution agreement with DKSH in the Philippines and Indonesia.
Strategic Outlook for Food Preservatives Industry Market
The future of the food preservatives market is promising, with continued growth driven by increasing demand for processed foods, technological advancements, and a focus on sustainable and natural alternatives. Strategic partnerships, investments in R&D, and expansion into new markets will be crucial for companies seeking to capitalize on future growth opportunities.
Food Preservatives Industry Segmentation
-
1. Type
-
1.1. Antioxidants
- 1.1.1. Natural Antioxidants
- 1.1.2. Synthetic Antioxidants
-
1.2. Antimicrobials
- 1.2.1. Natural Antimicrobial
- 1.2.2. Synthetic Antimicrobial
- 1.3. Acidulant
- 1.4. Other Types
-
1.1. Antioxidants
-
2. Application
- 2.1. Bakery and Confectionery
- 2.2. Meat and Poultry
- 2.3. Ready Meals
- 2.4. Sweet and Savory Snacks
- 2.5. Sauces and Dressings
- 2.6. Edible Oils
- 2.7. Other Applications
Food Preservatives Industry Segmentation By Geography
-
1. North America
- 1.1. United States
- 1.2. Canada
- 1.3. Mexico
- 1.4. Rest of North America
-
2. Europe
- 2.1. Spain
- 2.2. United Kingdom
- 2.3. Germany
- 2.4. France
- 2.5. Italy
- 2.6. Russia
- 2.7. Rest of Europe
-
3. Asia Pacific
- 3.1. China
- 3.2. Japan
- 3.3. India
- 3.4. Australia
- 3.5. Rest of Asia Pacific
-
4. South America
- 4.1. Brazil
- 4.2. Argentina
- 4.3. Rest of South America
-
5. Middle East and Africa
- 5.1. South Africa
- 5.2. United Arab Emirates
- 5.3. Rest of Middle East and Africa
Food Preservatives Industry REPORT HIGHLIGHTS
| Aspects | Details |
|---|---|
| Study Period | 2019-2033 |
| Base Year | 2024 |
| Estimated Year | 2025 |
| Forecast Period | 2025-2033 |
| Historical Period | 2019-2024 |
| Growth Rate | CAGR of 4.81% from 2019-2033 |
| Segmentation |
|
Table of Contents
- 1. Introduction
- 1.1. Research Scope
- 1.2. Market Segmentation
- 1.3. Research Methodology
- 1.4. Definitions and Assumptions
- 2. Executive Summary
- 2.1. Introduction
- 3. Market Dynamics
- 3.1. Introduction
- 3.2. Market Drivers
- 3.3. Market Restrains
- 3.4. Market Trends
- 3.4.1. Surge in Demand for Clean Label Food Products
- 4. Market Factor Analysis
- 4.1. Porters Five Forces
- 4.2. Supply/Value Chain
- 4.3. PESTEL analysis
- 4.4. Market Entropy
- 4.5. Patent/Trademark Analysis
- 5. Global Food Preservatives Industry Analysis, Insights and Forecast, 2019-2031
- 5.1. Market Analysis, Insights and Forecast - by Type
- 5.1.1. Antioxidants
- 5.1.1.1. Natural Antioxidants
- 5.1.1.2. Synthetic Antioxidants
- 5.1.2. Antimicrobials
- 5.1.2.1. Natural Antimicrobial
- 5.1.2.2. Synthetic Antimicrobial
- 5.1.3. Acidulant
- 5.1.4. Other Types
- 5.1.1. Antioxidants
- 5.2. Market Analysis, Insights and Forecast - by Application
- 5.2.1. Bakery and Confectionery
- 5.2.2. Meat and Poultry
- 5.2.3. Ready Meals
- 5.2.4. Sweet and Savory Snacks
- 5.2.5. Sauces and Dressings
- 5.2.6. Edible Oils
- 5.2.7. Other Applications
- 5.3. Market Analysis, Insights and Forecast - by Region
- 5.3.1. North America
- 5.3.2. Europe
- 5.3.3. Asia Pacific
- 5.3.4. South America
- 5.3.5. Middle East and Africa
- 5.1. Market Analysis, Insights and Forecast - by Type
- 6. North America Food Preservatives Industry Analysis, Insights and Forecast, 2019-2031
- 6.1. Market Analysis, Insights and Forecast - by Type
- 6.1.1. Antioxidants
- 6.1.1.1. Natural Antioxidants
- 6.1.1.2. Synthetic Antioxidants
- 6.1.2. Antimicrobials
- 6.1.2.1. Natural Antimicrobial
- 6.1.2.2. Synthetic Antimicrobial
- 6.1.3. Acidulant
- 6.1.4. Other Types
- 6.1.1. Antioxidants
- 6.2. Market Analysis, Insights and Forecast - by Application
- 6.2.1. Bakery and Confectionery
- 6.2.2. Meat and Poultry
- 6.2.3. Ready Meals
- 6.2.4. Sweet and Savory Snacks
- 6.2.5. Sauces and Dressings
- 6.2.6. Edible Oils
- 6.2.7. Other Applications
- 6.1. Market Analysis, Insights and Forecast - by Type
- 7. Europe Food Preservatives Industry Analysis, Insights and Forecast, 2019-2031
- 7.1. Market Analysis, Insights and Forecast - by Type
- 7.1.1. Antioxidants
- 7.1.1.1. Natural Antioxidants
- 7.1.1.2. Synthetic Antioxidants
- 7.1.2. Antimicrobials
- 7.1.2.1. Natural Antimicrobial
- 7.1.2.2. Synthetic Antimicrobial
- 7.1.3. Acidulant
- 7.1.4. Other Types
- 7.1.1. Antioxidants
- 7.2. Market Analysis, Insights and Forecast - by Application
- 7.2.1. Bakery and Confectionery
- 7.2.2. Meat and Poultry
- 7.2.3. Ready Meals
- 7.2.4. Sweet and Savory Snacks
- 7.2.5. Sauces and Dressings
- 7.2.6. Edible Oils
- 7.2.7. Other Applications
- 7.1. Market Analysis, Insights and Forecast - by Type
- 8. Asia Pacific Food Preservatives Industry Analysis, Insights and Forecast, 2019-2031
- 8.1. Market Analysis, Insights and Forecast - by Type
- 8.1.1. Antioxidants
- 8.1.1.1. Natural Antioxidants
- 8.1.1.2. Synthetic Antioxidants
- 8.1.2. Antimicrobials
- 8.1.2.1. Natural Antimicrobial
- 8.1.2.2. Synthetic Antimicrobial
- 8.1.3. Acidulant
- 8.1.4. Other Types
- 8.1.1. Antioxidants
- 8.2. Market Analysis, Insights and Forecast - by Application
- 8.2.1. Bakery and Confectionery
- 8.2.2. Meat and Poultry
- 8.2.3. Ready Meals
- 8.2.4. Sweet and Savory Snacks
- 8.2.5. Sauces and Dressings
- 8.2.6. Edible Oils
- 8.2.7. Other Applications
- 8.1. Market Analysis, Insights and Forecast - by Type
- 9. South America Food Preservatives Industry Analysis, Insights and Forecast, 2019-2031
- 9.1. Market Analysis, Insights and Forecast - by Type
- 9.1.1. Antioxidants
- 9.1.1.1. Natural Antioxidants
- 9.1.1.2. Synthetic Antioxidants
- 9.1.2. Antimicrobials
- 9.1.2.1. Natural Antimicrobial
- 9.1.2.2. Synthetic Antimicrobial
- 9.1.3. Acidulant
- 9.1.4. Other Types
- 9.1.1. Antioxidants
- 9.2. Market Analysis, Insights and Forecast - by Application
- 9.2.1. Bakery and Confectionery
- 9.2.2. Meat and Poultry
- 9.2.3. Ready Meals
- 9.2.4. Sweet and Savory Snacks
- 9.2.5. Sauces and Dressings
- 9.2.6. Edible Oils
- 9.2.7. Other Applications
- 9.1. Market Analysis, Insights and Forecast - by Type
- 10. Middle East and Africa Food Preservatives Industry Analysis, Insights and Forecast, 2019-2031
- 10.1. Market Analysis, Insights and Forecast - by Type
- 10.1.1. Antioxidants
- 10.1.1.1. Natural Antioxidants
- 10.1.1.2. Synthetic Antioxidants
- 10.1.2. Antimicrobials
- 10.1.2.1. Natural Antimicrobial
- 10.1.2.2. Synthetic Antimicrobial
- 10.1.3. Acidulant
- 10.1.4. Other Types
- 10.1.1. Antioxidants
- 10.2. Market Analysis, Insights and Forecast - by Application
- 10.2.1. Bakery and Confectionery
- 10.2.2. Meat and Poultry
- 10.2.3. Ready Meals
- 10.2.4. Sweet and Savory Snacks
- 10.2.5. Sauces and Dressings
- 10.2.6. Edible Oils
- 10.2.7. Other Applications
- 10.1. Market Analysis, Insights and Forecast - by Type
- 11. Competitive Analysis
- 11.1. Global Market Share Analysis 2024
- 11.2. Company Profiles
- 11.2.1 Kemin Industries Inc
- 11.2.1.1. Overview
- 11.2.1.2. Products
- 11.2.1.3. SWOT Analysis
- 11.2.1.4. Recent Developments
- 11.2.1.5. Financials (Based on Availability)
- 11.2.2 Givuadan SA
- 11.2.2.1. Overview
- 11.2.2.2. Products
- 11.2.2.3. SWOT Analysis
- 11.2.2.4. Recent Developments
- 11.2.2.5. Financials (Based on Availability)
- 11.2.3 Synthite Industries Ltd
- 11.2.3.1. Overview
- 11.2.3.2. Products
- 11.2.3.3. SWOT Analysis
- 11.2.3.4. Recent Developments
- 11.2.3.5. Financials (Based on Availability)
- 11.2.4 International Flavors & Fragrances Inc
- 11.2.4.1. Overview
- 11.2.4.2. Products
- 11.2.4.3. SWOT Analysis
- 11.2.4.4. Recent Developments
- 11.2.4.5. Financials (Based on Availability)
- 11.2.5 Mane Kancor Ingredients Pvt Ltd
- 11.2.5.1. Overview
- 11.2.5.2. Products
- 11.2.5.3. SWOT Analysis
- 11.2.5.4. Recent Developments
- 11.2.5.5. Financials (Based on Availability)
- 11.2.6 BASF SE
- 11.2.6.1. Overview
- 11.2.6.2. Products
- 11.2.6.3. SWOT Analysis
- 11.2.6.4. Recent Developments
- 11.2.6.5. Financials (Based on Availability)
- 11.2.7 Tate & Lyle PLC
- 11.2.7.1. Overview
- 11.2.7.2. Products
- 11.2.7.3. SWOT Analysis
- 11.2.7.4. Recent Developments
- 11.2.7.5. Financials (Based on Availability)
- 11.2.8 Corbion NV
- 11.2.8.1. Overview
- 11.2.8.2. Products
- 11.2.8.3. SWOT Analysis
- 11.2.8.4. Recent Developments
- 11.2.8.5. Financials (Based on Availability)
- 11.2.9 Hawkins Watt Limited
- 11.2.9.1. Overview
- 11.2.9.2. Products
- 11.2.9.3. SWOT Analysis
- 11.2.9.4. Recent Developments
- 11.2.9.5. Financials (Based on Availability)
- 11.2.10 Eastman Chemical Company*List Not Exhaustive
- 11.2.10.1. Overview
- 11.2.10.2. Products
- 11.2.10.3. SWOT Analysis
- 11.2.10.4. Recent Developments
- 11.2.10.5. Financials (Based on Availability)
- 11.2.1 Kemin Industries Inc
List of Figures
- Figure 1: Global Food Preservatives Industry Revenue Breakdown (Million, %) by Region 2024 & 2032
- Figure 2: Global Food Preservatives Industry Volume Breakdown (Billion, %) by Region 2024 & 2032
- Figure 3: North America Food Preservatives Industry Revenue (Million), by Type 2024 & 2032
- Figure 4: North America Food Preservatives Industry Volume (Billion), by Type 2024 & 2032
- Figure 5: North America Food Preservatives Industry Revenue Share (%), by Type 2024 & 2032
- Figure 6: North America Food Preservatives Industry Volume Share (%), by Type 2024 & 2032
- Figure 7: North America Food Preservatives Industry Revenue (Million), by Application 2024 & 2032
- Figure 8: North America Food Preservatives Industry Volume (Billion), by Application 2024 & 2032
- Figure 9: North America Food Preservatives Industry Revenue Share (%), by Application 2024 & 2032
- Figure 10: North America Food Preservatives Industry Volume Share (%), by Application 2024 & 2032
- Figure 11: North America Food Preservatives Industry Revenue (Million), by Country 2024 & 2032
- Figure 12: North America Food Preservatives Industry Volume (Billion), by Country 2024 & 2032
- Figure 13: North America Food Preservatives Industry Revenue Share (%), by Country 2024 & 2032
- Figure 14: North America Food Preservatives Industry Volume Share (%), by Country 2024 & 2032
- Figure 15: Europe Food Preservatives Industry Revenue (Million), by Type 2024 & 2032
- Figure 16: Europe Food Preservatives Industry Volume (Billion), by Type 2024 & 2032
- Figure 17: Europe Food Preservatives Industry Revenue Share (%), by Type 2024 & 2032
- Figure 18: Europe Food Preservatives Industry Volume Share (%), by Type 2024 & 2032
- Figure 19: Europe Food Preservatives Industry Revenue (Million), by Application 2024 & 2032
- Figure 20: Europe Food Preservatives Industry Volume (Billion), by Application 2024 & 2032
- Figure 21: Europe Food Preservatives Industry Revenue Share (%), by Application 2024 & 2032
- Figure 22: Europe Food Preservatives Industry Volume Share (%), by Application 2024 & 2032
- Figure 23: Europe Food Preservatives Industry Revenue (Million), by Country 2024 & 2032
- Figure 24: Europe Food Preservatives Industry Volume (Billion), by Country 2024 & 2032
- Figure 25: Europe Food Preservatives Industry Revenue Share (%), by Country 2024 & 2032
- Figure 26: Europe Food Preservatives Industry Volume Share (%), by Country 2024 & 2032
- Figure 27: Asia Pacific Food Preservatives Industry Revenue (Million), by Type 2024 & 2032
- Figure 28: Asia Pacific Food Preservatives Industry Volume (Billion), by Type 2024 & 2032
- Figure 29: Asia Pacific Food Preservatives Industry Revenue Share (%), by Type 2024 & 2032
- Figure 30: Asia Pacific Food Preservatives Industry Volume Share (%), by Type 2024 & 2032
- Figure 31: Asia Pacific Food Preservatives Industry Revenue (Million), by Application 2024 & 2032
- Figure 32: Asia Pacific Food Preservatives Industry Volume (Billion), by Application 2024 & 2032
- Figure 33: Asia Pacific Food Preservatives Industry Revenue Share (%), by Application 2024 & 2032
- Figure 34: Asia Pacific Food Preservatives Industry Volume Share (%), by Application 2024 & 2032
- Figure 35: Asia Pacific Food Preservatives Industry Revenue (Million), by Country 2024 & 2032
- Figure 36: Asia Pacific Food Preservatives Industry Volume (Billion), by Country 2024 & 2032
- Figure 37: Asia Pacific Food Preservatives Industry Revenue Share (%), by Country 2024 & 2032
- Figure 38: Asia Pacific Food Preservatives Industry Volume Share (%), by Country 2024 & 2032
- Figure 39: South America Food Preservatives Industry Revenue (Million), by Type 2024 & 2032
- Figure 40: South America Food Preservatives Industry Volume (Billion), by Type 2024 & 2032
- Figure 41: South America Food Preservatives Industry Revenue Share (%), by Type 2024 & 2032
- Figure 42: South America Food Preservatives Industry Volume Share (%), by Type 2024 & 2032
- Figure 43: South America Food Preservatives Industry Revenue (Million), by Application 2024 & 2032
- Figure 44: South America Food Preservatives Industry Volume (Billion), by Application 2024 & 2032
- Figure 45: South America Food Preservatives Industry Revenue Share (%), by Application 2024 & 2032
- Figure 46: South America Food Preservatives Industry Volume Share (%), by Application 2024 & 2032
- Figure 47: South America Food Preservatives Industry Revenue (Million), by Country 2024 & 2032
- Figure 48: South America Food Preservatives Industry Volume (Billion), by Country 2024 & 2032
- Figure 49: South America Food Preservatives Industry Revenue Share (%), by Country 2024 & 2032
- Figure 50: South America Food Preservatives Industry Volume Share (%), by Country 2024 & 2032
- Figure 51: Middle East and Africa Food Preservatives Industry Revenue (Million), by Type 2024 & 2032
- Figure 52: Middle East and Africa Food Preservatives Industry Volume (Billion), by Type 2024 & 2032
- Figure 53: Middle East and Africa Food Preservatives Industry Revenue Share (%), by Type 2024 & 2032
- Figure 54: Middle East and Africa Food Preservatives Industry Volume Share (%), by Type 2024 & 2032
- Figure 55: Middle East and Africa Food Preservatives Industry Revenue (Million), by Application 2024 & 2032
- Figure 56: Middle East and Africa Food Preservatives Industry Volume (Billion), by Application 2024 & 2032
- Figure 57: Middle East and Africa Food Preservatives Industry Revenue Share (%), by Application 2024 & 2032
- Figure 58: Middle East and Africa Food Preservatives Industry Volume Share (%), by Application 2024 & 2032
- Figure 59: Middle East and Africa Food Preservatives Industry Revenue (Million), by Country 2024 & 2032
- Figure 60: Middle East and Africa Food Preservatives Industry Volume (Billion), by Country 2024 & 2032
- Figure 61: Middle East and Africa Food Preservatives Industry Revenue Share (%), by Country 2024 & 2032
- Figure 62: Middle East and Africa Food Preservatives Industry Volume Share (%), by Country 2024 & 2032
List of Tables
- Table 1: Global Food Preservatives Industry Revenue Million Forecast, by Region 2019 & 2032
- Table 2: Global Food Preservatives Industry Volume Billion Forecast, by Region 2019 & 2032
- Table 3: Global Food Preservatives Industry Revenue Million Forecast, by Type 2019 & 2032
- Table 4: Global Food Preservatives Industry Volume Billion Forecast, by Type 2019 & 2032
- Table 5: Global Food Preservatives Industry Revenue Million Forecast, by Application 2019 & 2032
- Table 6: Global Food Preservatives Industry Volume Billion Forecast, by Application 2019 & 2032
- Table 7: Global Food Preservatives Industry Revenue Million Forecast, by Region 2019 & 2032
- Table 8: Global Food Preservatives Industry Volume Billion Forecast, by Region 2019 & 2032
- Table 9: Global Food Preservatives Industry Revenue Million Forecast, by Type 2019 & 2032
- Table 10: Global Food Preservatives Industry Volume Billion Forecast, by Type 2019 & 2032
- Table 11: Global Food Preservatives Industry Revenue Million Forecast, by Application 2019 & 2032
- Table 12: Global Food Preservatives Industry Volume Billion Forecast, by Application 2019 & 2032
- Table 13: Global Food Preservatives Industry Revenue Million Forecast, by Country 2019 & 2032
- Table 14: Global Food Preservatives Industry Volume Billion Forecast, by Country 2019 & 2032
- Table 15: United States Food Preservatives Industry Revenue (Million) Forecast, by Application 2019 & 2032
- Table 16: United States Food Preservatives Industry Volume (Billion) Forecast, by Application 2019 & 2032
- Table 17: Canada Food Preservatives Industry Revenue (Million) Forecast, by Application 2019 & 2032
- Table 18: Canada Food Preservatives Industry Volume (Billion) Forecast, by Application 2019 & 2032
- Table 19: Mexico Food Preservatives Industry Revenue (Million) Forecast, by Application 2019 & 2032
- Table 20: Mexico Food Preservatives Industry Volume (Billion) Forecast, by Application 2019 & 2032
- Table 21: Rest of North America Food Preservatives Industry Revenue (Million) Forecast, by Application 2019 & 2032
- Table 22: Rest of North America Food Preservatives Industry Volume (Billion) Forecast, by Application 2019 & 2032
- Table 23: Global Food Preservatives Industry Revenue Million Forecast, by Type 2019 & 2032
- Table 24: Global Food Preservatives Industry Volume Billion Forecast, by Type 2019 & 2032
- Table 25: Global Food Preservatives Industry Revenue Million Forecast, by Application 2019 & 2032
- Table 26: Global Food Preservatives Industry Volume Billion Forecast, by Application 2019 & 2032
- Table 27: Global Food Preservatives Industry Revenue Million Forecast, by Country 2019 & 2032
- Table 28: Global Food Preservatives Industry Volume Billion Forecast, by Country 2019 & 2032
- Table 29: Spain Food Preservatives Industry Revenue (Million) Forecast, by Application 2019 & 2032
- Table 30: Spain Food Preservatives Industry Volume (Billion) Forecast, by Application 2019 & 2032
- Table 31: United Kingdom Food Preservatives Industry Revenue (Million) Forecast, by Application 2019 & 2032
- Table 32: United Kingdom Food Preservatives Industry Volume (Billion) Forecast, by Application 2019 & 2032
- Table 33: Germany Food Preservatives Industry Revenue (Million) Forecast, by Application 2019 & 2032
- Table 34: Germany Food Preservatives Industry Volume (Billion) Forecast, by Application 2019 & 2032
- Table 35: France Food Preservatives Industry Revenue (Million) Forecast, by Application 2019 & 2032
- Table 36: France Food Preservatives Industry Volume (Billion) Forecast, by Application 2019 & 2032
- Table 37: Italy Food Preservatives Industry Revenue (Million) Forecast, by Application 2019 & 2032
- Table 38: Italy Food Preservatives Industry Volume (Billion) Forecast, by Application 2019 & 2032
- Table 39: Russia Food Preservatives Industry Revenue (Million) Forecast, by Application 2019 & 2032
- Table 40: Russia Food Preservatives Industry Volume (Billion) Forecast, by Application 2019 & 2032
- Table 41: Rest of Europe Food Preservatives Industry Revenue (Million) Forecast, by Application 2019 & 2032
- Table 42: Rest of Europe Food Preservatives Industry Volume (Billion) Forecast, by Application 2019 & 2032
- Table 43: Global Food Preservatives Industry Revenue Million Forecast, by Type 2019 & 2032
- Table 44: Global Food Preservatives Industry Volume Billion Forecast, by Type 2019 & 2032
- Table 45: Global Food Preservatives Industry Revenue Million Forecast, by Application 2019 & 2032
- Table 46: Global Food Preservatives Industry Volume Billion Forecast, by Application 2019 & 2032
- Table 47: Global Food Preservatives Industry Revenue Million Forecast, by Country 2019 & 2032
- Table 48: Global Food Preservatives Industry Volume Billion Forecast, by Country 2019 & 2032
- Table 49: China Food Preservatives Industry Revenue (Million) Forecast, by Application 2019 & 2032
- Table 50: China Food Preservatives Industry Volume (Billion) Forecast, by Application 2019 & 2032
- Table 51: Japan Food Preservatives Industry Revenue (Million) Forecast, by Application 2019 & 2032
- Table 52: Japan Food Preservatives Industry Volume (Billion) Forecast, by Application 2019 & 2032
- Table 53: India Food Preservatives Industry Revenue (Million) Forecast, by Application 2019 & 2032
- Table 54: India Food Preservatives Industry Volume (Billion) Forecast, by Application 2019 & 2032
- Table 55: Australia Food Preservatives Industry Revenue (Million) Forecast, by Application 2019 & 2032
- Table 56: Australia Food Preservatives Industry Volume (Billion) Forecast, by Application 2019 & 2032
- Table 57: Rest of Asia Pacific Food Preservatives Industry Revenue (Million) Forecast, by Application 2019 & 2032
- Table 58: Rest of Asia Pacific Food Preservatives Industry Volume (Billion) Forecast, by Application 2019 & 2032
- Table 59: Global Food Preservatives Industry Revenue Million Forecast, by Type 2019 & 2032
- Table 60: Global Food Preservatives Industry Volume Billion Forecast, by Type 2019 & 2032
- Table 61: Global Food Preservatives Industry Revenue Million Forecast, by Application 2019 & 2032
- Table 62: Global Food Preservatives Industry Volume Billion Forecast, by Application 2019 & 2032
- Table 63: Global Food Preservatives Industry Revenue Million Forecast, by Country 2019 & 2032
- Table 64: Global Food Preservatives Industry Volume Billion Forecast, by Country 2019 & 2032
- Table 65: Brazil Food Preservatives Industry Revenue (Million) Forecast, by Application 2019 & 2032
- Table 66: Brazil Food Preservatives Industry Volume (Billion) Forecast, by Application 2019 & 2032
- Table 67: Argentina Food Preservatives Industry Revenue (Million) Forecast, by Application 2019 & 2032
- Table 68: Argentina Food Preservatives Industry Volume (Billion) Forecast, by Application 2019 & 2032
- Table 69: Rest of South America Food Preservatives Industry Revenue (Million) Forecast, by Application 2019 & 2032
- Table 70: Rest of South America Food Preservatives Industry Volume (Billion) Forecast, by Application 2019 & 2032
- Table 71: Global Food Preservatives Industry Revenue Million Forecast, by Type 2019 & 2032
- Table 72: Global Food Preservatives Industry Volume Billion Forecast, by Type 2019 & 2032
- Table 73: Global Food Preservatives Industry Revenue Million Forecast, by Application 2019 & 2032
- Table 74: Global Food Preservatives Industry Volume Billion Forecast, by Application 2019 & 2032
- Table 75: Global Food Preservatives Industry Revenue Million Forecast, by Country 2019 & 2032
- Table 76: Global Food Preservatives Industry Volume Billion Forecast, by Country 2019 & 2032
- Table 77: South Africa Food Preservatives Industry Revenue (Million) Forecast, by Application 2019 & 2032
- Table 78: South Africa Food Preservatives Industry Volume (Billion) Forecast, by Application 2019 & 2032
- Table 79: United Arab Emirates Food Preservatives Industry Revenue (Million) Forecast, by Application 2019 & 2032
- Table 80: United Arab Emirates Food Preservatives Industry Volume (Billion) Forecast, by Application 2019 & 2032
- Table 81: Rest of Middle East and Africa Food Preservatives Industry Revenue (Million) Forecast, by Application 2019 & 2032
- Table 82: Rest of Middle East and Africa Food Preservatives Industry Volume (Billion) Forecast, by Application 2019 & 2032
Frequently Asked Questions
1. What is the projected Compound Annual Growth Rate (CAGR) of the Food Preservatives Industry?
The projected CAGR is approximately 4.81%.
2. Which companies are prominent players in the Food Preservatives Industry?
Key companies in the market include Kemin Industries Inc, Givuadan SA, Synthite Industries Ltd, International Flavors & Fragrances Inc, Mane Kancor Ingredients Pvt Ltd, BASF SE, Tate & Lyle PLC, Corbion NV, Hawkins Watt Limited, Eastman Chemical Company*List Not Exhaustive.
3. What are the main segments of the Food Preservatives Industry?
The market segments include Type, Application.
4. Can you provide details about the market size?
The market size is estimated to be USD 3.40 Million as of 2022.
5. What are some drivers contributing to market growth?
N/A
6. What are the notable trends driving market growth?
Surge in Demand for Clean Label Food Products.
7. Are there any restraints impacting market growth?
N/A
8. Can you provide examples of recent developments in the market?
July 2022: Kemin Industries Inc. launched a new food preservative, RUBINITE GC Dry, as a substitute for sodium nitrite. As per the company, RUBINITE is a natural alternative that can be used as a curing agent in foods, offering the best microbiological protection and maintaining product stability. Furthermore, Kemin Industries intends to employ it in processed meat products like sausages and hot dogs.
9. What pricing options are available for accessing the report?
Pricing options include single-user, multi-user, and enterprise licenses priced at USD 4750, USD 5250, and USD 8750 respectively.
10. Is the market size provided in terms of value or volume?
The market size is provided in terms of value, measured in Million and volume, measured in Billion.
11. Are there any specific market keywords associated with the report?
Yes, the market keyword associated with the report is "Food Preservatives Industry," which aids in identifying and referencing the specific market segment covered.
12. How do I determine which pricing option suits my needs best?
The pricing options vary based on user requirements and access needs. Individual users may opt for single-user licenses, while businesses requiring broader access may choose multi-user or enterprise licenses for cost-effective access to the report.
13. Are there any additional resources or data provided in the Food Preservatives Industry report?
While the report offers comprehensive insights, it's advisable to review the specific contents or supplementary materials provided to ascertain if additional resources or data are available.
14. How can I stay updated on further developments or reports in the Food Preservatives Industry?
To stay informed about further developments, trends, and reports in the Food Preservatives Industry, consider subscribing to industry newsletters, following relevant companies and organizations, or regularly checking reputable industry news sources and publications.
Methodology
Step 1 - Identification of Relevant Samples Size from Population Database


Step 2 - Approaches for Defining Global Market Size (Value, Volume* & Price*)

Note*: In applicable scenarios
Step 3 - Data Sources
Primary Research
- Web Analytics
- Survey Reports
- Research Institute
- Latest Research Reports
- Opinion Leaders
Secondary Research
- Annual Reports
- White Paper
- Latest Press Release
- Industry Association
- Paid Database
- Investor Presentations

Step 4 - Data Triangulation
Involves using different sources of information in order to increase the validity of a study
These sources are likely to be stakeholders in a program - participants, other researchers, program staff, other community members, and so on.
Then we put all data in single framework & apply various statistical tools to find out the dynamic on the market.
During the analysis stage, feedback from the stakeholder groups would be compared to determine areas of agreement as well as areas of divergence
