

Key Insights
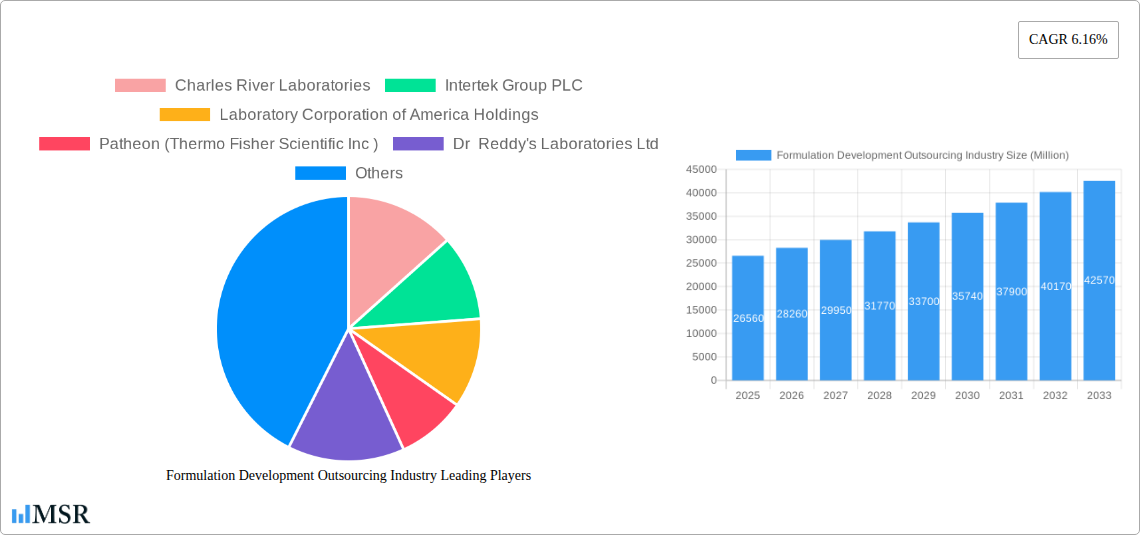
The Formulation Development Outsourcing (FDO) market is experiencing robust growth, projected to reach \$26.56 billion in 2025 and exhibiting a Compound Annual Growth Rate (CAGR) of 6.16% from 2025 to 2033. This expansion is driven by several key factors. Pharmaceutical and biopharmaceutical companies are increasingly outsourcing formulation development activities to leverage specialized expertise, reduce internal costs, and accelerate drug development timelines. The rising complexity of drug development, particularly in areas like oncology and biologics, necessitates access to advanced technologies and experienced personnel, further fueling demand for FDO services. Furthermore, stringent regulatory requirements and the need for efficient quality control processes are pushing companies to partner with established contract research organizations (CROs) offering comprehensive analytical and pre-formulation services. The market's segmentation reflects this diversity, with significant contributions from oncology, genetic disorders, and other therapeutic areas, across various dosage forms (injectable, oral, topical) and service types (pre-formulation, analytical, formulation optimization). The geographic distribution reveals a strong presence in North America and Europe, though the Asia-Pacific region is anticipated to demonstrate significant growth in the coming years due to increasing investments in pharmaceutical R&D and a growing domestic market.
The competitive landscape is characterized by a mix of large multinational CROs and specialized service providers. Leading players are continually investing in advanced technologies, expanding their service offerings, and forging strategic partnerships to maintain their market position. Future growth will likely be influenced by technological advancements in drug delivery systems, personalized medicine, and the increasing demand for cell and gene therapies. The growing adoption of digital technologies in drug development, including artificial intelligence (AI) and machine learning (ML), will also play a significant role in shaping the future of the FDO market. A continued focus on streamlining regulatory processes and enhancing data integrity will remain crucial for the success of FDO providers. The market’s sustained growth trajectory indicates substantial opportunities for companies capable of adapting to the evolving needs of the pharmaceutical industry.
Formulation Development Outsourcing Industry: A Comprehensive Market Report (2019-2033)
This in-depth report provides a comprehensive analysis of the Formulation Development Outsourcing industry, encompassing market size, growth drivers, key players, and future trends. Covering the period from 2019 to 2033, with a base year of 2025 and a forecast period of 2025-2033, this report offers invaluable insights for industry stakeholders, investors, and strategic decision-makers. The global market is projected to reach xx Million by 2033, exhibiting a CAGR of xx% during the forecast period.
Formulation Development Outsourcing Industry Market Concentration & Dynamics
The Formulation Development Outsourcing market exhibits a moderately concentrated landscape, with several large players holding significant market share. Key players such as Catalent Inc., Thermo Fisher Scientific (Patheon), and Lonza Group AG dominate the market, each contributing to a substantial portion of the overall revenue. However, a significant number of smaller, specialized companies also contribute significantly, particularly in niche areas such as specific therapeutic applications or dosage forms. Market share analysis reveals that the top 5 players collectively account for approximately xx% of the global market. The competitive landscape is characterized by intense innovation, with companies constantly striving to develop advanced technologies and services.
The regulatory framework plays a significant role, influencing both market access and the operational procedures of outsourcing providers. Stringent regulatory requirements, particularly in regions like North America and Europe, drive the demand for high-quality, compliant services. Substitute products are limited, although in-house formulation development remains a viable alternative, particularly for larger pharmaceutical companies with extensive internal capabilities. However, outsourcing remains a cost-effective and efficient option for many.
End-user trends reveal a growing preference for outsourcing, driven by factors such as cost reduction, access to specialized expertise, and faster time-to-market. Mergers and acquisitions (M&A) activity has been substantial in recent years, with xx major deals recorded between 2019 and 2024. These activities reflect the industry's consolidation trend and the efforts of key players to expand their service portfolios and geographical reach.
- Market Share: Top 5 players: xx%
- M&A Deal Count (2019-2024): xx
- Key Market Drivers: Cost reduction, access to specialized expertise, faster time-to-market, stringent regulations.
Formulation Development Outsourcing Industry Industry Insights & Trends
The Formulation Development Outsourcing market is experiencing robust growth, driven by several key factors. The increasing prevalence of chronic diseases such as cancer, cardiovascular disorders, and neurological conditions is significantly boosting demand for new drug formulations. This rise in demand for drug development is driving outsourcing as pharmaceutical companies look to improve efficiency and reduce development costs.
Technological advancements, such as the application of artificial intelligence (AI) and machine learning (ML) in formulation development, are streamlining processes and enhancing the speed and efficacy of drug development. Furthermore, the growing adoption of advanced analytical techniques, including high-throughput screening and advanced characterization methods, is improving formulation quality and reducing development time. Consumer behavior, in this context, shows a growing awareness of the critical role of formulation development in improving drug efficacy, safety, and patient compliance. This trend reinforces the demand for highly specialized services and drives innovation within the outsourcing sector. The global market size was valued at xx Million in 2024 and is projected to reach xx Million by 2033, representing a robust CAGR of xx%.

Key Markets & Segments Leading Formulation Development Outsourcing Industry
The North American region currently dominates the Formulation Development Outsourcing market, driven by the presence of major pharmaceutical companies and a robust regulatory framework. However, the Asia-Pacific region is expected to witness significant growth in the coming years, fueled by the expanding pharmaceutical industry and increasing investments in research and development.
Within the application segments, Oncology holds a substantial share, followed by other therapeutic areas such as Infectious Diseases and Cardiovascular conditions. The Pharmaceutical and Biopharmaceutical companies segment constitutes the largest end-user group. Pre-formulation services and Formulation Optimization are the most widely outsourced services. Oral and Injectable dosage forms are the leading segments.
- Dominant Region: North America
- Fastest-Growing Region: Asia-Pacific
- Leading Application Segment: Oncology
- Largest End-User Segment: Pharmaceutical and Biopharmaceutical Companies
- Leading Service Segment: Pre-formulation and Formulation Optimization
- Leading Dosage Form: Oral and Injectable
Drivers for Growth in Key Segments:
- Oncology: High prevalence of cancer, continuous innovation in cancer therapies, and demand for specialized formulations.
- Pharmaceutical and Biopharmaceutical Companies: Increasing R&D expenditure, preference for outsourcing to reduce costs and enhance efficiency.
- Pre-formulation Services: Importance of early-stage formulation development for successful drug development.
- Oral Dosage Forms: High patient preference for convenience and ease of administration.
Formulation Development Outsourcing Industry Product Developments
Recent years have witnessed significant advancements in formulation technologies, including the development of novel drug delivery systems, such as nanoparticles and liposomes, designed to enhance drug efficacy, reduce side effects, and improve patient compliance. The integration of advanced analytical techniques enables precise formulation optimization, ensuring consistent quality and performance. These innovations provide significant competitive advantages, allowing outsourcing providers to offer superior services and attract new clients.
Challenges in the Formulation Development Outsourcing Industry Market
The Formulation Development Outsourcing industry faces challenges, including stringent regulatory compliance requirements, which necessitate significant investments in quality control and assurance. Supply chain disruptions, particularly the availability of raw materials and specialized equipment, pose significant risks to operations and timely delivery of services. Intense competition among providers necessitates continuous innovation and cost optimization strategies to maintain profitability and market share. For example, xx% of projects were delayed due to supply chain issues in 2024.
Forces Driving Formulation Development Outsourcing Industry Growth
Technological advancements such as AI and machine learning are streamlining processes and increasing efficiency. Favorable regulatory policies in several regions are encouraging investment in pharmaceutical R&D. The growing prevalence of chronic diseases and increasing demand for innovative drug formulations are driving growth in the sector. For instance, the global expenditure on pharmaceutical R&D increased by xx% in 2024.
Challenges in the Formulation Development Outsourcing Industry Market
Long-term growth is driven by continuous innovation in drug delivery systems and advanced analytical techniques. Strategic partnerships between outsourcing providers and pharmaceutical companies further strengthen the sector's capabilities and market reach. Expansion into new geographical markets, especially in emerging economies, offers substantial growth opportunities.
Emerging Opportunities in Formulation Development Outsourcing Industry
Emerging opportunities lie in personalized medicine, which requires tailored formulations for individual patients. The growing adoption of advanced analytical techniques is creating new avenues for service diversification. Expansion into new therapeutic areas, such as gene therapy and cell therapy, provides lucrative growth prospects.
Leading Players in the Formulation Development Outsourcing Industry Sector
- Charles River Laboratories
- Intertek Group PLC
- Laboratory Corporation of America Holdings
- Patheon (Thermo Fisher Scientific Inc)
- Dr Reddy's Laboratories Ltd
- Irisys LLC
- Aizant Drug Research Solutions Private Limited
- Syngene International Ltd
- Lonza Group AG
- Piramal Pharma Solutions
- Qiotient Sciences
- Catalent Inc
- Emergent BioSolutions Inc
Key Milestones in Formulation Development Outsourcing Industry Industry
- 2021: Catalent Inc. launches a new advanced analytics platform for formulation development.
- 2022: Lonza Group AG announces a significant investment in expanding its manufacturing capacity for biologics.
- 2023: Thermo Fisher Scientific acquires a smaller formulation development company, strengthening its market position.
- 2024: Several key players invest heavily in AI and machine learning for formulation optimization.
Strategic Outlook for Formulation Development Outsourcing Industry Market
The Formulation Development Outsourcing market is poised for sustained growth, driven by ongoing technological advancements, increasing R&D investments, and the expanding demand for innovative drug formulations. Strategic partnerships, geographic expansion, and service diversification will be crucial for companies to succeed in this dynamic and competitive landscape. The market is expected to witness further consolidation, with larger players potentially acquiring smaller companies to expand their service portfolios and gain a larger market share.
Formulation Development Outsourcing Industry Segmentation
-
1. Service
-
1.1. Pre-formulation Services
- 1.1.1. Discovery and Preclinical Services
- 1.1.2. Analytical Services
-
1.2. Formulation Optimization
- 1.2.1. Phase I
- 1.2.2. Phase II
- 1.2.3. Phase III
- 1.2.4. Phase IV
-
1.1. Pre-formulation Services
-
2. Dosage Form
- 2.1. Injectable
- 2.2. Oral
- 2.3. Topical
- 2.4. Other Dosage Forms
-
3. Application
- 3.1. Oncology
- 3.2. Genetic Disorders
- 3.3. Neurology
- 3.4. Infectious Diseases
- 3.5. Respiratory
- 3.6. Cardiovascular
- 3.7. Other Applications
-
4. End User
- 4.1. Pharmaceutical and Biopharmaceutical Companies
- 4.2. Government and Academic Institutes
Formulation Development Outsourcing Industry Segmentation By Geography
-
1. North America
- 1.1. United States
- 1.2. Canada
- 1.3. Mexico
-
2. Europe
- 2.1. Germany
- 2.2. United Kingdom
- 2.3. France
- 2.4. Italy
- 2.5. Spain
- 2.6. Rest of Europe
-
3. Asia Pacific
- 3.1. China
- 3.2. Japan
- 3.3. India
- 3.4. Australia
- 3.5. South Korea
- 3.6. Rest of Asia Pacific
-
4. Middle East and Africa
- 4.1. GCC
- 4.2. South Africa
- 4.3. Rest of Middle East and Africa
-
5. South America
- 5.1. Brazil
- 5.2. Argentina
- 5.3. Rest of South America

Formulation Development Outsourcing Industry REPORT HIGHLIGHTS
| Aspects | Details |
|---|---|
| Study Period | 2019-2033 |
| Base Year | 2024 |
| Estimated Year | 2025 |
| Forecast Period | 2025-2033 |
| Historical Period | 2019-2024 |
| Growth Rate | CAGR of 6.16% from 2019-2033 |
| Segmentation |
|
Table of Contents
- 1. Introduction
- 1.1. Research Scope
- 1.2. Market Segmentation
- 1.3. Research Methodology
- 1.4. Definitions and Assumptions
- 2. Executive Summary
- 2.1. Introduction
- 3. Market Dynamics
- 3.1. Introduction
- 3.2. Market Drivers
- 3.2.1. Increasing Trend of Patent Protection Expiration of Major Drugs; Rising Number of Pharmaceutical and Biopharmaceutical Companies Outsourcing Their Services
- 3.3. Market Restrains
- 3.3.1. Structural Changes in the Pharmaceutical Industry; Insufficient Funding to Perform the Drug Development Process Through Formulation Development
- 3.4. Market Trends
- 3.4.1. The Oncology Segment is Expected to Witness Significant Growth over the Forecast Period
- 4. Market Factor Analysis
- 4.1. Porters Five Forces
- 4.2. Supply/Value Chain
- 4.3. PESTEL analysis
- 4.4. Market Entropy
- 4.5. Patent/Trademark Analysis
- 5. Global Formulation Development Outsourcing Industry Analysis, Insights and Forecast, 2019-2031
- 5.1. Market Analysis, Insights and Forecast - by Service
- 5.1.1. Pre-formulation Services
- 5.1.1.1. Discovery and Preclinical Services
- 5.1.1.2. Analytical Services
- 5.1.2. Formulation Optimization
- 5.1.2.1. Phase I
- 5.1.2.2. Phase II
- 5.1.2.3. Phase III
- 5.1.2.4. Phase IV
- 5.1.1. Pre-formulation Services
- 5.2. Market Analysis, Insights and Forecast - by Dosage Form
- 5.2.1. Injectable
- 5.2.2. Oral
- 5.2.3. Topical
- 5.2.4. Other Dosage Forms
- 5.3. Market Analysis, Insights and Forecast - by Application
- 5.3.1. Oncology
- 5.3.2. Genetic Disorders
- 5.3.3. Neurology
- 5.3.4. Infectious Diseases
- 5.3.5. Respiratory
- 5.3.6. Cardiovascular
- 5.3.7. Other Applications
- 5.4. Market Analysis, Insights and Forecast - by End User
- 5.4.1. Pharmaceutical and Biopharmaceutical Companies
- 5.4.2. Government and Academic Institutes
- 5.5. Market Analysis, Insights and Forecast - by Region
- 5.5.1. North America
- 5.5.2. Europe
- 5.5.3. Asia Pacific
- 5.5.4. Middle East and Africa
- 5.5.5. South America
- 5.1. Market Analysis, Insights and Forecast - by Service
- 6. North America Formulation Development Outsourcing Industry Analysis, Insights and Forecast, 2019-2031
- 6.1. Market Analysis, Insights and Forecast - by Service
- 6.1.1. Pre-formulation Services
- 6.1.1.1. Discovery and Preclinical Services
- 6.1.1.2. Analytical Services
- 6.1.2. Formulation Optimization
- 6.1.2.1. Phase I
- 6.1.2.2. Phase II
- 6.1.2.3. Phase III
- 6.1.2.4. Phase IV
- 6.1.1. Pre-formulation Services
- 6.2. Market Analysis, Insights and Forecast - by Dosage Form
- 6.2.1. Injectable
- 6.2.2. Oral
- 6.2.3. Topical
- 6.2.4. Other Dosage Forms
- 6.3. Market Analysis, Insights and Forecast - by Application
- 6.3.1. Oncology
- 6.3.2. Genetic Disorders
- 6.3.3. Neurology
- 6.3.4. Infectious Diseases
- 6.3.5. Respiratory
- 6.3.6. Cardiovascular
- 6.3.7. Other Applications
- 6.4. Market Analysis, Insights and Forecast - by End User
- 6.4.1. Pharmaceutical and Biopharmaceutical Companies
- 6.4.2. Government and Academic Institutes
- 6.1. Market Analysis, Insights and Forecast - by Service
- 7. Europe Formulation Development Outsourcing Industry Analysis, Insights and Forecast, 2019-2031
- 7.1. Market Analysis, Insights and Forecast - by Service
- 7.1.1. Pre-formulation Services
- 7.1.1.1. Discovery and Preclinical Services
- 7.1.1.2. Analytical Services
- 7.1.2. Formulation Optimization
- 7.1.2.1. Phase I
- 7.1.2.2. Phase II
- 7.1.2.3. Phase III
- 7.1.2.4. Phase IV
- 7.1.1. Pre-formulation Services
- 7.2. Market Analysis, Insights and Forecast - by Dosage Form
- 7.2.1. Injectable
- 7.2.2. Oral
- 7.2.3. Topical
- 7.2.4. Other Dosage Forms
- 7.3. Market Analysis, Insights and Forecast - by Application
- 7.3.1. Oncology
- 7.3.2. Genetic Disorders
- 7.3.3. Neurology
- 7.3.4. Infectious Diseases
- 7.3.5. Respiratory
- 7.3.6. Cardiovascular
- 7.3.7. Other Applications
- 7.4. Market Analysis, Insights and Forecast - by End User
- 7.4.1. Pharmaceutical and Biopharmaceutical Companies
- 7.4.2. Government and Academic Institutes
- 7.1. Market Analysis, Insights and Forecast - by Service
- 8. Asia Pacific Formulation Development Outsourcing Industry Analysis, Insights and Forecast, 2019-2031
- 8.1. Market Analysis, Insights and Forecast - by Service
- 8.1.1. Pre-formulation Services
- 8.1.1.1. Discovery and Preclinical Services
- 8.1.1.2. Analytical Services
- 8.1.2. Formulation Optimization
- 8.1.2.1. Phase I
- 8.1.2.2. Phase II
- 8.1.2.3. Phase III
- 8.1.2.4. Phase IV
- 8.1.1. Pre-formulation Services
- 8.2. Market Analysis, Insights and Forecast - by Dosage Form
- 8.2.1. Injectable
- 8.2.2. Oral
- 8.2.3. Topical
- 8.2.4. Other Dosage Forms
- 8.3. Market Analysis, Insights and Forecast - by Application
- 8.3.1. Oncology
- 8.3.2. Genetic Disorders
- 8.3.3. Neurology
- 8.3.4. Infectious Diseases
- 8.3.5. Respiratory
- 8.3.6. Cardiovascular
- 8.3.7. Other Applications
- 8.4. Market Analysis, Insights and Forecast - by End User
- 8.4.1. Pharmaceutical and Biopharmaceutical Companies
- 8.4.2. Government and Academic Institutes
- 8.1. Market Analysis, Insights and Forecast - by Service
- 9. Middle East and Africa Formulation Development Outsourcing Industry Analysis, Insights and Forecast, 2019-2031
- 9.1. Market Analysis, Insights and Forecast - by Service
- 9.1.1. Pre-formulation Services
- 9.1.1.1. Discovery and Preclinical Services
- 9.1.1.2. Analytical Services
- 9.1.2. Formulation Optimization
- 9.1.2.1. Phase I
- 9.1.2.2. Phase II
- 9.1.2.3. Phase III
- 9.1.2.4. Phase IV
- 9.1.1. Pre-formulation Services
- 9.2. Market Analysis, Insights and Forecast - by Dosage Form
- 9.2.1. Injectable
- 9.2.2. Oral
- 9.2.3. Topical
- 9.2.4. Other Dosage Forms
- 9.3. Market Analysis, Insights and Forecast - by Application
- 9.3.1. Oncology
- 9.3.2. Genetic Disorders
- 9.3.3. Neurology
- 9.3.4. Infectious Diseases
- 9.3.5. Respiratory
- 9.3.6. Cardiovascular
- 9.3.7. Other Applications
- 9.4. Market Analysis, Insights and Forecast - by End User
- 9.4.1. Pharmaceutical and Biopharmaceutical Companies
- 9.4.2. Government and Academic Institutes
- 9.1. Market Analysis, Insights and Forecast - by Service
- 10. South America Formulation Development Outsourcing Industry Analysis, Insights and Forecast, 2019-2031
- 10.1. Market Analysis, Insights and Forecast - by Service
- 10.1.1. Pre-formulation Services
- 10.1.1.1. Discovery and Preclinical Services
- 10.1.1.2. Analytical Services
- 10.1.2. Formulation Optimization
- 10.1.2.1. Phase I
- 10.1.2.2. Phase II
- 10.1.2.3. Phase III
- 10.1.2.4. Phase IV
- 10.1.1. Pre-formulation Services
- 10.2. Market Analysis, Insights and Forecast - by Dosage Form
- 10.2.1. Injectable
- 10.2.2. Oral
- 10.2.3. Topical
- 10.2.4. Other Dosage Forms
- 10.3. Market Analysis, Insights and Forecast - by Application
- 10.3.1. Oncology
- 10.3.2. Genetic Disorders
- 10.3.3. Neurology
- 10.3.4. Infectious Diseases
- 10.3.5. Respiratory
- 10.3.6. Cardiovascular
- 10.3.7. Other Applications
- 10.4. Market Analysis, Insights and Forecast - by End User
- 10.4.1. Pharmaceutical and Biopharmaceutical Companies
- 10.4.2. Government and Academic Institutes
- 10.1. Market Analysis, Insights and Forecast - by Service
- 11. North America Formulation Development Outsourcing Industry Analysis, Insights and Forecast, 2019-2031
- 11.1. Market Analysis, Insights and Forecast - By Country/Sub-region
- 11.1.1 United States
- 11.1.2 Canada
- 11.1.3 Mexico
- 12. Europe Formulation Development Outsourcing Industry Analysis, Insights and Forecast, 2019-2031
- 12.1. Market Analysis, Insights and Forecast - By Country/Sub-region
- 12.1.1 Germany
- 12.1.2 United Kingdom
- 12.1.3 France
- 12.1.4 Italy
- 12.1.5 Spain
- 12.1.6 Rest of Europe
- 13. Asia Pacific Formulation Development Outsourcing Industry Analysis, Insights and Forecast, 2019-2031
- 13.1. Market Analysis, Insights and Forecast - By Country/Sub-region
- 13.1.1 China
- 13.1.2 Japan
- 13.1.3 India
- 13.1.4 Australia
- 13.1.5 South Korea
- 13.1.6 Rest of Asia Pacific
- 14. Middle East and Africa Formulation Development Outsourcing Industry Analysis, Insights and Forecast, 2019-2031
- 14.1. Market Analysis, Insights and Forecast - By Country/Sub-region
- 14.1.1 GCC
- 14.1.2 South Africa
- 14.1.3 Rest of Middle East and Africa
- 15. South America Formulation Development Outsourcing Industry Analysis, Insights and Forecast, 2019-2031
- 15.1. Market Analysis, Insights and Forecast - By Country/Sub-region
- 15.1.1 Brazil
- 15.1.2 Argentina
- 15.1.3 Rest of South America
- 16. Competitive Analysis
- 16.1. Global Market Share Analysis 2024
- 16.2. Company Profiles
- 16.2.1 Charles River Laboratories
- 16.2.1.1. Overview
- 16.2.1.2. Products
- 16.2.1.3. SWOT Analysis
- 16.2.1.4. Recent Developments
- 16.2.1.5. Financials (Based on Availability)
- 16.2.2 Intertek Group PLC
- 16.2.2.1. Overview
- 16.2.2.2. Products
- 16.2.2.3. SWOT Analysis
- 16.2.2.4. Recent Developments
- 16.2.2.5. Financials (Based on Availability)
- 16.2.3 Laboratory Corporation of America Holdings
- 16.2.3.1. Overview
- 16.2.3.2. Products
- 16.2.3.3. SWOT Analysis
- 16.2.3.4. Recent Developments
- 16.2.3.5. Financials (Based on Availability)
- 16.2.4 Patheon (Thermo Fisher Scientific Inc )
- 16.2.4.1. Overview
- 16.2.4.2. Products
- 16.2.4.3. SWOT Analysis
- 16.2.4.4. Recent Developments
- 16.2.4.5. Financials (Based on Availability)
- 16.2.5 Dr Reddy's Laboratories Ltd
- 16.2.5.1. Overview
- 16.2.5.2. Products
- 16.2.5.3. SWOT Analysis
- 16.2.5.4. Recent Developments
- 16.2.5.5. Financials (Based on Availability)
- 16.2.6 Irisys LLC
- 16.2.6.1. Overview
- 16.2.6.2. Products
- 16.2.6.3. SWOT Analysis
- 16.2.6.4. Recent Developments
- 16.2.6.5. Financials (Based on Availability)
- 16.2.7 Aizant Drug Research Solutions Private Limited
- 16.2.7.1. Overview
- 16.2.7.2. Products
- 16.2.7.3. SWOT Analysis
- 16.2.7.4. Recent Developments
- 16.2.7.5. Financials (Based on Availability)
- 16.2.8 Syngene International Ltd
- 16.2.8.1. Overview
- 16.2.8.2. Products
- 16.2.8.3. SWOT Analysis
- 16.2.8.4. Recent Developments
- 16.2.8.5. Financials (Based on Availability)
- 16.2.9 Lonza Group AG
- 16.2.9.1. Overview
- 16.2.9.2. Products
- 16.2.9.3. SWOT Analysis
- 16.2.9.4. Recent Developments
- 16.2.9.5. Financials (Based on Availability)
- 16.2.10 Piramal Pharma Solutions
- 16.2.10.1. Overview
- 16.2.10.2. Products
- 16.2.10.3. SWOT Analysis
- 16.2.10.4. Recent Developments
- 16.2.10.5. Financials (Based on Availability)
- 16.2.11 Qiotient Sciences
- 16.2.11.1. Overview
- 16.2.11.2. Products
- 16.2.11.3. SWOT Analysis
- 16.2.11.4. Recent Developments
- 16.2.11.5. Financials (Based on Availability)
- 16.2.12 Catalent Inc
- 16.2.12.1. Overview
- 16.2.12.2. Products
- 16.2.12.3. SWOT Analysis
- 16.2.12.4. Recent Developments
- 16.2.12.5. Financials (Based on Availability)
- 16.2.13 Emergent BioSolutions Inc
- 16.2.13.1. Overview
- 16.2.13.2. Products
- 16.2.13.3. SWOT Analysis
- 16.2.13.4. Recent Developments
- 16.2.13.5. Financials (Based on Availability)
- 16.2.1 Charles River Laboratories
List of Figures
- Figure 1: Global Formulation Development Outsourcing Industry Revenue Breakdown (Million, %) by Region 2024 & 2032
- Figure 2: North America Formulation Development Outsourcing Industry Revenue (Million), by Country 2024 & 2032
- Figure 3: North America Formulation Development Outsourcing Industry Revenue Share (%), by Country 2024 & 2032
- Figure 4: Europe Formulation Development Outsourcing Industry Revenue (Million), by Country 2024 & 2032
- Figure 5: Europe Formulation Development Outsourcing Industry Revenue Share (%), by Country 2024 & 2032
- Figure 6: Asia Pacific Formulation Development Outsourcing Industry Revenue (Million), by Country 2024 & 2032
- Figure 7: Asia Pacific Formulation Development Outsourcing Industry Revenue Share (%), by Country 2024 & 2032
- Figure 8: Middle East and Africa Formulation Development Outsourcing Industry Revenue (Million), by Country 2024 & 2032
- Figure 9: Middle East and Africa Formulation Development Outsourcing Industry Revenue Share (%), by Country 2024 & 2032
- Figure 10: South America Formulation Development Outsourcing Industry Revenue (Million), by Country 2024 & 2032
- Figure 11: South America Formulation Development Outsourcing Industry Revenue Share (%), by Country 2024 & 2032
- Figure 12: North America Formulation Development Outsourcing Industry Revenue (Million), by Service 2024 & 2032
- Figure 13: North America Formulation Development Outsourcing Industry Revenue Share (%), by Service 2024 & 2032
- Figure 14: North America Formulation Development Outsourcing Industry Revenue (Million), by Dosage Form 2024 & 2032
- Figure 15: North America Formulation Development Outsourcing Industry Revenue Share (%), by Dosage Form 2024 & 2032
- Figure 16: North America Formulation Development Outsourcing Industry Revenue (Million), by Application 2024 & 2032
- Figure 17: North America Formulation Development Outsourcing Industry Revenue Share (%), by Application 2024 & 2032
- Figure 18: North America Formulation Development Outsourcing Industry Revenue (Million), by End User 2024 & 2032
- Figure 19: North America Formulation Development Outsourcing Industry Revenue Share (%), by End User 2024 & 2032
- Figure 20: North America Formulation Development Outsourcing Industry Revenue (Million), by Country 2024 & 2032
- Figure 21: North America Formulation Development Outsourcing Industry Revenue Share (%), by Country 2024 & 2032
- Figure 22: Europe Formulation Development Outsourcing Industry Revenue (Million), by Service 2024 & 2032
- Figure 23: Europe Formulation Development Outsourcing Industry Revenue Share (%), by Service 2024 & 2032
- Figure 24: Europe Formulation Development Outsourcing Industry Revenue (Million), by Dosage Form 2024 & 2032
- Figure 25: Europe Formulation Development Outsourcing Industry Revenue Share (%), by Dosage Form 2024 & 2032
- Figure 26: Europe Formulation Development Outsourcing Industry Revenue (Million), by Application 2024 & 2032
- Figure 27: Europe Formulation Development Outsourcing Industry Revenue Share (%), by Application 2024 & 2032
- Figure 28: Europe Formulation Development Outsourcing Industry Revenue (Million), by End User 2024 & 2032
- Figure 29: Europe Formulation Development Outsourcing Industry Revenue Share (%), by End User 2024 & 2032
- Figure 30: Europe Formulation Development Outsourcing Industry Revenue (Million), by Country 2024 & 2032
- Figure 31: Europe Formulation Development Outsourcing Industry Revenue Share (%), by Country 2024 & 2032
- Figure 32: Asia Pacific Formulation Development Outsourcing Industry Revenue (Million), by Service 2024 & 2032
- Figure 33: Asia Pacific Formulation Development Outsourcing Industry Revenue Share (%), by Service 2024 & 2032
- Figure 34: Asia Pacific Formulation Development Outsourcing Industry Revenue (Million), by Dosage Form 2024 & 2032
- Figure 35: Asia Pacific Formulation Development Outsourcing Industry Revenue Share (%), by Dosage Form 2024 & 2032
- Figure 36: Asia Pacific Formulation Development Outsourcing Industry Revenue (Million), by Application 2024 & 2032
- Figure 37: Asia Pacific Formulation Development Outsourcing Industry Revenue Share (%), by Application 2024 & 2032
- Figure 38: Asia Pacific Formulation Development Outsourcing Industry Revenue (Million), by End User 2024 & 2032
- Figure 39: Asia Pacific Formulation Development Outsourcing Industry Revenue Share (%), by End User 2024 & 2032
- Figure 40: Asia Pacific Formulation Development Outsourcing Industry Revenue (Million), by Country 2024 & 2032
- Figure 41: Asia Pacific Formulation Development Outsourcing Industry Revenue Share (%), by Country 2024 & 2032
- Figure 42: Middle East and Africa Formulation Development Outsourcing Industry Revenue (Million), by Service 2024 & 2032
- Figure 43: Middle East and Africa Formulation Development Outsourcing Industry Revenue Share (%), by Service 2024 & 2032
- Figure 44: Middle East and Africa Formulation Development Outsourcing Industry Revenue (Million), by Dosage Form 2024 & 2032
- Figure 45: Middle East and Africa Formulation Development Outsourcing Industry Revenue Share (%), by Dosage Form 2024 & 2032
- Figure 46: Middle East and Africa Formulation Development Outsourcing Industry Revenue (Million), by Application 2024 & 2032
- Figure 47: Middle East and Africa Formulation Development Outsourcing Industry Revenue Share (%), by Application 2024 & 2032
- Figure 48: Middle East and Africa Formulation Development Outsourcing Industry Revenue (Million), by End User 2024 & 2032
- Figure 49: Middle East and Africa Formulation Development Outsourcing Industry Revenue Share (%), by End User 2024 & 2032
- Figure 50: Middle East and Africa Formulation Development Outsourcing Industry Revenue (Million), by Country 2024 & 2032
- Figure 51: Middle East and Africa Formulation Development Outsourcing Industry Revenue Share (%), by Country 2024 & 2032
- Figure 52: South America Formulation Development Outsourcing Industry Revenue (Million), by Service 2024 & 2032
- Figure 53: South America Formulation Development Outsourcing Industry Revenue Share (%), by Service 2024 & 2032
- Figure 54: South America Formulation Development Outsourcing Industry Revenue (Million), by Dosage Form 2024 & 2032
- Figure 55: South America Formulation Development Outsourcing Industry Revenue Share (%), by Dosage Form 2024 & 2032
- Figure 56: South America Formulation Development Outsourcing Industry Revenue (Million), by Application 2024 & 2032
- Figure 57: South America Formulation Development Outsourcing Industry Revenue Share (%), by Application 2024 & 2032
- Figure 58: South America Formulation Development Outsourcing Industry Revenue (Million), by End User 2024 & 2032
- Figure 59: South America Formulation Development Outsourcing Industry Revenue Share (%), by End User 2024 & 2032
- Figure 60: South America Formulation Development Outsourcing Industry Revenue (Million), by Country 2024 & 2032
- Figure 61: South America Formulation Development Outsourcing Industry Revenue Share (%), by Country 2024 & 2032
List of Tables
- Table 1: Global Formulation Development Outsourcing Industry Revenue Million Forecast, by Region 2019 & 2032
- Table 2: Global Formulation Development Outsourcing Industry Revenue Million Forecast, by Service 2019 & 2032
- Table 3: Global Formulation Development Outsourcing Industry Revenue Million Forecast, by Dosage Form 2019 & 2032
- Table 4: Global Formulation Development Outsourcing Industry Revenue Million Forecast, by Application 2019 & 2032
- Table 5: Global Formulation Development Outsourcing Industry Revenue Million Forecast, by End User 2019 & 2032
- Table 6: Global Formulation Development Outsourcing Industry Revenue Million Forecast, by Region 2019 & 2032
- Table 7: Global Formulation Development Outsourcing Industry Revenue Million Forecast, by Country 2019 & 2032
- Table 8: United States Formulation Development Outsourcing Industry Revenue (Million) Forecast, by Application 2019 & 2032
- Table 9: Canada Formulation Development Outsourcing Industry Revenue (Million) Forecast, by Application 2019 & 2032
- Table 10: Mexico Formulation Development Outsourcing Industry Revenue (Million) Forecast, by Application 2019 & 2032
- Table 11: Global Formulation Development Outsourcing Industry Revenue Million Forecast, by Country 2019 & 2032
- Table 12: Germany Formulation Development Outsourcing Industry Revenue (Million) Forecast, by Application 2019 & 2032
- Table 13: United Kingdom Formulation Development Outsourcing Industry Revenue (Million) Forecast, by Application 2019 & 2032
- Table 14: France Formulation Development Outsourcing Industry Revenue (Million) Forecast, by Application 2019 & 2032
- Table 15: Italy Formulation Development Outsourcing Industry Revenue (Million) Forecast, by Application 2019 & 2032
- Table 16: Spain Formulation Development Outsourcing Industry Revenue (Million) Forecast, by Application 2019 & 2032
- Table 17: Rest of Europe Formulation Development Outsourcing Industry Revenue (Million) Forecast, by Application 2019 & 2032
- Table 18: Global Formulation Development Outsourcing Industry Revenue Million Forecast, by Country 2019 & 2032
- Table 19: China Formulation Development Outsourcing Industry Revenue (Million) Forecast, by Application 2019 & 2032
- Table 20: Japan Formulation Development Outsourcing Industry Revenue (Million) Forecast, by Application 2019 & 2032
- Table 21: India Formulation Development Outsourcing Industry Revenue (Million) Forecast, by Application 2019 & 2032
- Table 22: Australia Formulation Development Outsourcing Industry Revenue (Million) Forecast, by Application 2019 & 2032
- Table 23: South Korea Formulation Development Outsourcing Industry Revenue (Million) Forecast, by Application 2019 & 2032
- Table 24: Rest of Asia Pacific Formulation Development Outsourcing Industry Revenue (Million) Forecast, by Application 2019 & 2032
- Table 25: Global Formulation Development Outsourcing Industry Revenue Million Forecast, by Country 2019 & 2032
- Table 26: GCC Formulation Development Outsourcing Industry Revenue (Million) Forecast, by Application 2019 & 2032
- Table 27: South Africa Formulation Development Outsourcing Industry Revenue (Million) Forecast, by Application 2019 & 2032
- Table 28: Rest of Middle East and Africa Formulation Development Outsourcing Industry Revenue (Million) Forecast, by Application 2019 & 2032
- Table 29: Global Formulation Development Outsourcing Industry Revenue Million Forecast, by Country 2019 & 2032
- Table 30: Brazil Formulation Development Outsourcing Industry Revenue (Million) Forecast, by Application 2019 & 2032
- Table 31: Argentina Formulation Development Outsourcing Industry Revenue (Million) Forecast, by Application 2019 & 2032
- Table 32: Rest of South America Formulation Development Outsourcing Industry Revenue (Million) Forecast, by Application 2019 & 2032
- Table 33: Global Formulation Development Outsourcing Industry Revenue Million Forecast, by Service 2019 & 2032
- Table 34: Global Formulation Development Outsourcing Industry Revenue Million Forecast, by Dosage Form 2019 & 2032
- Table 35: Global Formulation Development Outsourcing Industry Revenue Million Forecast, by Application 2019 & 2032
- Table 36: Global Formulation Development Outsourcing Industry Revenue Million Forecast, by End User 2019 & 2032
- Table 37: Global Formulation Development Outsourcing Industry Revenue Million Forecast, by Country 2019 & 2032
- Table 38: United States Formulation Development Outsourcing Industry Revenue (Million) Forecast, by Application 2019 & 2032
- Table 39: Canada Formulation Development Outsourcing Industry Revenue (Million) Forecast, by Application 2019 & 2032
- Table 40: Mexico Formulation Development Outsourcing Industry Revenue (Million) Forecast, by Application 2019 & 2032
- Table 41: Global Formulation Development Outsourcing Industry Revenue Million Forecast, by Service 2019 & 2032
- Table 42: Global Formulation Development Outsourcing Industry Revenue Million Forecast, by Dosage Form 2019 & 2032
- Table 43: Global Formulation Development Outsourcing Industry Revenue Million Forecast, by Application 2019 & 2032
- Table 44: Global Formulation Development Outsourcing Industry Revenue Million Forecast, by End User 2019 & 2032
- Table 45: Global Formulation Development Outsourcing Industry Revenue Million Forecast, by Country 2019 & 2032
- Table 46: Germany Formulation Development Outsourcing Industry Revenue (Million) Forecast, by Application 2019 & 2032
- Table 47: United Kingdom Formulation Development Outsourcing Industry Revenue (Million) Forecast, by Application 2019 & 2032
- Table 48: France Formulation Development Outsourcing Industry Revenue (Million) Forecast, by Application 2019 & 2032
- Table 49: Italy Formulation Development Outsourcing Industry Revenue (Million) Forecast, by Application 2019 & 2032
- Table 50: Spain Formulation Development Outsourcing Industry Revenue (Million) Forecast, by Application 2019 & 2032
- Table 51: Rest of Europe Formulation Development Outsourcing Industry Revenue (Million) Forecast, by Application 2019 & 2032
- Table 52: Global Formulation Development Outsourcing Industry Revenue Million Forecast, by Service 2019 & 2032
- Table 53: Global Formulation Development Outsourcing Industry Revenue Million Forecast, by Dosage Form 2019 & 2032
- Table 54: Global Formulation Development Outsourcing Industry Revenue Million Forecast, by Application 2019 & 2032
- Table 55: Global Formulation Development Outsourcing Industry Revenue Million Forecast, by End User 2019 & 2032
- Table 56: Global Formulation Development Outsourcing Industry Revenue Million Forecast, by Country 2019 & 2032
- Table 57: China Formulation Development Outsourcing Industry Revenue (Million) Forecast, by Application 2019 & 2032
- Table 58: Japan Formulation Development Outsourcing Industry Revenue (Million) Forecast, by Application 2019 & 2032
- Table 59: India Formulation Development Outsourcing Industry Revenue (Million) Forecast, by Application 2019 & 2032
- Table 60: Australia Formulation Development Outsourcing Industry Revenue (Million) Forecast, by Application 2019 & 2032
- Table 61: South Korea Formulation Development Outsourcing Industry Revenue (Million) Forecast, by Application 2019 & 2032
- Table 62: Rest of Asia Pacific Formulation Development Outsourcing Industry Revenue (Million) Forecast, by Application 2019 & 2032
- Table 63: Global Formulation Development Outsourcing Industry Revenue Million Forecast, by Service 2019 & 2032
- Table 64: Global Formulation Development Outsourcing Industry Revenue Million Forecast, by Dosage Form 2019 & 2032
- Table 65: Global Formulation Development Outsourcing Industry Revenue Million Forecast, by Application 2019 & 2032
- Table 66: Global Formulation Development Outsourcing Industry Revenue Million Forecast, by End User 2019 & 2032
- Table 67: Global Formulation Development Outsourcing Industry Revenue Million Forecast, by Country 2019 & 2032
- Table 68: GCC Formulation Development Outsourcing Industry Revenue (Million) Forecast, by Application 2019 & 2032
- Table 69: South Africa Formulation Development Outsourcing Industry Revenue (Million) Forecast, by Application 2019 & 2032
- Table 70: Rest of Middle East and Africa Formulation Development Outsourcing Industry Revenue (Million) Forecast, by Application 2019 & 2032
- Table 71: Global Formulation Development Outsourcing Industry Revenue Million Forecast, by Service 2019 & 2032
- Table 72: Global Formulation Development Outsourcing Industry Revenue Million Forecast, by Dosage Form 2019 & 2032
- Table 73: Global Formulation Development Outsourcing Industry Revenue Million Forecast, by Application 2019 & 2032
- Table 74: Global Formulation Development Outsourcing Industry Revenue Million Forecast, by End User 2019 & 2032
- Table 75: Global Formulation Development Outsourcing Industry Revenue Million Forecast, by Country 2019 & 2032
- Table 76: Brazil Formulation Development Outsourcing Industry Revenue (Million) Forecast, by Application 2019 & 2032
- Table 77: Argentina Formulation Development Outsourcing Industry Revenue (Million) Forecast, by Application 2019 & 2032
- Table 78: Rest of South America Formulation Development Outsourcing Industry Revenue (Million) Forecast, by Application 2019 & 2032
Frequently Asked Questions
1. What is the projected Compound Annual Growth Rate (CAGR) of the Formulation Development Outsourcing Industry?
The projected CAGR is approximately 6.16%.
2. Which companies are prominent players in the Formulation Development Outsourcing Industry?
Key companies in the market include Charles River Laboratories, Intertek Group PLC, Laboratory Corporation of America Holdings, Patheon (Thermo Fisher Scientific Inc ), Dr Reddy's Laboratories Ltd, Irisys LLC, Aizant Drug Research Solutions Private Limited, Syngene International Ltd, Lonza Group AG, Piramal Pharma Solutions, Qiotient Sciences, Catalent Inc, Emergent BioSolutions Inc.
3. What are the main segments of the Formulation Development Outsourcing Industry?
The market segments include Service, Dosage Form, Application, End User.
4. Can you provide details about the market size?
The market size is estimated to be USD 26.56 Million as of 2022.
5. What are some drivers contributing to market growth?
Increasing Trend of Patent Protection Expiration of Major Drugs; Rising Number of Pharmaceutical and Biopharmaceutical Companies Outsourcing Their Services.
6. What are the notable trends driving market growth?
The Oncology Segment is Expected to Witness Significant Growth over the Forecast Period.
7. Are there any restraints impacting market growth?
Structural Changes in the Pharmaceutical Industry; Insufficient Funding to Perform the Drug Development Process Through Formulation Development.
8. Can you provide examples of recent developments in the market?
N/A
9. What pricing options are available for accessing the report?
Pricing options include single-user, multi-user, and enterprise licenses priced at USD 4750, USD 5250, and USD 8750 respectively.
10. Is the market size provided in terms of value or volume?
The market size is provided in terms of value, measured in Million.
11. Are there any specific market keywords associated with the report?
Yes, the market keyword associated with the report is "Formulation Development Outsourcing Industry," which aids in identifying and referencing the specific market segment covered.
12. How do I determine which pricing option suits my needs best?
The pricing options vary based on user requirements and access needs. Individual users may opt for single-user licenses, while businesses requiring broader access may choose multi-user or enterprise licenses for cost-effective access to the report.
13. Are there any additional resources or data provided in the Formulation Development Outsourcing Industry report?
While the report offers comprehensive insights, it's advisable to review the specific contents or supplementary materials provided to ascertain if additional resources or data are available.
14. How can I stay updated on further developments or reports in the Formulation Development Outsourcing Industry?
To stay informed about further developments, trends, and reports in the Formulation Development Outsourcing Industry, consider subscribing to industry newsletters, following relevant companies and organizations, or regularly checking reputable industry news sources and publications.
Methodology
Step 1 - Identification of Relevant Samples Size from Population Database


Step 2 - Approaches for Defining Global Market Size (Value, Volume* & Price*)

Note*: In applicable scenarios
Step 3 - Data Sources
Primary Research
- Web Analytics
- Survey Reports
- Research Institute
- Latest Research Reports
- Opinion Leaders
Secondary Research
- Annual Reports
- White Paper
- Latest Press Release
- Industry Association
- Paid Database
- Investor Presentations

Step 4 - Data Triangulation
Involves using different sources of information in order to increase the validity of a study
These sources are likely to be stakeholders in a program - participants, other researchers, program staff, other community members, and so on.
Then we put all data in single framework & apply various statistical tools to find out the dynamic on the market.
During the analysis stage, feedback from the stakeholder groups would be compared to determine areas of agreement as well as areas of divergence
