

Key Insights
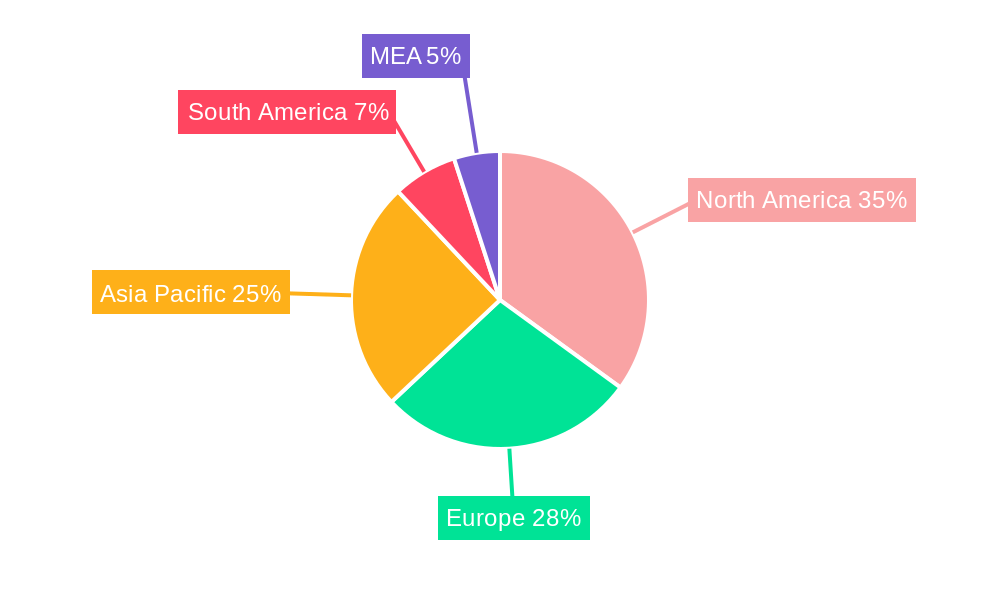
The Polyetherimide (PEI) market, valued at $663.10 million in 2025, is projected to experience robust growth, exhibiting a Compound Annual Growth Rate (CAGR) exceeding 6.50% from 2025 to 2033. This expansion is driven by the increasing demand for high-performance polymers across diverse sectors. The transportation industry, fueled by the need for lightweight yet durable components in automobiles and aerospace applications, is a significant contributor to market growth. Similarly, the burgeoning electronics and electrical sectors are leveraging PEI's exceptional thermal and electrical insulation properties in advanced circuitry and components. Consumer goods manufacturers are also incorporating PEI for its strength and chemical resistance, leading to its utilization in high-end appliances and durable goods. Growth in the healthcare and industrial appliance sectors further bolsters the market. Reinforced PEI grades currently dominate the market due to their superior mechanical strength, but the demand for unreinforced grades is anticipated to rise steadily due to their enhanced processability. Geographic growth is expected to be largely distributed, with North America and Asia Pacific representing key regions, driven by robust industrial activity and substantial investments in advanced manufacturing. However, factors like high production costs and the availability of alternative materials might slightly restrain market growth. Companies like Solvay, SABIC, and Mitsubishi Chemical Group are key players, constantly innovating to cater to the evolving needs of diverse end-use industries.
The forecast period (2025-2033) suggests a continuous expansion of the PEI market, primarily influenced by technological advancements leading to improved material properties and expanded applications. Government regulations promoting the use of sustainable and high-performance materials in various industries are also expected to stimulate demand. The competitive landscape is marked by both established players and emerging manufacturers, leading to increased innovation and price competitiveness. Further segmentation by application within each end-user industry will reveal more granular growth patterns. Market analysis suggests that continued focus on research and development, coupled with strategic partnerships and expansions into emerging markets, will be crucial for players to maintain a competitive edge and capitalize on the significant growth opportunities available in the PEI market.

Unlock Growth Opportunities in the Booming Polyetherimide Market: A Comprehensive 2019-2033 Report
This comprehensive report provides an in-depth analysis of the Polyetherimide (PEI) market, offering invaluable insights for stakeholders seeking to navigate this dynamic landscape. Covering the period from 2019 to 2033, with a focus on 2025, this research delves into market dynamics, key segments, leading players, and future growth prospects. The report leverages extensive data analysis to present actionable intelligence, helping businesses make informed strategic decisions.
Polyetherimide Market Concentration & Dynamics
The Polyetherimide market exhibits a moderately concentrated landscape, with key players such as Solvay, GEHR, Röchling SE & Co KG, Avient Corporation, and SABIC holding significant market share. However, the presence of several smaller, specialized players ensures a degree of competition. The market is characterized by a moderate level of innovation, with ongoing research and development efforts focused on improving material properties and expanding application areas. Regulatory frameworks related to material safety and environmental impact play a significant role, influencing product development and market entry strategies. Substitute materials, such as polyimides and high-performance thermoplastics, pose a competitive threat, particularly in price-sensitive segments. End-user trends towards lightweighting, improved thermal stability, and enhanced electrical properties are driving demand for PEI. M&A activity in the PEI market has been relatively modest in recent years, with an estimated xx M&A deals concluded between 2019 and 2024, resulting in a xx% change in market share among the top 5 players.
- Market Concentration: Moderately concentrated.
- Innovation Ecosystem: Moderate level of R&D activity.
- Regulatory Framework: Significant impact on product development.
- Substitute Products: Polyimides, high-performance thermoplastics.
- End-User Trends: Lightweighting, improved thermal and electrical properties.
- M&A Activity: xx M&A deals (2019-2024), xx% change in top 5 market share.
Polyetherimide Market Industry Insights & Trends
The global Polyetherimide market is experiencing robust growth, driven by increasing demand across diverse end-use industries. The market size reached an estimated $xx Million in 2025, exhibiting a CAGR of xx% during the historical period (2019-2024). This growth is fueled by factors such as the rising adoption of PEI in high-performance applications, technological advancements leading to improved material properties, and the expanding use of PEI in electronics, automotive, and aerospace sectors. Consumer preferences for durable, high-performance products are further boosting market expansion. Technological disruptions, such as the development of novel manufacturing processes and the integration of advanced materials, are expected to reshape the competitive landscape in the coming years. The market is projected to reach $xx Million by 2033, maintaining a healthy growth trajectory.

Key Markets & Segments Leading Polyetherimide Market
The reinforced grade of PEI dominates the market, accounting for approximately xx% of the total volume. This is primarily attributed to its superior mechanical strength and dimensional stability. The transportation sector is a major end-user, driven by the increasing demand for lightweight and high-performance components in automobiles and aerospace applications. The Electrical and Electronics sector also shows significant growth due to the use of PEI in high-temperature applications and demanding environments.
- Dominant Region: Asia-Pacific (due to growing automotive and electronics manufacturing)
- Dominant Grade: Reinforced
- Dominant End-User Industry: Transportation and Electrical & Electronics.
Drivers for Transportation Segment:
- Growing automotive production
- Increasing demand for lightweight vehicles
- Stringent emission regulations
Drivers for Electrical & Electronics Segment:
- Miniaturization of electronic devices
- Demand for high-performance components
- Need for improved thermal management
Polyetherimide Market Product Developments
Recent product developments in the PEI market focus on enhancing thermal stability, improving flame retardancy, and expanding the range of available colors and formulations. These advancements cater to the evolving needs of various end-user industries, offering greater design flexibility and enhanced product performance. Manufacturers are also exploring new processing techniques to improve efficiency and reduce costs, strengthening their competitive edge. The development of high-flow PEI grades is enabling the production of complex parts with intricate geometries.
Challenges in the Polyetherimide Market
The Polyetherimide market faces challenges such as high raw material costs, supply chain disruptions, and intense competition from substitute materials. Regulatory hurdles related to material safety and environmental compliance further add to the complexities. These factors can impact profitability and limit market expansion. The estimated impact on market growth is xx% for the forecast period.
Forces Driving Polyetherimide Market Growth
Key growth drivers include technological advancements in materials science, leading to improved PEI properties; increasing demand from high-growth end-use sectors such as electric vehicles and 5G infrastructure; and supportive government policies promoting sustainable and lightweight materials in various industries. The rising adoption of PEI in medical devices and aerospace applications also contributes to market growth.
Long-Term Growth Catalysts in the Polyetherimide Market
Long-term growth is fueled by continuous innovation in PEI formulations, strategic partnerships between material suppliers and end-users to develop customized solutions, and expansion into new and emerging markets, particularly in developing economies with expanding industrial sectors.
Emerging Opportunities in Polyetherimide Market
Emerging opportunities exist in developing specialized PEI grades for niche applications, leveraging additive manufacturing techniques to produce complex geometries, and catering to the growing demand for sustainable and recyclable materials. New market opportunities are arising in advanced packaging, energy storage, and medical implants.
Leading Players in the Polyetherimide Market Sector
- Solvay
- GEHR
- Röchling SE & Co KG
- Avient Corporation
- Emco Industrial Plastics
- SABIC
- The Mitsubishi Chemical Group of companies
- RTP Company
- Kuraray Europe GmbH
- Aikolon Oy
- Ensinger
- Eagle Performance Plastics Inc
Key Milestones in Polyetherimide Market Industry
- 2020: Solvay launched a new high-performance PEI grade with improved thermal stability.
- 2022: Avient Corporation acquired a smaller PEI producer, expanding its market share.
- 2023: Significant investments in R&D for bio-based PEI alternatives were announced by multiple companies.
- 2024: Several key players announced partnerships to develop new PEI applications in aerospace.
Strategic Outlook for Polyetherimide Market
The Polyetherimide market presents significant growth potential driven by ongoing technological advancements, increasing demand from diverse end-user industries, and the emergence of new applications. Strategic partnerships, focused R&D efforts, and expansion into high-growth markets will be crucial for players seeking to capitalize on future opportunities and strengthen their market positions. The market is poised for continued expansion, offering attractive prospects for investors and businesses alike.
Polyetherimide Market Segmentation
-
1. Grade
- 1.1. Reinforced
- 1.2. Unreinforced
-
2. End-User Industry
- 2.1. Transportation
- 2.2. Electrical and Electronics
- 2.3. Consumer Goods
- 2.4. Healthcare
- 2.5. Household and Industrial Appliances
- 2.6. Others
Polyetherimide Market Segmentation By Geography
-
1. Asia Pacific
- 1.1. China
- 1.2. India
- 1.3. Japan
- 1.4. South Korea
- 1.5. Southeast ASia
- 1.6. Australia
- 1.7. Rest of Asia Pacific
-
2. North America
- 2.1. United States
- 2.2. Canada
- 2.3. Mexico
-
3. Europe
- 3.1. Germany
- 3.2. United Kingdom
- 3.3. Italy
- 3.4. France
- 3.5. Spain
- 3.6. Rest of Europe
-
4. South America
- 4.1. Brazil
- 4.2. Argentina
- 4.3. Colombia
- 4.4. Rest of South America
-
5. Middle East and Africa
- 5.1. Saudi Arabia
- 5.2. South Africa
- 5.3. UAE
- 5.4. Rest of Middle East and Africa
Polyetherimide Market REPORT HIGHLIGHTS
| Aspects | Details |
|---|---|
| Study Period | 2019-2033 |
| Base Year | 2024 |
| Estimated Year | 2025 |
| Forecast Period | 2025-2033 |
| Historical Period | 2019-2024 |
| Growth Rate | CAGR of > 6.50% from 2019-2033 |
| Segmentation |
|
Table of Contents
- 1. Introduction
- 1.1. Research Scope
- 1.2. Market Segmentation
- 1.3. Research Methodology
- 1.4. Definitions and Assumptions
- 2. Executive Summary
- 2.1. Introduction
- 3. Market Dynamics
- 3.1. Introduction
- 3.2. Market Drivers
- 3.2.1. Increasing Demand from the Transportation Industry; Rapid Growth in the Automotive Sector; Increasing Usage in Healthcare Sector
- 3.3. Market Restrains
- 3.3.1. High Price When Compared to the Conventional Polymers; Availability of Substitute Materials
- 3.4. Market Trends
- 3.4.1. Increasing demand from Electrical & Electronics Industry
- 4. Market Factor Analysis
- 4.1. Porters Five Forces
- 4.2. Supply/Value Chain
- 4.3. PESTEL analysis
- 4.4. Market Entropy
- 4.5. Patent/Trademark Analysis
- 5. Global Polyetherimide Market Analysis, Insights and Forecast, 2019-2031
- 5.1. Market Analysis, Insights and Forecast - by Grade
- 5.1.1. Reinforced
- 5.1.2. Unreinforced
- 5.2. Market Analysis, Insights and Forecast - by End-User Industry
- 5.2.1. Transportation
- 5.2.2. Electrical and Electronics
- 5.2.3. Consumer Goods
- 5.2.4. Healthcare
- 5.2.5. Household and Industrial Appliances
- 5.2.6. Others
- 5.3. Market Analysis, Insights and Forecast - by Region
- 5.3.1. Asia Pacific
- 5.3.2. North America
- 5.3.3. Europe
- 5.3.4. South America
- 5.3.5. Middle East and Africa
- 5.1. Market Analysis, Insights and Forecast - by Grade
- 6. Asia Pacific Polyetherimide Market Analysis, Insights and Forecast, 2019-2031
- 6.1. Market Analysis, Insights and Forecast - by Grade
- 6.1.1. Reinforced
- 6.1.2. Unreinforced
- 6.2. Market Analysis, Insights and Forecast - by End-User Industry
- 6.2.1. Transportation
- 6.2.2. Electrical and Electronics
- 6.2.3. Consumer Goods
- 6.2.4. Healthcare
- 6.2.5. Household and Industrial Appliances
- 6.2.6. Others
- 6.1. Market Analysis, Insights and Forecast - by Grade
- 7. North America Polyetherimide Market Analysis, Insights and Forecast, 2019-2031
- 7.1. Market Analysis, Insights and Forecast - by Grade
- 7.1.1. Reinforced
- 7.1.2. Unreinforced
- 7.2. Market Analysis, Insights and Forecast - by End-User Industry
- 7.2.1. Transportation
- 7.2.2. Electrical and Electronics
- 7.2.3. Consumer Goods
- 7.2.4. Healthcare
- 7.2.5. Household and Industrial Appliances
- 7.2.6. Others
- 7.1. Market Analysis, Insights and Forecast - by Grade
- 8. Europe Polyetherimide Market Analysis, Insights and Forecast, 2019-2031
- 8.1. Market Analysis, Insights and Forecast - by Grade
- 8.1.1. Reinforced
- 8.1.2. Unreinforced
- 8.2. Market Analysis, Insights and Forecast - by End-User Industry
- 8.2.1. Transportation
- 8.2.2. Electrical and Electronics
- 8.2.3. Consumer Goods
- 8.2.4. Healthcare
- 8.2.5. Household and Industrial Appliances
- 8.2.6. Others
- 8.1. Market Analysis, Insights and Forecast - by Grade
- 9. South America Polyetherimide Market Analysis, Insights and Forecast, 2019-2031
- 9.1. Market Analysis, Insights and Forecast - by Grade
- 9.1.1. Reinforced
- 9.1.2. Unreinforced
- 9.2. Market Analysis, Insights and Forecast - by End-User Industry
- 9.2.1. Transportation
- 9.2.2. Electrical and Electronics
- 9.2.3. Consumer Goods
- 9.2.4. Healthcare
- 9.2.5. Household and Industrial Appliances
- 9.2.6. Others
- 9.1. Market Analysis, Insights and Forecast - by Grade
- 10. Middle East and Africa Polyetherimide Market Analysis, Insights and Forecast, 2019-2031
- 10.1. Market Analysis, Insights and Forecast - by Grade
- 10.1.1. Reinforced
- 10.1.2. Unreinforced
- 10.2. Market Analysis, Insights and Forecast - by End-User Industry
- 10.2.1. Transportation
- 10.2.2. Electrical and Electronics
- 10.2.3. Consumer Goods
- 10.2.4. Healthcare
- 10.2.5. Household and Industrial Appliances
- 10.2.6. Others
- 10.1. Market Analysis, Insights and Forecast - by Grade
- 11. North America Polyetherimide Market Analysis, Insights and Forecast, 2019-2031
- 11.1. Market Analysis, Insights and Forecast - By Country/Sub-region
- 11.1.1 United States
- 11.1.2 Canada
- 11.1.3 Mexico
- 12. Europe Polyetherimide Market Analysis, Insights and Forecast, 2019-2031
- 12.1. Market Analysis, Insights and Forecast - By Country/Sub-region
- 12.1.1 Germany
- 12.1.2 United Kingdom
- 12.1.3 France
- 12.1.4 Spain
- 12.1.5 Italy
- 12.1.6 Spain
- 12.1.7 Belgium
- 12.1.8 Netherland
- 12.1.9 Nordics
- 12.1.10 Rest of Europe
- 13. Asia Pacific Polyetherimide Market Analysis, Insights and Forecast, 2019-2031
- 13.1. Market Analysis, Insights and Forecast - By Country/Sub-region
- 13.1.1 China
- 13.1.2 Japan
- 13.1.3 India
- 13.1.4 South Korea
- 13.1.5 Southeast Asia
- 13.1.6 Australia
- 13.1.7 Indonesia
- 13.1.8 Phillipes
- 13.1.9 Singapore
- 13.1.10 Thailandc
- 13.1.11 Rest of Asia Pacific
- 14. South America Polyetherimide Market Analysis, Insights and Forecast, 2019-2031
- 14.1. Market Analysis, Insights and Forecast - By Country/Sub-region
- 14.1.1 Brazil
- 14.1.2 Argentina
- 14.1.3 Peru
- 14.1.4 Chile
- 14.1.5 Colombia
- 14.1.6 Ecuador
- 14.1.7 Venezuela
- 14.1.8 Rest of South America
- 15. North America Polyetherimide Market Analysis, Insights and Forecast, 2019-2031
- 15.1. Market Analysis, Insights and Forecast - By Country/Sub-region
- 15.1.1 United States
- 15.1.2 Canada
- 15.1.3 Mexico
- 16. MEA Polyetherimide Market Analysis, Insights and Forecast, 2019-2031
- 16.1. Market Analysis, Insights and Forecast - By Country/Sub-region
- 16.1.1 United Arab Emirates
- 16.1.2 Saudi Arabia
- 16.1.3 South Africa
- 16.1.4 Rest of Middle East and Africa
- 17. Competitive Analysis
- 17.1. Global Market Share Analysis 2024
- 17.2. Company Profiles
- 17.2.1 Solvay
- 17.2.1.1. Overview
- 17.2.1.2. Products
- 17.2.1.3. SWOT Analysis
- 17.2.1.4. Recent Developments
- 17.2.1.5. Financials (Based on Availability)
- 17.2.2 GEHR
- 17.2.2.1. Overview
- 17.2.2.2. Products
- 17.2.2.3. SWOT Analysis
- 17.2.2.4. Recent Developments
- 17.2.2.5. Financials (Based on Availability)
- 17.2.3 Röchling SE & Co KG
- 17.2.3.1. Overview
- 17.2.3.2. Products
- 17.2.3.3. SWOT Analysis
- 17.2.3.4. Recent Developments
- 17.2.3.5. Financials (Based on Availability)
- 17.2.4 Avient Corporation
- 17.2.4.1. Overview
- 17.2.4.2. Products
- 17.2.4.3. SWOT Analysis
- 17.2.4.4. Recent Developments
- 17.2.4.5. Financials (Based on Availability)
- 17.2.5 Emco Industrial Plastics
- 17.2.5.1. Overview
- 17.2.5.2. Products
- 17.2.5.3. SWOT Analysis
- 17.2.5.4. Recent Developments
- 17.2.5.5. Financials (Based on Availability)
- 17.2.6 SABIC
- 17.2.6.1. Overview
- 17.2.6.2. Products
- 17.2.6.3. SWOT Analysis
- 17.2.6.4. Recent Developments
- 17.2.6.5. Financials (Based on Availability)
- 17.2.7 the Mitsubishi Chemical Group of companies
- 17.2.7.1. Overview
- 17.2.7.2. Products
- 17.2.7.3. SWOT Analysis
- 17.2.7.4. Recent Developments
- 17.2.7.5. Financials (Based on Availability)
- 17.2.8 RTP Company
- 17.2.8.1. Overview
- 17.2.8.2. Products
- 17.2.8.3. SWOT Analysis
- 17.2.8.4. Recent Developments
- 17.2.8.5. Financials (Based on Availability)
- 17.2.9 Kuraray Europe GmbH
- 17.2.9.1. Overview
- 17.2.9.2. Products
- 17.2.9.3. SWOT Analysis
- 17.2.9.4. Recent Developments
- 17.2.9.5. Financials (Based on Availability)
- 17.2.10 Aikolon Oy
- 17.2.10.1. Overview
- 17.2.10.2. Products
- 17.2.10.3. SWOT Analysis
- 17.2.10.4. Recent Developments
- 17.2.10.5. Financials (Based on Availability)
- 17.2.11 Ensinger
- 17.2.11.1. Overview
- 17.2.11.2. Products
- 17.2.11.3. SWOT Analysis
- 17.2.11.4. Recent Developments
- 17.2.11.5. Financials (Based on Availability)
- 17.2.12 Eagle Performance Plastics Inc
- 17.2.12.1. Overview
- 17.2.12.2. Products
- 17.2.12.3. SWOT Analysis
- 17.2.12.4. Recent Developments
- 17.2.12.5. Financials (Based on Availability)
- 17.2.1 Solvay
List of Figures
- Figure 1: Global Polyetherimide Market Revenue Breakdown (Million, %) by Region 2024 & 2032
- Figure 2: Global Polyetherimide Market Volume Breakdown (K Tons, %) by Region 2024 & 2032
- Figure 3: North America Polyetherimide Market Revenue (Million), by Country 2024 & 2032
- Figure 4: North America Polyetherimide Market Volume (K Tons), by Country 2024 & 2032
- Figure 5: North America Polyetherimide Market Revenue Share (%), by Country 2024 & 2032
- Figure 6: North America Polyetherimide Market Volume Share (%), by Country 2024 & 2032
- Figure 7: Europe Polyetherimide Market Revenue (Million), by Country 2024 & 2032
- Figure 8: Europe Polyetherimide Market Volume (K Tons), by Country 2024 & 2032
- Figure 9: Europe Polyetherimide Market Revenue Share (%), by Country 2024 & 2032
- Figure 10: Europe Polyetherimide Market Volume Share (%), by Country 2024 & 2032
- Figure 11: Asia Pacific Polyetherimide Market Revenue (Million), by Country 2024 & 2032
- Figure 12: Asia Pacific Polyetherimide Market Volume (K Tons), by Country 2024 & 2032
- Figure 13: Asia Pacific Polyetherimide Market Revenue Share (%), by Country 2024 & 2032
- Figure 14: Asia Pacific Polyetherimide Market Volume Share (%), by Country 2024 & 2032
- Figure 15: South America Polyetherimide Market Revenue (Million), by Country 2024 & 2032
- Figure 16: South America Polyetherimide Market Volume (K Tons), by Country 2024 & 2032
- Figure 17: South America Polyetherimide Market Revenue Share (%), by Country 2024 & 2032
- Figure 18: South America Polyetherimide Market Volume Share (%), by Country 2024 & 2032
- Figure 19: North America Polyetherimide Market Revenue (Million), by Country 2024 & 2032
- Figure 20: North America Polyetherimide Market Volume (K Tons), by Country 2024 & 2032
- Figure 21: North America Polyetherimide Market Revenue Share (%), by Country 2024 & 2032
- Figure 22: North America Polyetherimide Market Volume Share (%), by Country 2024 & 2032
- Figure 23: MEA Polyetherimide Market Revenue (Million), by Country 2024 & 2032
- Figure 24: MEA Polyetherimide Market Volume (K Tons), by Country 2024 & 2032
- Figure 25: MEA Polyetherimide Market Revenue Share (%), by Country 2024 & 2032
- Figure 26: MEA Polyetherimide Market Volume Share (%), by Country 2024 & 2032
- Figure 27: Asia Pacific Polyetherimide Market Revenue (Million), by Grade 2024 & 2032
- Figure 28: Asia Pacific Polyetherimide Market Volume (K Tons), by Grade 2024 & 2032
- Figure 29: Asia Pacific Polyetherimide Market Revenue Share (%), by Grade 2024 & 2032
- Figure 30: Asia Pacific Polyetherimide Market Volume Share (%), by Grade 2024 & 2032
- Figure 31: Asia Pacific Polyetherimide Market Revenue (Million), by End-User Industry 2024 & 2032
- Figure 32: Asia Pacific Polyetherimide Market Volume (K Tons), by End-User Industry 2024 & 2032
- Figure 33: Asia Pacific Polyetherimide Market Revenue Share (%), by End-User Industry 2024 & 2032
- Figure 34: Asia Pacific Polyetherimide Market Volume Share (%), by End-User Industry 2024 & 2032
- Figure 35: Asia Pacific Polyetherimide Market Revenue (Million), by Country 2024 & 2032
- Figure 36: Asia Pacific Polyetherimide Market Volume (K Tons), by Country 2024 & 2032
- Figure 37: Asia Pacific Polyetherimide Market Revenue Share (%), by Country 2024 & 2032
- Figure 38: Asia Pacific Polyetherimide Market Volume Share (%), by Country 2024 & 2032
- Figure 39: North America Polyetherimide Market Revenue (Million), by Grade 2024 & 2032
- Figure 40: North America Polyetherimide Market Volume (K Tons), by Grade 2024 & 2032
- Figure 41: North America Polyetherimide Market Revenue Share (%), by Grade 2024 & 2032
- Figure 42: North America Polyetherimide Market Volume Share (%), by Grade 2024 & 2032
- Figure 43: North America Polyetherimide Market Revenue (Million), by End-User Industry 2024 & 2032
- Figure 44: North America Polyetherimide Market Volume (K Tons), by End-User Industry 2024 & 2032
- Figure 45: North America Polyetherimide Market Revenue Share (%), by End-User Industry 2024 & 2032
- Figure 46: North America Polyetherimide Market Volume Share (%), by End-User Industry 2024 & 2032
- Figure 47: North America Polyetherimide Market Revenue (Million), by Country 2024 & 2032
- Figure 48: North America Polyetherimide Market Volume (K Tons), by Country 2024 & 2032
- Figure 49: North America Polyetherimide Market Revenue Share (%), by Country 2024 & 2032
- Figure 50: North America Polyetherimide Market Volume Share (%), by Country 2024 & 2032
- Figure 51: Europe Polyetherimide Market Revenue (Million), by Grade 2024 & 2032
- Figure 52: Europe Polyetherimide Market Volume (K Tons), by Grade 2024 & 2032
- Figure 53: Europe Polyetherimide Market Revenue Share (%), by Grade 2024 & 2032
- Figure 54: Europe Polyetherimide Market Volume Share (%), by Grade 2024 & 2032
- Figure 55: Europe Polyetherimide Market Revenue (Million), by End-User Industry 2024 & 2032
- Figure 56: Europe Polyetherimide Market Volume (K Tons), by End-User Industry 2024 & 2032
- Figure 57: Europe Polyetherimide Market Revenue Share (%), by End-User Industry 2024 & 2032
- Figure 58: Europe Polyetherimide Market Volume Share (%), by End-User Industry 2024 & 2032
- Figure 59: Europe Polyetherimide Market Revenue (Million), by Country 2024 & 2032
- Figure 60: Europe Polyetherimide Market Volume (K Tons), by Country 2024 & 2032
- Figure 61: Europe Polyetherimide Market Revenue Share (%), by Country 2024 & 2032
- Figure 62: Europe Polyetherimide Market Volume Share (%), by Country 2024 & 2032
- Figure 63: South America Polyetherimide Market Revenue (Million), by Grade 2024 & 2032
- Figure 64: South America Polyetherimide Market Volume (K Tons), by Grade 2024 & 2032
- Figure 65: South America Polyetherimide Market Revenue Share (%), by Grade 2024 & 2032
- Figure 66: South America Polyetherimide Market Volume Share (%), by Grade 2024 & 2032
- Figure 67: South America Polyetherimide Market Revenue (Million), by End-User Industry 2024 & 2032
- Figure 68: South America Polyetherimide Market Volume (K Tons), by End-User Industry 2024 & 2032
- Figure 69: South America Polyetherimide Market Revenue Share (%), by End-User Industry 2024 & 2032
- Figure 70: South America Polyetherimide Market Volume Share (%), by End-User Industry 2024 & 2032
- Figure 71: South America Polyetherimide Market Revenue (Million), by Country 2024 & 2032
- Figure 72: South America Polyetherimide Market Volume (K Tons), by Country 2024 & 2032
- Figure 73: South America Polyetherimide Market Revenue Share (%), by Country 2024 & 2032
- Figure 74: South America Polyetherimide Market Volume Share (%), by Country 2024 & 2032
- Figure 75: Middle East and Africa Polyetherimide Market Revenue (Million), by Grade 2024 & 2032
- Figure 76: Middle East and Africa Polyetherimide Market Volume (K Tons), by Grade 2024 & 2032
- Figure 77: Middle East and Africa Polyetherimide Market Revenue Share (%), by Grade 2024 & 2032
- Figure 78: Middle East and Africa Polyetherimide Market Volume Share (%), by Grade 2024 & 2032
- Figure 79: Middle East and Africa Polyetherimide Market Revenue (Million), by End-User Industry 2024 & 2032
- Figure 80: Middle East and Africa Polyetherimide Market Volume (K Tons), by End-User Industry 2024 & 2032
- Figure 81: Middle East and Africa Polyetherimide Market Revenue Share (%), by End-User Industry 2024 & 2032
- Figure 82: Middle East and Africa Polyetherimide Market Volume Share (%), by End-User Industry 2024 & 2032
- Figure 83: Middle East and Africa Polyetherimide Market Revenue (Million), by Country 2024 & 2032
- Figure 84: Middle East and Africa Polyetherimide Market Volume (K Tons), by Country 2024 & 2032
- Figure 85: Middle East and Africa Polyetherimide Market Revenue Share (%), by Country 2024 & 2032
- Figure 86: Middle East and Africa Polyetherimide Market Volume Share (%), by Country 2024 & 2032
List of Tables
- Table 1: Global Polyetherimide Market Revenue Million Forecast, by Region 2019 & 2032
- Table 2: Global Polyetherimide Market Volume K Tons Forecast, by Region 2019 & 2032
- Table 3: Global Polyetherimide Market Revenue Million Forecast, by Grade 2019 & 2032
- Table 4: Global Polyetherimide Market Volume K Tons Forecast, by Grade 2019 & 2032
- Table 5: Global Polyetherimide Market Revenue Million Forecast, by End-User Industry 2019 & 2032
- Table 6: Global Polyetherimide Market Volume K Tons Forecast, by End-User Industry 2019 & 2032
- Table 7: Global Polyetherimide Market Revenue Million Forecast, by Region 2019 & 2032
- Table 8: Global Polyetherimide Market Volume K Tons Forecast, by Region 2019 & 2032
- Table 9: Global Polyetherimide Market Revenue Million Forecast, by Country 2019 & 2032
- Table 10: Global Polyetherimide Market Volume K Tons Forecast, by Country 2019 & 2032
- Table 11: United States Polyetherimide Market Revenue (Million) Forecast, by Application 2019 & 2032
- Table 12: United States Polyetherimide Market Volume (K Tons) Forecast, by Application 2019 & 2032
- Table 13: Canada Polyetherimide Market Revenue (Million) Forecast, by Application 2019 & 2032
- Table 14: Canada Polyetherimide Market Volume (K Tons) Forecast, by Application 2019 & 2032
- Table 15: Mexico Polyetherimide Market Revenue (Million) Forecast, by Application 2019 & 2032
- Table 16: Mexico Polyetherimide Market Volume (K Tons) Forecast, by Application 2019 & 2032
- Table 17: Global Polyetherimide Market Revenue Million Forecast, by Country 2019 & 2032
- Table 18: Global Polyetherimide Market Volume K Tons Forecast, by Country 2019 & 2032
- Table 19: Germany Polyetherimide Market Revenue (Million) Forecast, by Application 2019 & 2032
- Table 20: Germany Polyetherimide Market Volume (K Tons) Forecast, by Application 2019 & 2032
- Table 21: United Kingdom Polyetherimide Market Revenue (Million) Forecast, by Application 2019 & 2032
- Table 22: United Kingdom Polyetherimide Market Volume (K Tons) Forecast, by Application 2019 & 2032
- Table 23: France Polyetherimide Market Revenue (Million) Forecast, by Application 2019 & 2032
- Table 24: France Polyetherimide Market Volume (K Tons) Forecast, by Application 2019 & 2032
- Table 25: Spain Polyetherimide Market Revenue (Million) Forecast, by Application 2019 & 2032
- Table 26: Spain Polyetherimide Market Volume (K Tons) Forecast, by Application 2019 & 2032
- Table 27: Italy Polyetherimide Market Revenue (Million) Forecast, by Application 2019 & 2032
- Table 28: Italy Polyetherimide Market Volume (K Tons) Forecast, by Application 2019 & 2032
- Table 29: Spain Polyetherimide Market Revenue (Million) Forecast, by Application 2019 & 2032
- Table 30: Spain Polyetherimide Market Volume (K Tons) Forecast, by Application 2019 & 2032
- Table 31: Belgium Polyetherimide Market Revenue (Million) Forecast, by Application 2019 & 2032
- Table 32: Belgium Polyetherimide Market Volume (K Tons) Forecast, by Application 2019 & 2032
- Table 33: Netherland Polyetherimide Market Revenue (Million) Forecast, by Application 2019 & 2032
- Table 34: Netherland Polyetherimide Market Volume (K Tons) Forecast, by Application 2019 & 2032
- Table 35: Nordics Polyetherimide Market Revenue (Million) Forecast, by Application 2019 & 2032
- Table 36: Nordics Polyetherimide Market Volume (K Tons) Forecast, by Application 2019 & 2032
- Table 37: Rest of Europe Polyetherimide Market Revenue (Million) Forecast, by Application 2019 & 2032
- Table 38: Rest of Europe Polyetherimide Market Volume (K Tons) Forecast, by Application 2019 & 2032
- Table 39: Global Polyetherimide Market Revenue Million Forecast, by Country 2019 & 2032
- Table 40: Global Polyetherimide Market Volume K Tons Forecast, by Country 2019 & 2032
- Table 41: China Polyetherimide Market Revenue (Million) Forecast, by Application 2019 & 2032
- Table 42: China Polyetherimide Market Volume (K Tons) Forecast, by Application 2019 & 2032
- Table 43: Japan Polyetherimide Market Revenue (Million) Forecast, by Application 2019 & 2032
- Table 44: Japan Polyetherimide Market Volume (K Tons) Forecast, by Application 2019 & 2032
- Table 45: India Polyetherimide Market Revenue (Million) Forecast, by Application 2019 & 2032
- Table 46: India Polyetherimide Market Volume (K Tons) Forecast, by Application 2019 & 2032
- Table 47: South Korea Polyetherimide Market Revenue (Million) Forecast, by Application 2019 & 2032
- Table 48: South Korea Polyetherimide Market Volume (K Tons) Forecast, by Application 2019 & 2032
- Table 49: Southeast Asia Polyetherimide Market Revenue (Million) Forecast, by Application 2019 & 2032
- Table 50: Southeast Asia Polyetherimide Market Volume (K Tons) Forecast, by Application 2019 & 2032
- Table 51: Australia Polyetherimide Market Revenue (Million) Forecast, by Application 2019 & 2032
- Table 52: Australia Polyetherimide Market Volume (K Tons) Forecast, by Application 2019 & 2032
- Table 53: Indonesia Polyetherimide Market Revenue (Million) Forecast, by Application 2019 & 2032
- Table 54: Indonesia Polyetherimide Market Volume (K Tons) Forecast, by Application 2019 & 2032
- Table 55: Phillipes Polyetherimide Market Revenue (Million) Forecast, by Application 2019 & 2032
- Table 56: Phillipes Polyetherimide Market Volume (K Tons) Forecast, by Application 2019 & 2032
- Table 57: Singapore Polyetherimide Market Revenue (Million) Forecast, by Application 2019 & 2032
- Table 58: Singapore Polyetherimide Market Volume (K Tons) Forecast, by Application 2019 & 2032
- Table 59: Thailandc Polyetherimide Market Revenue (Million) Forecast, by Application 2019 & 2032
- Table 60: Thailandc Polyetherimide Market Volume (K Tons) Forecast, by Application 2019 & 2032
- Table 61: Rest of Asia Pacific Polyetherimide Market Revenue (Million) Forecast, by Application 2019 & 2032
- Table 62: Rest of Asia Pacific Polyetherimide Market Volume (K Tons) Forecast, by Application 2019 & 2032
- Table 63: Global Polyetherimide Market Revenue Million Forecast, by Country 2019 & 2032
- Table 64: Global Polyetherimide Market Volume K Tons Forecast, by Country 2019 & 2032
- Table 65: Brazil Polyetherimide Market Revenue (Million) Forecast, by Application 2019 & 2032
- Table 66: Brazil Polyetherimide Market Volume (K Tons) Forecast, by Application 2019 & 2032
- Table 67: Argentina Polyetherimide Market Revenue (Million) Forecast, by Application 2019 & 2032
- Table 68: Argentina Polyetherimide Market Volume (K Tons) Forecast, by Application 2019 & 2032
- Table 69: Peru Polyetherimide Market Revenue (Million) Forecast, by Application 2019 & 2032
- Table 70: Peru Polyetherimide Market Volume (K Tons) Forecast, by Application 2019 & 2032
- Table 71: Chile Polyetherimide Market Revenue (Million) Forecast, by Application 2019 & 2032
- Table 72: Chile Polyetherimide Market Volume (K Tons) Forecast, by Application 2019 & 2032
- Table 73: Colombia Polyetherimide Market Revenue (Million) Forecast, by Application 2019 & 2032
- Table 74: Colombia Polyetherimide Market Volume (K Tons) Forecast, by Application 2019 & 2032
- Table 75: Ecuador Polyetherimide Market Revenue (Million) Forecast, by Application 2019 & 2032
- Table 76: Ecuador Polyetherimide Market Volume (K Tons) Forecast, by Application 2019 & 2032
- Table 77: Venezuela Polyetherimide Market Revenue (Million) Forecast, by Application 2019 & 2032
- Table 78: Venezuela Polyetherimide Market Volume (K Tons) Forecast, by Application 2019 & 2032
- Table 79: Rest of South America Polyetherimide Market Revenue (Million) Forecast, by Application 2019 & 2032
- Table 80: Rest of South America Polyetherimide Market Volume (K Tons) Forecast, by Application 2019 & 2032
- Table 81: Global Polyetherimide Market Revenue Million Forecast, by Country 2019 & 2032
- Table 82: Global Polyetherimide Market Volume K Tons Forecast, by Country 2019 & 2032
- Table 83: United States Polyetherimide Market Revenue (Million) Forecast, by Application 2019 & 2032
- Table 84: United States Polyetherimide Market Volume (K Tons) Forecast, by Application 2019 & 2032
- Table 85: Canada Polyetherimide Market Revenue (Million) Forecast, by Application 2019 & 2032
- Table 86: Canada Polyetherimide Market Volume (K Tons) Forecast, by Application 2019 & 2032
- Table 87: Mexico Polyetherimide Market Revenue (Million) Forecast, by Application 2019 & 2032
- Table 88: Mexico Polyetherimide Market Volume (K Tons) Forecast, by Application 2019 & 2032
- Table 89: Global Polyetherimide Market Revenue Million Forecast, by Country 2019 & 2032
- Table 90: Global Polyetherimide Market Volume K Tons Forecast, by Country 2019 & 2032
- Table 91: United Arab Emirates Polyetherimide Market Revenue (Million) Forecast, by Application 2019 & 2032
- Table 92: United Arab Emirates Polyetherimide Market Volume (K Tons) Forecast, by Application 2019 & 2032
- Table 93: Saudi Arabia Polyetherimide Market Revenue (Million) Forecast, by Application 2019 & 2032
- Table 94: Saudi Arabia Polyetherimide Market Volume (K Tons) Forecast, by Application 2019 & 2032
- Table 95: South Africa Polyetherimide Market Revenue (Million) Forecast, by Application 2019 & 2032
- Table 96: South Africa Polyetherimide Market Volume (K Tons) Forecast, by Application 2019 & 2032
- Table 97: Rest of Middle East and Africa Polyetherimide Market Revenue (Million) Forecast, by Application 2019 & 2032
- Table 98: Rest of Middle East and Africa Polyetherimide Market Volume (K Tons) Forecast, by Application 2019 & 2032
- Table 99: Global Polyetherimide Market Revenue Million Forecast, by Grade 2019 & 2032
- Table 100: Global Polyetherimide Market Volume K Tons Forecast, by Grade 2019 & 2032
- Table 101: Global Polyetherimide Market Revenue Million Forecast, by End-User Industry 2019 & 2032
- Table 102: Global Polyetherimide Market Volume K Tons Forecast, by End-User Industry 2019 & 2032
- Table 103: Global Polyetherimide Market Revenue Million Forecast, by Country 2019 & 2032
- Table 104: Global Polyetherimide Market Volume K Tons Forecast, by Country 2019 & 2032
- Table 105: China Polyetherimide Market Revenue (Million) Forecast, by Application 2019 & 2032
- Table 106: China Polyetherimide Market Volume (K Tons) Forecast, by Application 2019 & 2032
- Table 107: India Polyetherimide Market Revenue (Million) Forecast, by Application 2019 & 2032
- Table 108: India Polyetherimide Market Volume (K Tons) Forecast, by Application 2019 & 2032
- Table 109: Japan Polyetherimide Market Revenue (Million) Forecast, by Application 2019 & 2032
- Table 110: Japan Polyetherimide Market Volume (K Tons) Forecast, by Application 2019 & 2032
- Table 111: South Korea Polyetherimide Market Revenue (Million) Forecast, by Application 2019 & 2032
- Table 112: South Korea Polyetherimide Market Volume (K Tons) Forecast, by Application 2019 & 2032
- Table 113: Southeast ASia Polyetherimide Market Revenue (Million) Forecast, by Application 2019 & 2032
- Table 114: Southeast ASia Polyetherimide Market Volume (K Tons) Forecast, by Application 2019 & 2032
- Table 115: Australia Polyetherimide Market Revenue (Million) Forecast, by Application 2019 & 2032
- Table 116: Australia Polyetherimide Market Volume (K Tons) Forecast, by Application 2019 & 2032
- Table 117: Rest of Asia Pacific Polyetherimide Market Revenue (Million) Forecast, by Application 2019 & 2032
- Table 118: Rest of Asia Pacific Polyetherimide Market Volume (K Tons) Forecast, by Application 2019 & 2032
- Table 119: Global Polyetherimide Market Revenue Million Forecast, by Grade 2019 & 2032
- Table 120: Global Polyetherimide Market Volume K Tons Forecast, by Grade 2019 & 2032
- Table 121: Global Polyetherimide Market Revenue Million Forecast, by End-User Industry 2019 & 2032
- Table 122: Global Polyetherimide Market Volume K Tons Forecast, by End-User Industry 2019 & 2032
- Table 123: Global Polyetherimide Market Revenue Million Forecast, by Country 2019 & 2032
- Table 124: Global Polyetherimide Market Volume K Tons Forecast, by Country 2019 & 2032
- Table 125: United States Polyetherimide Market Revenue (Million) Forecast, by Application 2019 & 2032
- Table 126: United States Polyetherimide Market Volume (K Tons) Forecast, by Application 2019 & 2032
- Table 127: Canada Polyetherimide Market Revenue (Million) Forecast, by Application 2019 & 2032
- Table 128: Canada Polyetherimide Market Volume (K Tons) Forecast, by Application 2019 & 2032
- Table 129: Mexico Polyetherimide Market Revenue (Million) Forecast, by Application 2019 & 2032
- Table 130: Mexico Polyetherimide Market Volume (K Tons) Forecast, by Application 2019 & 2032
- Table 131: Global Polyetherimide Market Revenue Million Forecast, by Grade 2019 & 2032
- Table 132: Global Polyetherimide Market Volume K Tons Forecast, by Grade 2019 & 2032
- Table 133: Global Polyetherimide Market Revenue Million Forecast, by End-User Industry 2019 & 2032
- Table 134: Global Polyetherimide Market Volume K Tons Forecast, by End-User Industry 2019 & 2032
- Table 135: Global Polyetherimide Market Revenue Million Forecast, by Country 2019 & 2032
- Table 136: Global Polyetherimide Market Volume K Tons Forecast, by Country 2019 & 2032
- Table 137: Germany Polyetherimide Market Revenue (Million) Forecast, by Application 2019 & 2032
- Table 138: Germany Polyetherimide Market Volume (K Tons) Forecast, by Application 2019 & 2032
- Table 139: United Kingdom Polyetherimide Market Revenue (Million) Forecast, by Application 2019 & 2032
- Table 140: United Kingdom Polyetherimide Market Volume (K Tons) Forecast, by Application 2019 & 2032
- Table 141: Italy Polyetherimide Market Revenue (Million) Forecast, by Application 2019 & 2032
- Table 142: Italy Polyetherimide Market Volume (K Tons) Forecast, by Application 2019 & 2032
- Table 143: France Polyetherimide Market Revenue (Million) Forecast, by Application 2019 & 2032
- Table 144: France Polyetherimide Market Volume (K Tons) Forecast, by Application 2019 & 2032
- Table 145: Spain Polyetherimide Market Revenue (Million) Forecast, by Application 2019 & 2032
- Table 146: Spain Polyetherimide Market Volume (K Tons) Forecast, by Application 2019 & 2032
- Table 147: Rest of Europe Polyetherimide Market Revenue (Million) Forecast, by Application 2019 & 2032
- Table 148: Rest of Europe Polyetherimide Market Volume (K Tons) Forecast, by Application 2019 & 2032
- Table 149: Global Polyetherimide Market Revenue Million Forecast, by Grade 2019 & 2032
- Table 150: Global Polyetherimide Market Volume K Tons Forecast, by Grade 2019 & 2032
- Table 151: Global Polyetherimide Market Revenue Million Forecast, by End-User Industry 2019 & 2032
- Table 152: Global Polyetherimide Market Volume K Tons Forecast, by End-User Industry 2019 & 2032
- Table 153: Global Polyetherimide Market Revenue Million Forecast, by Country 2019 & 2032
- Table 154: Global Polyetherimide Market Volume K Tons Forecast, by Country 2019 & 2032
- Table 155: Brazil Polyetherimide Market Revenue (Million) Forecast, by Application 2019 & 2032
- Table 156: Brazil Polyetherimide Market Volume (K Tons) Forecast, by Application 2019 & 2032
- Table 157: Argentina Polyetherimide Market Revenue (Million) Forecast, by Application 2019 & 2032
- Table 158: Argentina Polyetherimide Market Volume (K Tons) Forecast, by Application 2019 & 2032
- Table 159: Colombia Polyetherimide Market Revenue (Million) Forecast, by Application 2019 & 2032
- Table 160: Colombia Polyetherimide Market Volume (K Tons) Forecast, by Application 2019 & 2032
- Table 161: Rest of South America Polyetherimide Market Revenue (Million) Forecast, by Application 2019 & 2032
- Table 162: Rest of South America Polyetherimide Market Volume (K Tons) Forecast, by Application 2019 & 2032
- Table 163: Global Polyetherimide Market Revenue Million Forecast, by Grade 2019 & 2032
- Table 164: Global Polyetherimide Market Volume K Tons Forecast, by Grade 2019 & 2032
- Table 165: Global Polyetherimide Market Revenue Million Forecast, by End-User Industry 2019 & 2032
- Table 166: Global Polyetherimide Market Volume K Tons Forecast, by End-User Industry 2019 & 2032
- Table 167: Global Polyetherimide Market Revenue Million Forecast, by Country 2019 & 2032
- Table 168: Global Polyetherimide Market Volume K Tons Forecast, by Country 2019 & 2032
- Table 169: Saudi Arabia Polyetherimide Market Revenue (Million) Forecast, by Application 2019 & 2032
- Table 170: Saudi Arabia Polyetherimide Market Volume (K Tons) Forecast, by Application 2019 & 2032
- Table 171: South Africa Polyetherimide Market Revenue (Million) Forecast, by Application 2019 & 2032
- Table 172: South Africa Polyetherimide Market Volume (K Tons) Forecast, by Application 2019 & 2032
- Table 173: UAE Polyetherimide Market Revenue (Million) Forecast, by Application 2019 & 2032
- Table 174: UAE Polyetherimide Market Volume (K Tons) Forecast, by Application 2019 & 2032
- Table 175: Rest of Middle East and Africa Polyetherimide Market Revenue (Million) Forecast, by Application 2019 & 2032
- Table 176: Rest of Middle East and Africa Polyetherimide Market Volume (K Tons) Forecast, by Application 2019 & 2032
Frequently Asked Questions
1. What is the projected Compound Annual Growth Rate (CAGR) of the Polyetherimide Market?
The projected CAGR is approximately > 6.50%.
2. Which companies are prominent players in the Polyetherimide Market?
Key companies in the market include Solvay, GEHR, Röchling SE & Co KG, Avient Corporation, Emco Industrial Plastics, SABIC, the Mitsubishi Chemical Group of companies, RTP Company, Kuraray Europe GmbH, Aikolon Oy, Ensinger, Eagle Performance Plastics Inc.
3. What are the main segments of the Polyetherimide Market?
The market segments include Grade, End-User Industry.
4. Can you provide details about the market size?
The market size is estimated to be USD 663.10 Million as of 2022.
5. What are some drivers contributing to market growth?
Increasing Demand from the Transportation Industry; Rapid Growth in the Automotive Sector; Increasing Usage in Healthcare Sector.
6. What are the notable trends driving market growth?
Increasing demand from Electrical & Electronics Industry.
7. Are there any restraints impacting market growth?
High Price When Compared to the Conventional Polymers; Availability of Substitute Materials.
8. Can you provide examples of recent developments in the market?
N/A
9. What pricing options are available for accessing the report?
Pricing options include single-user, multi-user, and enterprise licenses priced at USD 4750, USD 5250, and USD 8750 respectively.
10. Is the market size provided in terms of value or volume?
The market size is provided in terms of value, measured in Million and volume, measured in K Tons.
11. Are there any specific market keywords associated with the report?
Yes, the market keyword associated with the report is "Polyetherimide Market," which aids in identifying and referencing the specific market segment covered.
12. How do I determine which pricing option suits my needs best?
The pricing options vary based on user requirements and access needs. Individual users may opt for single-user licenses, while businesses requiring broader access may choose multi-user or enterprise licenses for cost-effective access to the report.
13. Are there any additional resources or data provided in the Polyetherimide Market report?
While the report offers comprehensive insights, it's advisable to review the specific contents or supplementary materials provided to ascertain if additional resources or data are available.
14. How can I stay updated on further developments or reports in the Polyetherimide Market?
To stay informed about further developments, trends, and reports in the Polyetherimide Market, consider subscribing to industry newsletters, following relevant companies and organizations, or regularly checking reputable industry news sources and publications.
Methodology
Step 1 - Identification of Relevant Samples Size from Population Database


Step 2 - Approaches for Defining Global Market Size (Value, Volume* & Price*)

Note*: In applicable scenarios
Step 3 - Data Sources
Primary Research
- Web Analytics
- Survey Reports
- Research Institute
- Latest Research Reports
- Opinion Leaders
Secondary Research
- Annual Reports
- White Paper
- Latest Press Release
- Industry Association
- Paid Database
- Investor Presentations

Step 4 - Data Triangulation
Involves using different sources of information in order to increase the validity of a study
These sources are likely to be stakeholders in a program - participants, other researchers, program staff, other community members, and so on.
Then we put all data in single framework & apply various statistical tools to find out the dynamic on the market.
During the analysis stage, feedback from the stakeholder groups would be compared to determine areas of agreement as well as areas of divergence
