

Key Insights
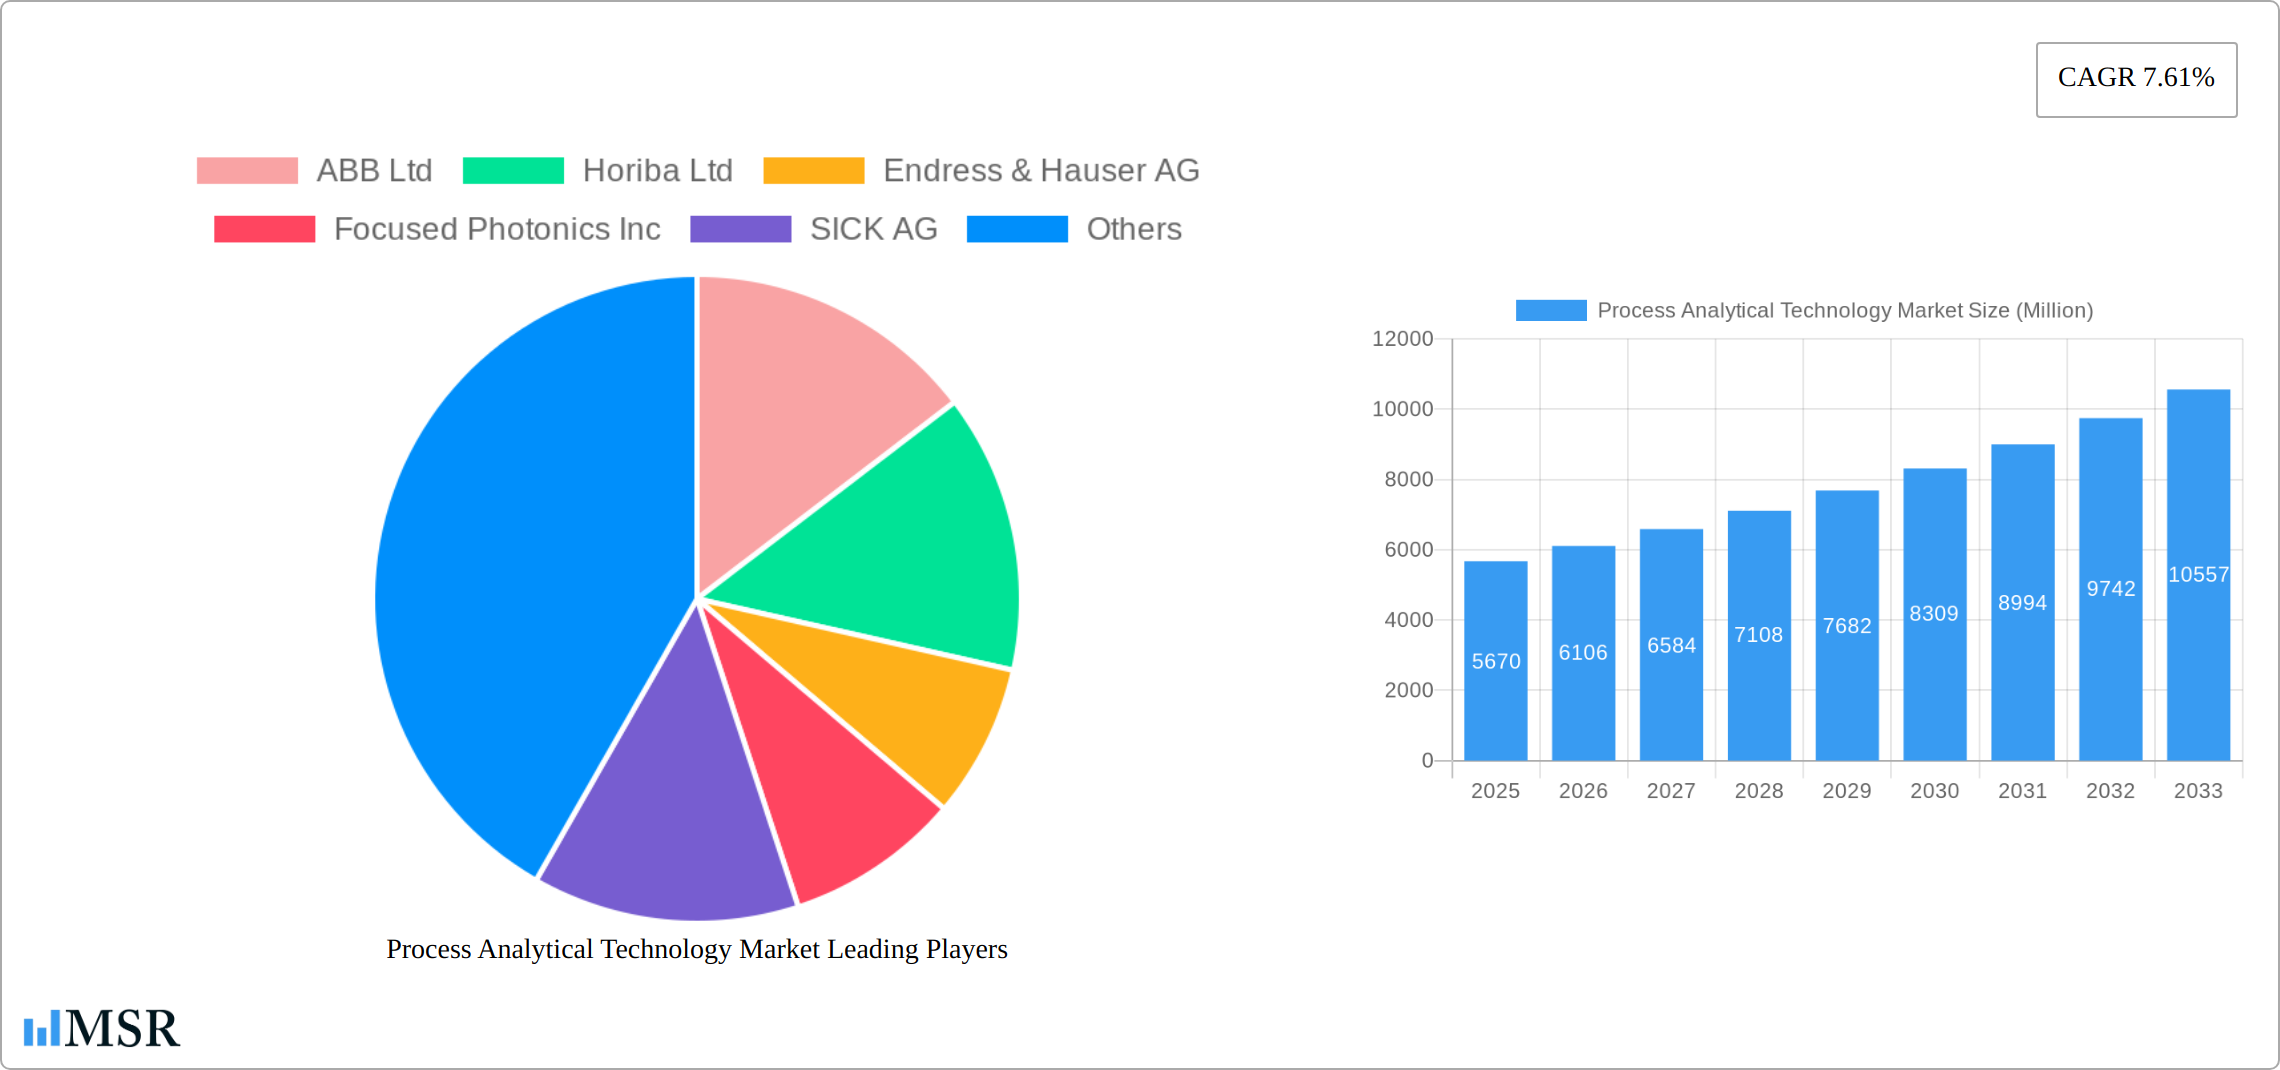
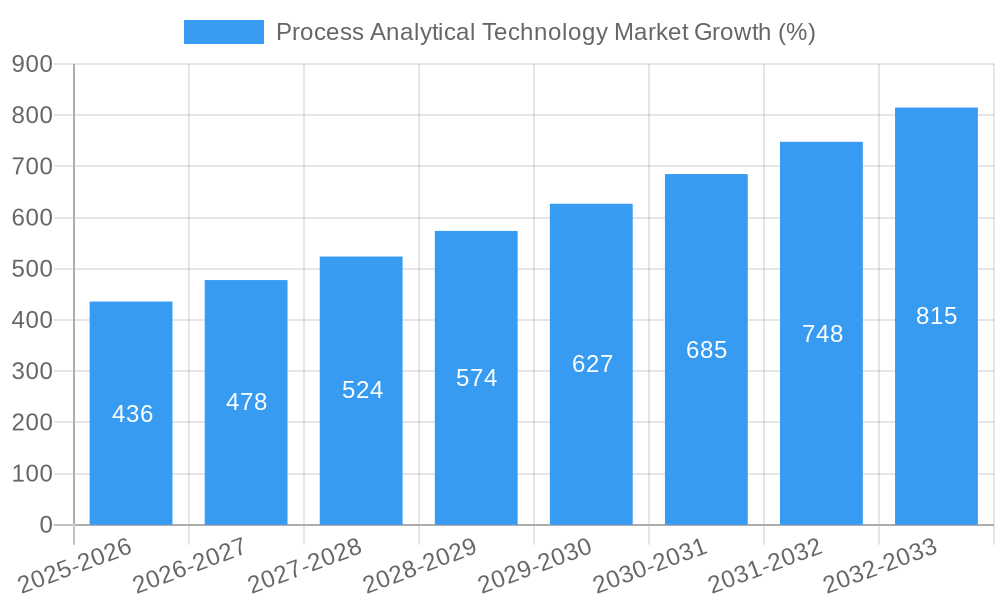
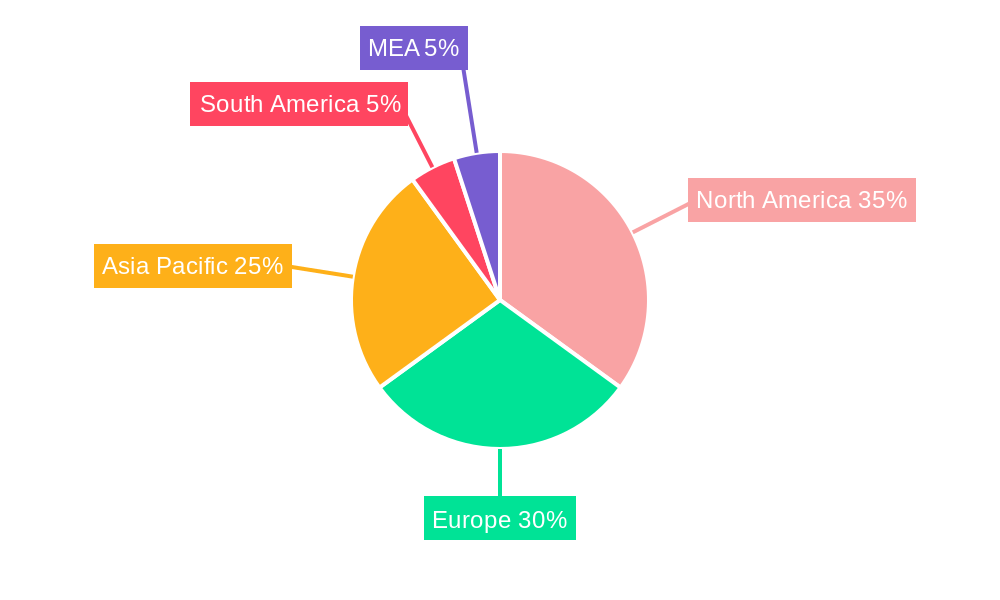
The Process Analytical Technology (PAT) market, valued at $5.67 billion in 2025, is projected to experience robust growth, exhibiting a Compound Annual Growth Rate (CAGR) of 7.61% from 2025 to 2033. This expansion is driven by several key factors. The increasing demand for enhanced process efficiency and quality control across various industries, particularly in pharmaceuticals and petrochemicals, fuels market growth. Stringent regulatory requirements for product safety and quality are also pushing adoption of advanced PAT solutions. Furthermore, technological advancements in analytical instruments, such as miniaturization, improved sensitivity, and real-time data analysis capabilities, are contributing to the market's expansion. The integration of PAT systems with digital technologies, such as cloud computing and artificial intelligence (AI), further enhances their capabilities and appeal, enabling predictive maintenance and optimized process control. Growth is expected across all segments, with gas chromatographs, liquid analyzers, and spectrometers witnessing significant demand. Geographically, North America and Europe currently hold substantial market shares, but the Asia-Pacific region is anticipated to show significant growth potential due to industrialization and rising investments in infrastructure.
While the market presents substantial opportunities, certain restraints exist. High initial investment costs associated with advanced PAT systems can be a barrier to entry for smaller companies. Furthermore, the need for skilled personnel to operate and maintain these sophisticated technologies poses a challenge. Nevertheless, the long-term benefits of improved product quality, reduced operational costs, and enhanced regulatory compliance are expected to outweigh these challenges, driving continued market expansion throughout the forecast period. The competitive landscape comprises established players like ABB, Horiba, and Siemens, alongside emerging companies specializing in niche technologies. Strategic partnerships and collaborations are becoming increasingly crucial for players to enhance their market position and offer comprehensive PAT solutions.
Process Analytical Technology (PAT) Market Report: 2019-2033
This comprehensive report provides an in-depth analysis of the Process Analytical Technology (PAT) market, offering invaluable insights for industry stakeholders. With a study period spanning 2019-2033, a base year of 2025, and a forecast period of 2025-2033, this report details market dynamics, key segments, leading players, and future growth opportunities. The market is segmented by type (Gas Chromatographs, Gas Analyzers, Liquid Analyzers, Spectrometers) and end-user industry (Oil and Gas, Chemicals & Petrochemicals, Pharmaceutical & Biotechnology, Metal & Mining, Water & Wastewater, Other End-user Industries). The report is enriched with real-world examples of recent industry developments and includes a detailed competitive landscape, highlighting key players such as ABB Ltd, Horiba Ltd, and Endress+Hauser AG. The total market size is predicted to reach xx Million by 2033, exhibiting a CAGR of xx%.
Process Analytical Technology Market Market Concentration & Dynamics
The PAT market presents a moderately concentrated landscape dominated by several large multinational corporations holding substantial market share. This concentration is shaped by a confluence of factors, including rapid technological advancements, evolving regulatory landscapes, and a surge in mergers and acquisitions (M&A) activity. The frequency of M&A deals within the PAT sector has notably increased in recent years, with a substantial number recorded in 2024 alone. This trend strongly suggests a market shift towards consolidation, empowering established players to expand their market dominance.
Innovation Ecosystems: Robust innovation ecosystems are thriving, fueled by significant R&D investments from both established industry giants and agile startups. This dynamic environment fosters the continuous development of cutting-edge PAT technologies, directly impacting market dynamics and competitiveness.
Regulatory Frameworks: Stringent regulatory requirements, particularly within sectors such as pharmaceuticals and biotechnology, exert a considerable influence on PAT adoption rates and overall market growth. The imperative for regulatory compliance significantly drives demand for sophisticated and reliable PAT solutions.
Substitute Products: While readily available substitutes for sophisticated PAT equipment remain limited due to the specialized nature of their applications, alternative analytical methods may present competitive challenges within niche market segments.
End-User Trends: The escalating demand for enhanced process efficiency, superior product quality, and reduced operational costs across diverse industries serves as a primary catalyst for the widespread adoption of PAT technologies.
M&A Activities: The acquisition of Schneider Electric's process analyzer business by Process Insights in June 2022 exemplifies the strategic consolidation trend within the market. This highlights the crucial importance of expanding product portfolios and achieving broader market reach for competitive advantage.
Process Analytical Technology Market Industry Insights & Trends
The PAT market is experiencing robust growth, driven by several key factors. The global market size was valued at xx Million in 2024 and is projected to reach xx Million by 2033, registering a CAGR of xx% during the forecast period (2025-2033). This expansion is fueled by the increasing demand for real-time process monitoring and control across various end-user industries. Technological advancements, such as the miniaturization of sensors and the integration of advanced data analytics capabilities, are further accelerating market growth. The rising adoption of Industry 4.0 principles and digitalization initiatives is creating new opportunities for PAT technologies in several sectors, particularly in the pharmaceutical, biotechnology and chemical industries. Evolving consumer behavior that demands enhanced product quality and safety is also propelling the adoption of PAT.
Key Markets & Segments Leading Process Analytical Technology Market
The pharmaceutical and biotechnology sector is the dominant end-user industry for PAT, primarily due to stringent regulatory requirements and the growing focus on improving process efficiency and product quality within the industry. The North American region currently holds the largest market share.
Leading Segments:
Type: Spectrometers and Gas Analyzers hold a significant market share, driven by their widespread applicability across various industries.
End-user Industry:
- Pharmaceutical & Biotechnology: High demand for quality control and stringent regulatory compliance in drug manufacturing are primary drivers.
- Chemicals & Petrochemicals: PAT plays a crucial role in optimizing chemical processes and ensuring consistent product quality.
- Oil and Gas: The use of PAT improves operational efficiency, safety and environmental compliance within oil and gas extraction and processing.
Drivers:
- Stringent Regulatory Compliance: The implementation of stringent regulations across several industries is driving the adoption of PAT systems to meet compliance needs.
- Growing Demand for Automation: The push towards automation in several industries boosts the demand for real-time process monitoring and control.
- Technological Advancements: Continuous improvements in PAT technologies, making these solutions more efficient, cost-effective and user-friendly, are major growth drivers.
Process Analytical Technology Market Product Developments
Recent product launches underscore the dynamism of the PAT market. Significant innovations include Horiba Ltd.'s HyEVO hydrogen gas analyzer (March 2022) and Bruker Corporation's Minispec Droplet Size Analyzer 2.0 (May 2022), showcasing advancements in gas analysis and droplet size characterization. These new technologies offer improved precision, speed, and user-friendliness, leading to enhanced efficiency and effectiveness in process monitoring and control. The acquisition of Schneider Electric's process analyzer business by Process Insights in June 2022 further expanded the available product offerings, emphasizing the dynamic competitive landscape and the strategic push towards comprehensive PAT solutions.
Challenges in the Process Analytical Technology Market Market
Despite its growth potential, the PAT market faces several key challenges. High initial investment costs associated with advanced systems, the complexity of integrating PAT into existing manufacturing processes, and the need for highly skilled personnel to operate and maintain the equipment present significant hurdles. Furthermore, navigating regulatory hurdles and mitigating the impact of supply chain disruptions remain critical concerns that can influence market growth trajectory.
Forces Driving Process Analytical Technology Market Growth
Several key factors are driving the expansion of the PAT market. Stringent regulatory demands for enhanced process control and superior product quality, the increasing adoption of Industry 4.0 principles, and continuous technological advancements in sensor technology, data analytics, and automation are all significant contributors. The robust growth of the pharmaceutical and biotechnology sectors further fuels market expansion, creating substantial demand for advanced PAT solutions.
Long-Term Growth Catalysts in Process Analytical Technology Market
Long-term growth is predicted to be driven by strategic partnerships between PAT technology providers and end-user industries, further investments in R&D leading to new and improved technologies, and the expansion into new and emerging markets across several industries.
Emerging Opportunities in Process Analytical Technology Market
The PAT market presents compelling emerging opportunities. The development of miniaturized, portable, and cost-effective PAT systems is gaining traction. The integration of advanced data analytics and artificial intelligence (AI) into PAT technologies promises to unlock new levels of efficiency and insights. Finally, expansion into rapidly developing economies experiencing increasing industrialization presents a significant avenue for market growth and penetration.
Leading Players in the Process Analytical Technology Market Sector
- ABB Ltd
- Horiba Ltd
- Endress+Hauser AG
- Focused Photonics Inc
- SICK AG
- Emerson Electric Co
- Siemens AG
- Schneider Electric SE
- MKS Instruments Inc
- Mettler Toledo
- Hach Company
- Neo Monitors AS
- Bruker Corporation
- ServomexGroup Limited
- Extrel CMS LLC
Key Milestones in Process Analytical Technology Market Industry
August 2023: Rentschler Biopharma's collaboration with Refeyn and CGT Catapult to leverage PAT for AAV gene therapy manufacturing highlights the increasing importance of PAT in advanced therapy development.
March 2023: The inauguration of CGT Catapult's PAT lab underscores the growing need for real-time monitoring and control in cell and gene therapy production.
June 2022: Process Insights' acquisition of Schneider Electric's Process Analyzers business signifies market consolidation and expansion of product offerings.
May 2022: Bruker Corporation's launch of the Minispec Droplet Size Analyzer 2.0 showcases innovation in TD-NMR technology for food and cosmetic applications.
March 2022: Horiba Ltd's launch of the HyEVO hydrogen gas analyzer demonstrates advancements in hydrogen technology analysis.
Strategic Outlook for Process Analytical Technology Market Market
The future of the PAT market is bright, driven by technological innovation, increasing regulatory scrutiny, and the growing adoption of PAT across various industries. Strategic partnerships, R&D investments, and expansion into new markets will shape the competitive landscape and drive further growth. The market is poised for significant expansion, with substantial opportunities for companies that can offer advanced, cost-effective, and user-friendly PAT solutions.
Process Analytical Technology Market Segmentation
-
1. Type
- 1.1. Gas Chromatographs
- 1.2. Gas Analyzers
- 1.3. Liquid Analyzers
- 1.4. Spectrometers
-
2. End-user Industry
- 2.1. Oil and Gas
- 2.2. Chemicals & Petrochemicals
- 2.3. Pharmaceutical & Biotechnology
- 2.4. Metal & Mining
- 2.5. Water & Wastewater
- 2.6. Other End-user Industries
Process Analytical Technology Market Segmentation By Geography
- 1. North America
- 2. Europe
- 3. Asia Pacific
- 4. Rest of the World
Process Analytical Technology Market REPORT HIGHLIGHTS
| Aspects | Details |
|---|---|
| Study Period | 2019-2033 |
| Base Year | 2024 |
| Estimated Year | 2025 |
| Forecast Period | 2025-2033 |
| Historical Period | 2019-2024 |
| Growth Rate | CAGR of 7.61% from 2019-2033 |
| Segmentation |
|
Table of Contents
- 1. Introduction
- 1.1. Research Scope
- 1.2. Market Segmentation
- 1.3. Research Methodology
- 1.4. Definitions and Assumptions
- 2. Executive Summary
- 2.1. Introduction
- 3. Market Dynamics
- 3.1. Introduction
- 3.2. Market Drivers
- 3.2.1. Introduction of High-efficient Motors; Increasing Adoption of Power Management and Predictive Maintenance Solutions
- 3.3. Market Restrains
- 3.3.1. ; High Initial Infrastructure Expenditure
- 3.4. Market Trends
- 3.4.1. Pharmaceutical and Biotechnology is Observing a Significant Growth
- 4. Market Factor Analysis
- 4.1. Porters Five Forces
- 4.2. Supply/Value Chain
- 4.3. PESTEL analysis
- 4.4. Market Entropy
- 4.5. Patent/Trademark Analysis
- 5. Global Process Analytical Technology Market Analysis, Insights and Forecast, 2019-2031
- 5.1. Market Analysis, Insights and Forecast - by Type
- 5.1.1. Gas Chromatographs
- 5.1.2. Gas Analyzers
- 5.1.3. Liquid Analyzers
- 5.1.4. Spectrometers
- 5.2. Market Analysis, Insights and Forecast - by End-user Industry
- 5.2.1. Oil and Gas
- 5.2.2. Chemicals & Petrochemicals
- 5.2.3. Pharmaceutical & Biotechnology
- 5.2.4. Metal & Mining
- 5.2.5. Water & Wastewater
- 5.2.6. Other End-user Industries
- 5.3. Market Analysis, Insights and Forecast - by Region
- 5.3.1. North America
- 5.3.2. Europe
- 5.3.3. Asia Pacific
- 5.3.4. Rest of the World
- 5.1. Market Analysis, Insights and Forecast - by Type
- 6. North America Process Analytical Technology Market Analysis, Insights and Forecast, 2019-2031
- 6.1. Market Analysis, Insights and Forecast - by Type
- 6.1.1. Gas Chromatographs
- 6.1.2. Gas Analyzers
- 6.1.3. Liquid Analyzers
- 6.1.4. Spectrometers
- 6.2. Market Analysis, Insights and Forecast - by End-user Industry
- 6.2.1. Oil and Gas
- 6.2.2. Chemicals & Petrochemicals
- 6.2.3. Pharmaceutical & Biotechnology
- 6.2.4. Metal & Mining
- 6.2.5. Water & Wastewater
- 6.2.6. Other End-user Industries
- 6.1. Market Analysis, Insights and Forecast - by Type
- 7. Europe Process Analytical Technology Market Analysis, Insights and Forecast, 2019-2031
- 7.1. Market Analysis, Insights and Forecast - by Type
- 7.1.1. Gas Chromatographs
- 7.1.2. Gas Analyzers
- 7.1.3. Liquid Analyzers
- 7.1.4. Spectrometers
- 7.2. Market Analysis, Insights and Forecast - by End-user Industry
- 7.2.1. Oil and Gas
- 7.2.2. Chemicals & Petrochemicals
- 7.2.3. Pharmaceutical & Biotechnology
- 7.2.4. Metal & Mining
- 7.2.5. Water & Wastewater
- 7.2.6. Other End-user Industries
- 7.1. Market Analysis, Insights and Forecast - by Type
- 8. Asia Pacific Process Analytical Technology Market Analysis, Insights and Forecast, 2019-2031
- 8.1. Market Analysis, Insights and Forecast - by Type
- 8.1.1. Gas Chromatographs
- 8.1.2. Gas Analyzers
- 8.1.3. Liquid Analyzers
- 8.1.4. Spectrometers
- 8.2. Market Analysis, Insights and Forecast - by End-user Industry
- 8.2.1. Oil and Gas
- 8.2.2. Chemicals & Petrochemicals
- 8.2.3. Pharmaceutical & Biotechnology
- 8.2.4. Metal & Mining
- 8.2.5. Water & Wastewater
- 8.2.6. Other End-user Industries
- 8.1. Market Analysis, Insights and Forecast - by Type
- 9. Rest of the World Process Analytical Technology Market Analysis, Insights and Forecast, 2019-2031
- 9.1. Market Analysis, Insights and Forecast - by Type
- 9.1.1. Gas Chromatographs
- 9.1.2. Gas Analyzers
- 9.1.3. Liquid Analyzers
- 9.1.4. Spectrometers
- 9.2. Market Analysis, Insights and Forecast - by End-user Industry
- 9.2.1. Oil and Gas
- 9.2.2. Chemicals & Petrochemicals
- 9.2.3. Pharmaceutical & Biotechnology
- 9.2.4. Metal & Mining
- 9.2.5. Water & Wastewater
- 9.2.6. Other End-user Industries
- 9.1. Market Analysis, Insights and Forecast - by Type
- 10. North America Process Analytical Technology Market Analysis, Insights and Forecast, 2019-2031
- 10.1. Market Analysis, Insights and Forecast - By Country/Sub-region
- 10.1.1. undefined
- 11. Europe Process Analytical Technology Market Analysis, Insights and Forecast, 2019-2031
- 11.1. Market Analysis, Insights and Forecast - By Country/Sub-region
- 11.1.1. undefined
- 12. Asia Pacific Process Analytical Technology Market Analysis, Insights and Forecast, 2019-2031
- 12.1. Market Analysis, Insights and Forecast - By Country/Sub-region
- 12.1.1. undefined
- 13. South America Process Analytical Technology Market Analysis, Insights and Forecast, 2019-2031
- 13.1. Market Analysis, Insights and Forecast - By Country/Sub-region
- 13.1.1. undefined
- 14. North America Process Analytical Technology Market Analysis, Insights and Forecast, 2019-2031
- 14.1. Market Analysis, Insights and Forecast - By Country/Sub-region
- 14.1.1. undefined
- 15. MEA Process Analytical Technology Market Analysis, Insights and Forecast, 2019-2031
- 15.1. Market Analysis, Insights and Forecast - By Country/Sub-region
- 15.1.1. undefined
- 16. Competitive Analysis
- 16.1. Global Market Share Analysis 2024
- 16.2. Company Profiles
- 16.2.1 ABB Ltd
- 16.2.1.1. Overview
- 16.2.1.2. Products
- 16.2.1.3. SWOT Analysis
- 16.2.1.4. Recent Developments
- 16.2.1.5. Financials (Based on Availability)
- 16.2.2 Horiba Ltd
- 16.2.2.1. Overview
- 16.2.2.2. Products
- 16.2.2.3. SWOT Analysis
- 16.2.2.4. Recent Developments
- 16.2.2.5. Financials (Based on Availability)
- 16.2.3 Endress & Hauser AG
- 16.2.3.1. Overview
- 16.2.3.2. Products
- 16.2.3.3. SWOT Analysis
- 16.2.3.4. Recent Developments
- 16.2.3.5. Financials (Based on Availability)
- 16.2.4 Focused Photonics Inc
- 16.2.4.1. Overview
- 16.2.4.2. Products
- 16.2.4.3. SWOT Analysis
- 16.2.4.4. Recent Developments
- 16.2.4.5. Financials (Based on Availability)
- 16.2.5 SICK AG
- 16.2.5.1. Overview
- 16.2.5.2. Products
- 16.2.5.3. SWOT Analysis
- 16.2.5.4. Recent Developments
- 16.2.5.5. Financials (Based on Availability)
- 16.2.6 Emerson Electric Co
- 16.2.6.1. Overview
- 16.2.6.2. Products
- 16.2.6.3. SWOT Analysis
- 16.2.6.4. Recent Developments
- 16.2.6.5. Financials (Based on Availability)
- 16.2.7 Siemens AG
- 16.2.7.1. Overview
- 16.2.7.2. Products
- 16.2.7.3. SWOT Analysis
- 16.2.7.4. Recent Developments
- 16.2.7.5. Financials (Based on Availability)
- 16.2.8 Schneider Electric SE
- 16.2.8.1. Overview
- 16.2.8.2. Products
- 16.2.8.3. SWOT Analysis
- 16.2.8.4. Recent Developments
- 16.2.8.5. Financials (Based on Availability)
- 16.2.9 MKS Instruments Inc
- 16.2.9.1. Overview
- 16.2.9.2. Products
- 16.2.9.3. SWOT Analysis
- 16.2.9.4. Recent Developments
- 16.2.9.5. Financials (Based on Availability)
- 16.2.10 Mettler Toledo
- 16.2.10.1. Overview
- 16.2.10.2. Products
- 16.2.10.3. SWOT Analysis
- 16.2.10.4. Recent Developments
- 16.2.10.5. Financials (Based on Availability)
- 16.2.11 Hach Company
- 16.2.11.1. Overview
- 16.2.11.2. Products
- 16.2.11.3. SWOT Analysis
- 16.2.11.4. Recent Developments
- 16.2.11.5. Financials (Based on Availability)
- 16.2.12 Neo Monitors AS
- 16.2.12.1. Overview
- 16.2.12.2. Products
- 16.2.12.3. SWOT Analysis
- 16.2.12.4. Recent Developments
- 16.2.12.5. Financials (Based on Availability)
- 16.2.13 Bruker Corporation
- 16.2.13.1. Overview
- 16.2.13.2. Products
- 16.2.13.3. SWOT Analysis
- 16.2.13.4. Recent Developments
- 16.2.13.5. Financials (Based on Availability)
- 16.2.14 ServomexGroup Limited
- 16.2.14.1. Overview
- 16.2.14.2. Products
- 16.2.14.3. SWOT Analysis
- 16.2.14.4. Recent Developments
- 16.2.14.5. Financials (Based on Availability)
- 16.2.15 Extrel CMS LLC
- 16.2.15.1. Overview
- 16.2.15.2. Products
- 16.2.15.3. SWOT Analysis
- 16.2.15.4. Recent Developments
- 16.2.15.5. Financials (Based on Availability)
- 16.2.1 ABB Ltd
List of Figures
- Figure 1: Global Process Analytical Technology Market Revenue Breakdown (Million, %) by Region 2024 & 2032
- Figure 2: Global Process Analytical Technology Market Volume Breakdown (K Unit, %) by Region 2024 & 2032
- Figure 3: North America Process Analytical Technology Market Revenue (Million), by Country 2024 & 2032
- Figure 4: North America Process Analytical Technology Market Volume (K Unit), by Country 2024 & 2032
- Figure 5: North America Process Analytical Technology Market Revenue Share (%), by Country 2024 & 2032
- Figure 6: North America Process Analytical Technology Market Volume Share (%), by Country 2024 & 2032
- Figure 7: Europe Process Analytical Technology Market Revenue (Million), by Country 2024 & 2032
- Figure 8: Europe Process Analytical Technology Market Volume (K Unit), by Country 2024 & 2032
- Figure 9: Europe Process Analytical Technology Market Revenue Share (%), by Country 2024 & 2032
- Figure 10: Europe Process Analytical Technology Market Volume Share (%), by Country 2024 & 2032
- Figure 11: Asia Pacific Process Analytical Technology Market Revenue (Million), by Country 2024 & 2032
- Figure 12: Asia Pacific Process Analytical Technology Market Volume (K Unit), by Country 2024 & 2032
- Figure 13: Asia Pacific Process Analytical Technology Market Revenue Share (%), by Country 2024 & 2032
- Figure 14: Asia Pacific Process Analytical Technology Market Volume Share (%), by Country 2024 & 2032
- Figure 15: South America Process Analytical Technology Market Revenue (Million), by Country 2024 & 2032
- Figure 16: South America Process Analytical Technology Market Volume (K Unit), by Country 2024 & 2032
- Figure 17: South America Process Analytical Technology Market Revenue Share (%), by Country 2024 & 2032
- Figure 18: South America Process Analytical Technology Market Volume Share (%), by Country 2024 & 2032
- Figure 19: North America Process Analytical Technology Market Revenue (Million), by Country 2024 & 2032
- Figure 20: North America Process Analytical Technology Market Volume (K Unit), by Country 2024 & 2032
- Figure 21: North America Process Analytical Technology Market Revenue Share (%), by Country 2024 & 2032
- Figure 22: North America Process Analytical Technology Market Volume Share (%), by Country 2024 & 2032
- Figure 23: MEA Process Analytical Technology Market Revenue (Million), by Country 2024 & 2032
- Figure 24: MEA Process Analytical Technology Market Volume (K Unit), by Country 2024 & 2032
- Figure 25: MEA Process Analytical Technology Market Revenue Share (%), by Country 2024 & 2032
- Figure 26: MEA Process Analytical Technology Market Volume Share (%), by Country 2024 & 2032
- Figure 27: North America Process Analytical Technology Market Revenue (Million), by Type 2024 & 2032
- Figure 28: North America Process Analytical Technology Market Volume (K Unit), by Type 2024 & 2032
- Figure 29: North America Process Analytical Technology Market Revenue Share (%), by Type 2024 & 2032
- Figure 30: North America Process Analytical Technology Market Volume Share (%), by Type 2024 & 2032
- Figure 31: North America Process Analytical Technology Market Revenue (Million), by End-user Industry 2024 & 2032
- Figure 32: North America Process Analytical Technology Market Volume (K Unit), by End-user Industry 2024 & 2032
- Figure 33: North America Process Analytical Technology Market Revenue Share (%), by End-user Industry 2024 & 2032
- Figure 34: North America Process Analytical Technology Market Volume Share (%), by End-user Industry 2024 & 2032
- Figure 35: North America Process Analytical Technology Market Revenue (Million), by Country 2024 & 2032
- Figure 36: North America Process Analytical Technology Market Volume (K Unit), by Country 2024 & 2032
- Figure 37: North America Process Analytical Technology Market Revenue Share (%), by Country 2024 & 2032
- Figure 38: North America Process Analytical Technology Market Volume Share (%), by Country 2024 & 2032
- Figure 39: Europe Process Analytical Technology Market Revenue (Million), by Type 2024 & 2032
- Figure 40: Europe Process Analytical Technology Market Volume (K Unit), by Type 2024 & 2032
- Figure 41: Europe Process Analytical Technology Market Revenue Share (%), by Type 2024 & 2032
- Figure 42: Europe Process Analytical Technology Market Volume Share (%), by Type 2024 & 2032
- Figure 43: Europe Process Analytical Technology Market Revenue (Million), by End-user Industry 2024 & 2032
- Figure 44: Europe Process Analytical Technology Market Volume (K Unit), by End-user Industry 2024 & 2032
- Figure 45: Europe Process Analytical Technology Market Revenue Share (%), by End-user Industry 2024 & 2032
- Figure 46: Europe Process Analytical Technology Market Volume Share (%), by End-user Industry 2024 & 2032
- Figure 47: Europe Process Analytical Technology Market Revenue (Million), by Country 2024 & 2032
- Figure 48: Europe Process Analytical Technology Market Volume (K Unit), by Country 2024 & 2032
- Figure 49: Europe Process Analytical Technology Market Revenue Share (%), by Country 2024 & 2032
- Figure 50: Europe Process Analytical Technology Market Volume Share (%), by Country 2024 & 2032
- Figure 51: Asia Pacific Process Analytical Technology Market Revenue (Million), by Type 2024 & 2032
- Figure 52: Asia Pacific Process Analytical Technology Market Volume (K Unit), by Type 2024 & 2032
- Figure 53: Asia Pacific Process Analytical Technology Market Revenue Share (%), by Type 2024 & 2032
- Figure 54: Asia Pacific Process Analytical Technology Market Volume Share (%), by Type 2024 & 2032
- Figure 55: Asia Pacific Process Analytical Technology Market Revenue (Million), by End-user Industry 2024 & 2032
- Figure 56: Asia Pacific Process Analytical Technology Market Volume (K Unit), by End-user Industry 2024 & 2032
- Figure 57: Asia Pacific Process Analytical Technology Market Revenue Share (%), by End-user Industry 2024 & 2032
- Figure 58: Asia Pacific Process Analytical Technology Market Volume Share (%), by End-user Industry 2024 & 2032
- Figure 59: Asia Pacific Process Analytical Technology Market Revenue (Million), by Country 2024 & 2032
- Figure 60: Asia Pacific Process Analytical Technology Market Volume (K Unit), by Country 2024 & 2032
- Figure 61: Asia Pacific Process Analytical Technology Market Revenue Share (%), by Country 2024 & 2032
- Figure 62: Asia Pacific Process Analytical Technology Market Volume Share (%), by Country 2024 & 2032
- Figure 63: Rest of the World Process Analytical Technology Market Revenue (Million), by Type 2024 & 2032
- Figure 64: Rest of the World Process Analytical Technology Market Volume (K Unit), by Type 2024 & 2032
- Figure 65: Rest of the World Process Analytical Technology Market Revenue Share (%), by Type 2024 & 2032
- Figure 66: Rest of the World Process Analytical Technology Market Volume Share (%), by Type 2024 & 2032
- Figure 67: Rest of the World Process Analytical Technology Market Revenue (Million), by End-user Industry 2024 & 2032
- Figure 68: Rest of the World Process Analytical Technology Market Volume (K Unit), by End-user Industry 2024 & 2032
- Figure 69: Rest of the World Process Analytical Technology Market Revenue Share (%), by End-user Industry 2024 & 2032
- Figure 70: Rest of the World Process Analytical Technology Market Volume Share (%), by End-user Industry 2024 & 2032
- Figure 71: Rest of the World Process Analytical Technology Market Revenue (Million), by Country 2024 & 2032
- Figure 72: Rest of the World Process Analytical Technology Market Volume (K Unit), by Country 2024 & 2032
- Figure 73: Rest of the World Process Analytical Technology Market Revenue Share (%), by Country 2024 & 2032
- Figure 74: Rest of the World Process Analytical Technology Market Volume Share (%), by Country 2024 & 2032
List of Tables
- Table 1: Global Process Analytical Technology Market Revenue Million Forecast, by Region 2019 & 2032
- Table 2: Global Process Analytical Technology Market Volume K Unit Forecast, by Region 2019 & 2032
- Table 3: Global Process Analytical Technology Market Revenue Million Forecast, by Type 2019 & 2032
- Table 4: Global Process Analytical Technology Market Volume K Unit Forecast, by Type 2019 & 2032
- Table 5: Global Process Analytical Technology Market Revenue Million Forecast, by End-user Industry 2019 & 2032
- Table 6: Global Process Analytical Technology Market Volume K Unit Forecast, by End-user Industry 2019 & 2032
- Table 7: Global Process Analytical Technology Market Revenue Million Forecast, by Region 2019 & 2032
- Table 8: Global Process Analytical Technology Market Volume K Unit Forecast, by Region 2019 & 2032
- Table 9: Global Process Analytical Technology Market Revenue Million Forecast, by Country 2019 & 2032
- Table 10: Global Process Analytical Technology Market Volume K Unit Forecast, by Country 2019 & 2032
- Table 11: Global Process Analytical Technology Market Revenue Million Forecast, by Country 2019 & 2032
- Table 12: Global Process Analytical Technology Market Volume K Unit Forecast, by Country 2019 & 2032
- Table 13: Global Process Analytical Technology Market Revenue Million Forecast, by Country 2019 & 2032
- Table 14: Global Process Analytical Technology Market Volume K Unit Forecast, by Country 2019 & 2032
- Table 15: Global Process Analytical Technology Market Revenue Million Forecast, by Country 2019 & 2032
- Table 16: Global Process Analytical Technology Market Volume K Unit Forecast, by Country 2019 & 2032
- Table 17: Global Process Analytical Technology Market Revenue Million Forecast, by Country 2019 & 2032
- Table 18: Global Process Analytical Technology Market Volume K Unit Forecast, by Country 2019 & 2032
- Table 19: Global Process Analytical Technology Market Revenue Million Forecast, by Country 2019 & 2032
- Table 20: Global Process Analytical Technology Market Volume K Unit Forecast, by Country 2019 & 2032
- Table 21: Global Process Analytical Technology Market Revenue Million Forecast, by Type 2019 & 2032
- Table 22: Global Process Analytical Technology Market Volume K Unit Forecast, by Type 2019 & 2032
- Table 23: Global Process Analytical Technology Market Revenue Million Forecast, by End-user Industry 2019 & 2032
- Table 24: Global Process Analytical Technology Market Volume K Unit Forecast, by End-user Industry 2019 & 2032
- Table 25: Global Process Analytical Technology Market Revenue Million Forecast, by Country 2019 & 2032
- Table 26: Global Process Analytical Technology Market Volume K Unit Forecast, by Country 2019 & 2032
- Table 27: Global Process Analytical Technology Market Revenue Million Forecast, by Type 2019 & 2032
- Table 28: Global Process Analytical Technology Market Volume K Unit Forecast, by Type 2019 & 2032
- Table 29: Global Process Analytical Technology Market Revenue Million Forecast, by End-user Industry 2019 & 2032
- Table 30: Global Process Analytical Technology Market Volume K Unit Forecast, by End-user Industry 2019 & 2032
- Table 31: Global Process Analytical Technology Market Revenue Million Forecast, by Country 2019 & 2032
- Table 32: Global Process Analytical Technology Market Volume K Unit Forecast, by Country 2019 & 2032
- Table 33: Global Process Analytical Technology Market Revenue Million Forecast, by Type 2019 & 2032
- Table 34: Global Process Analytical Technology Market Volume K Unit Forecast, by Type 2019 & 2032
- Table 35: Global Process Analytical Technology Market Revenue Million Forecast, by End-user Industry 2019 & 2032
- Table 36: Global Process Analytical Technology Market Volume K Unit Forecast, by End-user Industry 2019 & 2032
- Table 37: Global Process Analytical Technology Market Revenue Million Forecast, by Country 2019 & 2032
- Table 38: Global Process Analytical Technology Market Volume K Unit Forecast, by Country 2019 & 2032
- Table 39: Global Process Analytical Technology Market Revenue Million Forecast, by Type 2019 & 2032
- Table 40: Global Process Analytical Technology Market Volume K Unit Forecast, by Type 2019 & 2032
- Table 41: Global Process Analytical Technology Market Revenue Million Forecast, by End-user Industry 2019 & 2032
- Table 42: Global Process Analytical Technology Market Volume K Unit Forecast, by End-user Industry 2019 & 2032
- Table 43: Global Process Analytical Technology Market Revenue Million Forecast, by Country 2019 & 2032
- Table 44: Global Process Analytical Technology Market Volume K Unit Forecast, by Country 2019 & 2032
Frequently Asked Questions
1. What is the projected Compound Annual Growth Rate (CAGR) of the Process Analytical Technology Market?
The projected CAGR is approximately 7.61%.
2. Which companies are prominent players in the Process Analytical Technology Market?
Key companies in the market include ABB Ltd, Horiba Ltd, Endress & Hauser AG, Focused Photonics Inc, SICK AG, Emerson Electric Co, Siemens AG, Schneider Electric SE, MKS Instruments Inc, Mettler Toledo, Hach Company, Neo Monitors AS, Bruker Corporation, ServomexGroup Limited, Extrel CMS LLC.
3. What are the main segments of the Process Analytical Technology Market?
The market segments include Type, End-user Industry.
4. Can you provide details about the market size?
The market size is estimated to be USD 5.67 Million as of 2022.
5. What are some drivers contributing to market growth?
Introduction of High-efficient Motors; Increasing Adoption of Power Management and Predictive Maintenance Solutions.
6. What are the notable trends driving market growth?
Pharmaceutical and Biotechnology is Observing a Significant Growth.
7. Are there any restraints impacting market growth?
; High Initial Infrastructure Expenditure.
8. Can you provide examples of recent developments in the market?
August 2023: Rentschler Biopharma announced a collaboration with Refeyn and Cell and Gene Therapy Catapult (CGT Catapult). This collaboration aims to leverage cutting-edge process analytical technologies (PAT) to enhance the manufacturing efficiency of adeno-associated viruses (AAVs) in gene therapy production. The partners aim to create a digitized and automated AAV gene therapy manufacturing platform. The companies will use their collective expertise in manufacturing, process analytics, and PAT to design automated monitoring and control systems tailored for integration into Rentschler Biopharma's current AAV manufacturing workflow.
9. What pricing options are available for accessing the report?
Pricing options include single-user, multi-user, and enterprise licenses priced at USD 4750, USD 5250, and USD 8750 respectively.
10. Is the market size provided in terms of value or volume?
The market size is provided in terms of value, measured in Million and volume, measured in K Unit.
11. Are there any specific market keywords associated with the report?
Yes, the market keyword associated with the report is "Process Analytical Technology Market," which aids in identifying and referencing the specific market segment covered.
12. How do I determine which pricing option suits my needs best?
The pricing options vary based on user requirements and access needs. Individual users may opt for single-user licenses, while businesses requiring broader access may choose multi-user or enterprise licenses for cost-effective access to the report.
13. Are there any additional resources or data provided in the Process Analytical Technology Market report?
While the report offers comprehensive insights, it's advisable to review the specific contents or supplementary materials provided to ascertain if additional resources or data are available.
14. How can I stay updated on further developments or reports in the Process Analytical Technology Market?
To stay informed about further developments, trends, and reports in the Process Analytical Technology Market, consider subscribing to industry newsletters, following relevant companies and organizations, or regularly checking reputable industry news sources and publications.
Methodology
Step 1 - Identification of Relevant Samples Size from Population Database


Step 2 - Approaches for Defining Global Market Size (Value, Volume* & Price*)

Note*: In applicable scenarios
Step 3 - Data Sources
Primary Research
- Web Analytics
- Survey Reports
- Research Institute
- Latest Research Reports
- Opinion Leaders
Secondary Research
- Annual Reports
- White Paper
- Latest Press Release
- Industry Association
- Paid Database
- Investor Presentations

Step 4 - Data Triangulation
Involves using different sources of information in order to increase the validity of a study
These sources are likely to be stakeholders in a program - participants, other researchers, program staff, other community members, and so on.
Then we put all data in single framework & apply various statistical tools to find out the dynamic on the market.
During the analysis stage, feedback from the stakeholder groups would be compared to determine areas of agreement as well as areas of divergence
