

Key Insights
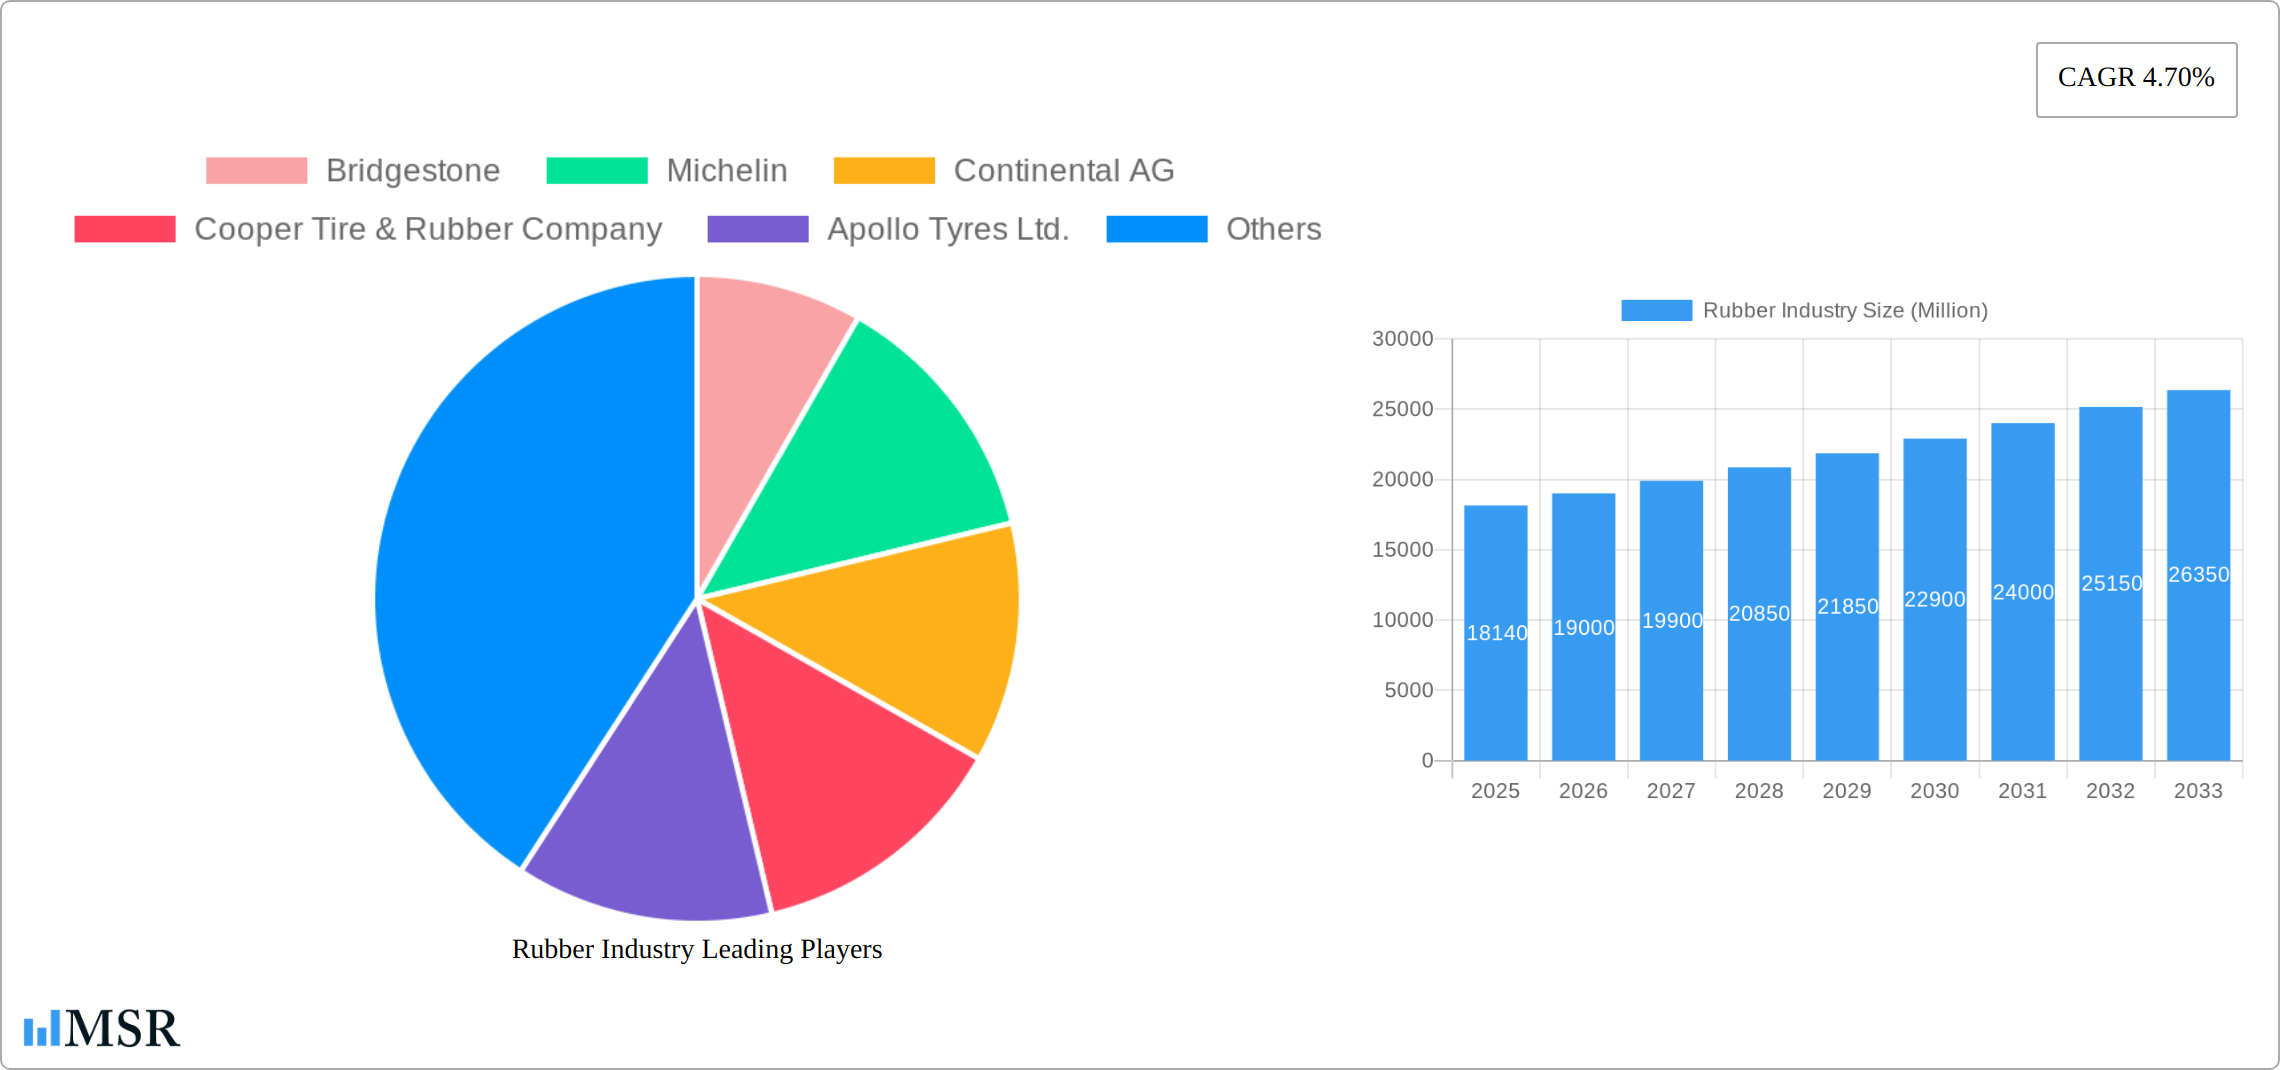
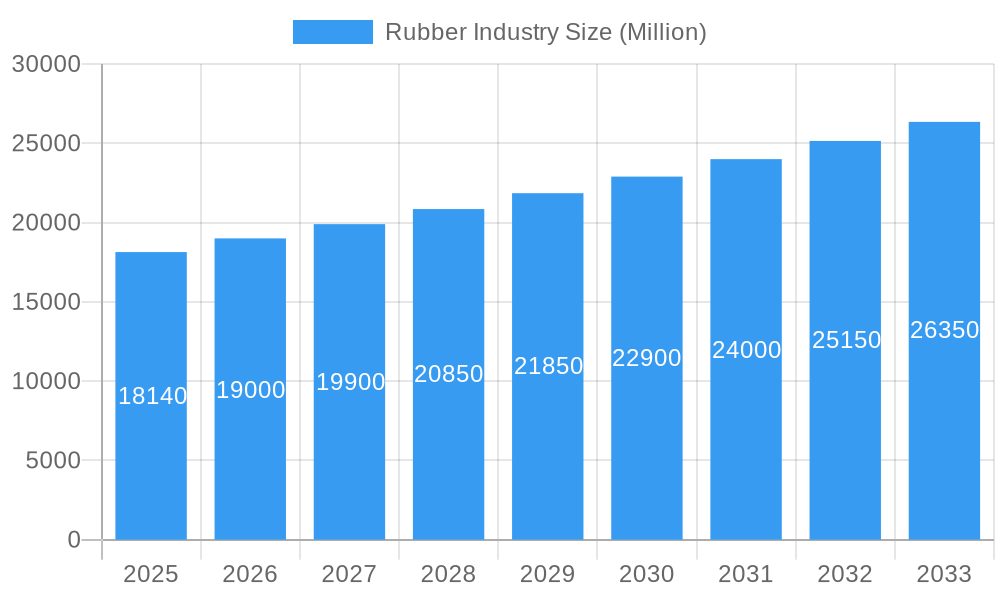
The global rubber industry, valued at $18.14 billion in 2025, is projected to experience steady growth, driven by a compound annual growth rate (CAGR) of 4.70% from 2025 to 2033. This expansion is fueled by several key factors. The automotive sector, a major consumer of rubber for tires and other components, is experiencing continuous growth, particularly in emerging economies. The increasing demand for durable and high-performance tires, coupled with advancements in tire technology (such as run-flat tires and improved fuel efficiency), are significant drivers. Furthermore, the industrial sector's reliance on rubber for various applications, including conveyor belts, hoses, and seals, contributes substantially to market demand. Growth in construction and manufacturing adds further impetus, particularly in regions experiencing rapid infrastructure development. The medical sector, utilizing rubber in diverse applications from gloves to medical devices, presents a niche but steadily growing market segment. While supply chain disruptions and fluctuations in raw material prices pose potential restraints, technological advancements in rubber production and the development of sustainable and eco-friendly rubber alternatives are expected to mitigate these challenges. The market segmentation reveals a diverse landscape, with natural rubber, synthetic rubber, and specialty rubbers catering to various applications across different end-user industries and distribution channels.
Rubber Industry Market Size (In Billion)
The competitive landscape is characterized by a mix of established global players and regional manufacturers. Leading companies like Bridgestone, Michelin, and Goodyear maintain significant market share through their extensive product portfolios and global distribution networks. However, increasing competition from regional players and the emergence of innovative rubber technologies are shaping the market dynamics. Regional variations in growth are expected, with Asia-Pacific, particularly China and India, projected to be significant growth markets due to burgeoning automotive and industrial sectors. North America and Europe, while exhibiting mature markets, will also continue to contribute to the overall market expansion. The forecast period (2025-2033) anticipates continued growth, albeit at a potentially moderated pace due to factors such as economic fluctuations and geopolitical instability. However, long-term prospects remain positive, driven by consistent demand across diverse sectors and ongoing innovation within the rubber industry.
Rubber Industry Company Market Share
Rubber Industry Market Report: 2019-2033 Forecast
A comprehensive analysis of the global rubber industry, encompassing market size, segmentation, key players, and future trends. This report provides actionable insights for stakeholders across the natural rubber, synthetic rubber, and specialty rubber sectors, covering the period from 2019 to 2033. The study encompasses a detailed analysis of the global rubber market, focusing on key players like Bridgestone, Michelin, and Goodyear, and examining the impact of technological advancements and evolving consumer preferences. This in-depth report examines the market dynamics, growth drivers, and potential challenges, providing a valuable resource for strategic decision-making.
Rubber Industry Market Concentration & Dynamics
The global rubber industry, valued at $XX Million in 2024, is characterized by a moderately concentrated market structure. Key players such as Bridgestone, Michelin, and Goodyear hold significant market share, reflecting their established brand presence and extensive global reach. However, the industry is also witnessing increased competition from emerging players, particularly in the specialty rubber segment.
Market Share (Estimated 2025):
- Bridgestone: XX%
- Michelin: XX%
- Goodyear: XX%
- Continental AG: XX%
- Other: XX%
Innovation Ecosystem: Significant investments in R&D are driving innovation in materials science, resulting in the development of high-performance rubbers with improved durability, sustainability, and enhanced properties for specific applications.
Regulatory Frameworks: Environmental regulations, particularly concerning the disposal of rubber waste and the use of hazardous chemicals, are influencing industry practices and driving the adoption of sustainable production methods.
Substitute Products: The increasing use of alternative materials, such as plastics and composites, presents a challenge to the rubber industry. However, the unique properties of rubber, such as elasticity and resilience, continue to secure its position in many applications.
End-User Trends: The growing demand for lightweight and fuel-efficient vehicles in the automotive industry is driving the demand for advanced rubber compounds.
M&A Activities: The past five years have witnessed a moderate number of mergers and acquisitions (M&A) deals in the rubber industry, primarily focused on expanding geographical reach and product portfolios. An estimated xx M&A deals occurred between 2019 and 2024.
Rubber Industry Industry Insights & Trends
The global rubber market is projected to experience substantial growth, with a CAGR of XX% during the forecast period (2025-2033), reaching an estimated value of $XX Million by 2033. This growth is primarily driven by several factors:
- Expanding Automotive Sector: The global automotive industry's growth, particularly in emerging markets, fuels demand for tires and other rubber components.
- Infrastructure Development: Ongoing infrastructure projects worldwide, including road construction and industrial development, are significant drivers of rubber demand.
- Technological Advancements: Innovations in rubber compounding and processing technologies are leading to the development of high-performance materials with improved properties.
- Growing Consumer Goods Market: The increasing demand for consumer goods, including footwear, sporting goods, and household items, contributes to rubber consumption.
Key Markets & Segments Leading Rubber Industry
Dominant Region: Asia-Pacific is expected to remain the dominant region, driven by robust economic growth, expanding industrialization, and a large automotive market.
Leading Segments:
- Product Type: Synthetic rubber is projected to dominate due to its versatility and cost-effectiveness, with a market share of XX% in 2025.
- Application: The automotive industry is the largest consumer of rubber, accounting for approximately XX% of the total market in 2025.
- Distribution Channel: Distributors hold a significant market share due to their extensive distribution network, facilitating access to diverse customer segments.
- End User: The automotive industry is the largest end-user, followed by the manufacturing and construction sectors.
Drivers for Leading Segments:
- Automotive: Strong growth in vehicle production, especially in emerging markets.
- Synthetic Rubber: Cost advantages and versatility compared to natural rubber.
- Asia-Pacific: Rapid economic growth, expanding infrastructure development, and burgeoning automotive sector.
Rubber Industry Product Developments
Recent product innovations focus on developing sustainable and high-performance rubber compounds. This includes the use of bio-based materials, recycled rubber, and advanced polymer technologies to create lighter, stronger, and more durable products. These advancements enhance fuel efficiency in vehicles, improve the lifespan of products, and reduce the environmental impact of rubber production. Companies are also focusing on developing specialized rubber compounds tailored to specific applications, such as high-temperature resistance for aerospace components or enhanced biocompatibility for medical devices.
Challenges in the Rubber Industry Market
The rubber industry faces several ongoing challenges, including volatility in raw material prices (particularly natural rubber), intensifying competition from alternative materials (such as plastics and composites), and increasingly stringent environmental regulations concerning production and waste management. Supply chain disruptions, exacerbated by geopolitical instability and global events, can significantly impact production and profitability. The inherent vulnerability of natural rubber prices to weather patterns and global supply issues presents a considerable risk, leading to price volatility and market unpredictability. Furthermore, the industry must adapt to growing concerns about sustainability and circularity.
Forces Driving Rubber Industry Growth
Technological advancements, particularly in materials science and manufacturing processes, are a significant driver of growth. The increasing adoption of sustainable practices and the development of eco-friendly rubber compounds also contribute to industry expansion. Government initiatives promoting infrastructure development and automotive production further stimulate demand.
Long-Term Growth Catalysts
Long-term growth is fueled by continued innovation in materials science, leading to the development of high-performance and sustainable rubber products. Strategic partnerships and collaborations across the value chain will also play a crucial role in driving market expansion. Investment in advanced manufacturing technologies, including automation and robotics, is expected to further enhance efficiency and output.
Emerging Opportunities in Rubber Industry
Emerging opportunities lie in the development of specialized rubber compounds for niche applications in sectors such as healthcare, aerospace, and renewable energy. The growing demand for sustainable and eco-friendly rubber products presents a significant opportunity for companies that can effectively address environmental concerns. Further expansion into developing markets with growing infrastructure and automotive sectors offers substantial growth potential.
Leading Players in the Rubber Industry Sector
Key Milestones in Rubber Industry Industry
- 2020: Increased focus on sustainable rubber production and recycling initiatives.
- 2021: Significant investments in R&D for developing high-performance rubber compounds.
- 2022: Several key mergers and acquisitions aimed at expanding market reach and product portfolios.
- 2023: Launch of several new tire models incorporating advanced technologies.
- 2024: Growing adoption of digital technologies in rubber manufacturing and supply chain management.
Strategic Outlook for Rubber Industry Market
The rubber industry is poised for continued growth, driven by technological advancements, expanding end-use sectors, and increasing demand for sustainable products. Strategic partnerships, investments in R&D, and a focus on meeting evolving consumer demands will be crucial for companies to secure a competitive advantage and capitalize on future opportunities. The long-term outlook remains positive, with significant potential for market expansion in both developed and developing economies.
Rubber Industry Segmentation
- 1. Production Analysis
- 2. Consumption Analysis
- 3. Import Market Analysis (Value & Volume)
- 4. Export Market Analysis (Value & Volume)
- 5. Price Trend Analysis
Rubber Industry Segmentation By Geography
-
1. North America
- 1.1. United States
- 1.2. Mexico
-
2. Europe
- 2.1. Germany
- 2.2. France
- 2.3. Italy
- 2.4. Turkey
-
3. Asia Pacific
- 3.1. China
- 3.2. Malaysia
- 3.3. Thailand
- 3.4. Japan
- 3.5. India
- 3.6. Indonesia
-
4. South America
- 4.1. Brazil
- 4.2. Chile
-
5. Africa
- 5.1. South Africa
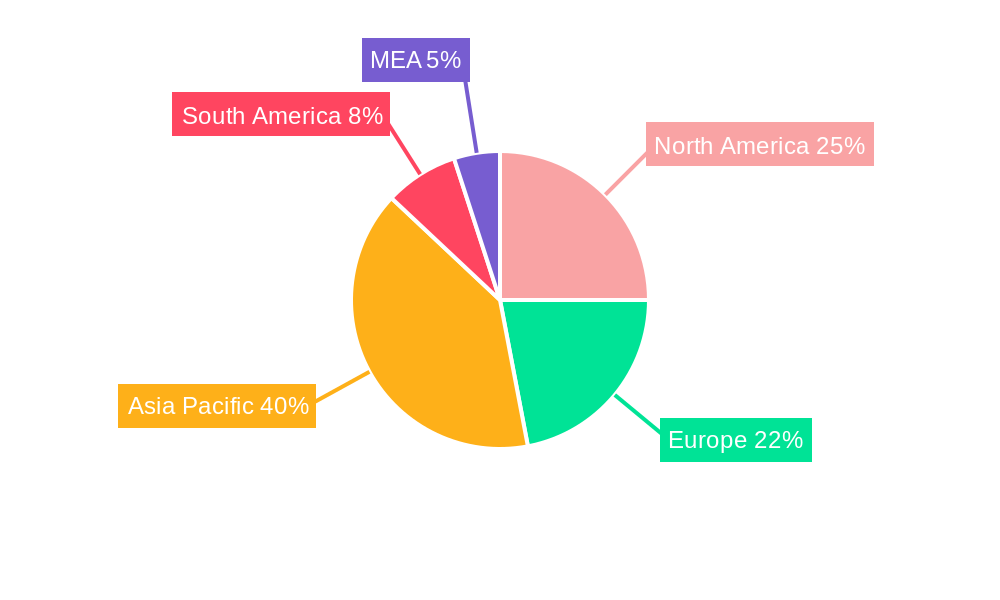
Rubber Industry Regional Market Share
Geographic Coverage of Rubber Industry
Rubber Industry REPORT HIGHLIGHTS
| Aspects | Details |
|---|---|
| Study Period | 2020-2034 |
| Base Year | 2025 |
| Estimated Year | 2026 |
| Forecast Period | 2026-2034 |
| Historical Period | 2020-2025 |
| Growth Rate | CAGR of 4.70% from 2020-2034 |
| Segmentation |
|
Table of Contents
- 1. Introduction
- 1.1. Research Scope
- 1.2. Market Segmentation
- 1.3. Research Objective
- 1.4. Definitions and Assumptions
- 2. Executive Summary
- 2.1. Market Snapshot
- 3. Market Dynamics
- 3.1. Market Drivers
- 3.2. Market Restrains
- 3.3. Market Trends
- 3.4. Market Opportunities
- 4. Market Factor Analysis
- 4.1. Porters Five Forces
- 4.1.1. Bargaining Power of Suppliers
- 4.1.2. Bargaining Power of Buyers
- 4.1.3. Threat of New Entrants
- 4.1.4. Threat of Substitutes
- 4.1.5. Competitive Rivalry
- 4.2. PESTEL analysis
- 4.3. BCG Analysis
- 4.3.1. Stars (High Growth, High Market Share)
- 4.3.2. Cash Cows (Low Growth, High Market Share)
- 4.3.3. Question Mark (High Growth, Low Market Share)
- 4.3.4. Dogs (Low Growth, Low Market Share)
- 4.4. Ansoff Matrix Analysis
- 4.5. Supply Chain Analysis
- 4.6. Regulatory Landscape
- 4.7. Current Market Potential and Opportunity Assessment (TAM–SAM–SOM Framework)
- 4.8. MSR Analyst Note
- 4.1. Porters Five Forces
- 5. Market Analysis, Insights and Forecast 2021-2033
- 5.1. Market Analysis, Insights and Forecast - by Production Analysis
- 5.2. Market Analysis, Insights and Forecast - by Consumption Analysis
- 5.3. Market Analysis, Insights and Forecast - by Import Market Analysis (Value & Volume)
- 5.4. Market Analysis, Insights and Forecast - by Export Market Analysis (Value & Volume)
- 5.5. Market Analysis, Insights and Forecast - by Price Trend Analysis
- 5.6. Market Analysis, Insights and Forecast - by Region
- 5.6.1. North America
- 5.6.2. Europe
- 5.6.3. Asia Pacific
- 5.6.4. South America
- 5.6.5. Africa
- 6. Global Rubber Industry Analysis, Insights and Forecast, 2021-2033
- 6.1. Market Analysis, Insights and Forecast - by Production Analysis
- 6.2. Market Analysis, Insights and Forecast - by Consumption Analysis
- 6.3. Market Analysis, Insights and Forecast - by Import Market Analysis (Value & Volume)
- 6.4. Market Analysis, Insights and Forecast - by Export Market Analysis (Value & Volume)
- 6.5. Market Analysis, Insights and Forecast - by Price Trend Analysis
- 7. North America Rubber Industry Analysis, Insights and Forecast, 2020-2032
- 7.1. Market Analysis, Insights and Forecast - by Production Analysis
- 7.2. Market Analysis, Insights and Forecast - by Consumption Analysis
- 7.3. Market Analysis, Insights and Forecast - by Import Market Analysis (Value & Volume)
- 7.4. Market Analysis, Insights and Forecast - by Export Market Analysis (Value & Volume)
- 7.5. Market Analysis, Insights and Forecast - by Price Trend Analysis
- 8. Europe Rubber Industry Analysis, Insights and Forecast, 2020-2032
- 8.1. Market Analysis, Insights and Forecast - by Production Analysis
- 8.2. Market Analysis, Insights and Forecast - by Consumption Analysis
- 8.3. Market Analysis, Insights and Forecast - by Import Market Analysis (Value & Volume)
- 8.4. Market Analysis, Insights and Forecast - by Export Market Analysis (Value & Volume)
- 8.5. Market Analysis, Insights and Forecast - by Price Trend Analysis
- 9. Asia Pacific Rubber Industry Analysis, Insights and Forecast, 2020-2032
- 9.1. Market Analysis, Insights and Forecast - by Production Analysis
- 9.2. Market Analysis, Insights and Forecast - by Consumption Analysis
- 9.3. Market Analysis, Insights and Forecast - by Import Market Analysis (Value & Volume)
- 9.4. Market Analysis, Insights and Forecast - by Export Market Analysis (Value & Volume)
- 9.5. Market Analysis, Insights and Forecast - by Price Trend Analysis
- 10. South America Rubber Industry Analysis, Insights and Forecast, 2020-2032
- 10.1. Market Analysis, Insights and Forecast - by Production Analysis
- 10.2. Market Analysis, Insights and Forecast - by Consumption Analysis
- 10.3. Market Analysis, Insights and Forecast - by Import Market Analysis (Value & Volume)
- 10.4. Market Analysis, Insights and Forecast - by Export Market Analysis (Value & Volume)
- 10.5. Market Analysis, Insights and Forecast - by Price Trend Analysis
- 11. Africa Rubber Industry Analysis, Insights and Forecast, 2020-2032
- 11.1. Market Analysis, Insights and Forecast - by Production Analysis
- 11.2. Market Analysis, Insights and Forecast - by Consumption Analysis
- 11.3. Market Analysis, Insights and Forecast - by Import Market Analysis (Value & Volume)
- 11.4. Market Analysis, Insights and Forecast - by Export Market Analysis (Value & Volume)
- 11.5. Market Analysis, Insights and Forecast - by Price Trend Analysis
- 12. Competitive Analysis
- 12.1. Company Profiles
- 12.1.1 Bridgestone
- 12.1.1.1. Company Overview
- 12.1.1.2. Products
- 12.1.1.3. Company Financials
- 12.1.1.4. SWOT Analysis
- 12.1.2 Michelin
- 12.1.2.1. Company Overview
- 12.1.2.2. Products
- 12.1.2.3. Company Financials
- 12.1.2.4. SWOT Analysis
- 12.1.3 Continental AG
- 12.1.3.1. Company Overview
- 12.1.3.2. Products
- 12.1.3.3. Company Financials
- 12.1.3.4. SWOT Analysis
- 12.1.4 Cooper Tire & Rubber Company
- 12.1.4.1. Company Overview
- 12.1.4.2. Products
- 12.1.4.3. Company Financials
- 12.1.4.4. SWOT Analysis
- 12.1.5 Apollo Tyres Ltd.
- 12.1.5.1. Company Overview
- 12.1.5.2. Products
- 12.1.5.3. Company Financials
- 12.1.5.4. SWOT Analysis
- 12.1.6 Kumho Tire Co. Inc.
- 12.1.6.1. Company Overview
- 12.1.6.2. Products
- 12.1.6.3. Company Financials
- 12.1.6.4. SWOT Analysis
- 12.1.7 The Goodyear Tire & Rubber Company
- 12.1.7.1. Company Overview
- 12.1.7.2. Products
- 12.1.7.3. Company Financials
- 12.1.7.4. SWOT Analysis
- 12.1.8 Pirelli & C. S.p.A.
- 12.1.8.1. Company Overview
- 12.1.8.2. Products
- 12.1.8.3. Company Financials
- 12.1.8.4. SWOT Analysis
- 12.1.9 Sumitomo Rubber Industries Ltd.
- 12.1.9.1. Company Overview
- 12.1.9.2. Products
- 12.1.9.3. Company Financials
- 12.1.9.4. SWOT Analysis
- 12.1.10 Hankook Tire & Technology
- 12.1.10.1. Company Overview
- 12.1.10.2. Products
- 12.1.10.3. Company Financials
- 12.1.10.4. SWOT Analysis
- 12.1.1 Bridgestone
- 12.2. Market Entropy
- 12.2.1 Company's Key Areas Served
- 12.2.2 Recent Developments
- 12.3. Company Market Share Analysis 2025
- 12.3.1 Top 5 Companies Market Share Analysis
- 12.3.2 Top 3 Companies Market Share Analysis
- 12.4. List of Potential Customers
- 13. Research Methodology
List of Figures
- Figure 1: Global Rubber Industry Revenue Breakdown (Million, %) by Region 2025 & 2033
- Figure 2: North America Rubber Industry Revenue (Million), by Production Analysis 2025 & 2033
- Figure 3: North America Rubber Industry Revenue Share (%), by Production Analysis 2025 & 2033
- Figure 4: North America Rubber Industry Revenue (Million), by Consumption Analysis 2025 & 2033
- Figure 5: North America Rubber Industry Revenue Share (%), by Consumption Analysis 2025 & 2033
- Figure 6: North America Rubber Industry Revenue (Million), by Import Market Analysis (Value & Volume) 2025 & 2033
- Figure 7: North America Rubber Industry Revenue Share (%), by Import Market Analysis (Value & Volume) 2025 & 2033
- Figure 8: North America Rubber Industry Revenue (Million), by Export Market Analysis (Value & Volume) 2025 & 2033
- Figure 9: North America Rubber Industry Revenue Share (%), by Export Market Analysis (Value & Volume) 2025 & 2033
- Figure 10: North America Rubber Industry Revenue (Million), by Price Trend Analysis 2025 & 2033
- Figure 11: North America Rubber Industry Revenue Share (%), by Price Trend Analysis 2025 & 2033
- Figure 12: North America Rubber Industry Revenue (Million), by Country 2025 & 2033
- Figure 13: North America Rubber Industry Revenue Share (%), by Country 2025 & 2033
- Figure 14: Europe Rubber Industry Revenue (Million), by Production Analysis 2025 & 2033
- Figure 15: Europe Rubber Industry Revenue Share (%), by Production Analysis 2025 & 2033
- Figure 16: Europe Rubber Industry Revenue (Million), by Consumption Analysis 2025 & 2033
- Figure 17: Europe Rubber Industry Revenue Share (%), by Consumption Analysis 2025 & 2033
- Figure 18: Europe Rubber Industry Revenue (Million), by Import Market Analysis (Value & Volume) 2025 & 2033
- Figure 19: Europe Rubber Industry Revenue Share (%), by Import Market Analysis (Value & Volume) 2025 & 2033
- Figure 20: Europe Rubber Industry Revenue (Million), by Export Market Analysis (Value & Volume) 2025 & 2033
- Figure 21: Europe Rubber Industry Revenue Share (%), by Export Market Analysis (Value & Volume) 2025 & 2033
- Figure 22: Europe Rubber Industry Revenue (Million), by Price Trend Analysis 2025 & 2033
- Figure 23: Europe Rubber Industry Revenue Share (%), by Price Trend Analysis 2025 & 2033
- Figure 24: Europe Rubber Industry Revenue (Million), by Country 2025 & 2033
- Figure 25: Europe Rubber Industry Revenue Share (%), by Country 2025 & 2033
- Figure 26: Asia Pacific Rubber Industry Revenue (Million), by Production Analysis 2025 & 2033
- Figure 27: Asia Pacific Rubber Industry Revenue Share (%), by Production Analysis 2025 & 2033
- Figure 28: Asia Pacific Rubber Industry Revenue (Million), by Consumption Analysis 2025 & 2033
- Figure 29: Asia Pacific Rubber Industry Revenue Share (%), by Consumption Analysis 2025 & 2033
- Figure 30: Asia Pacific Rubber Industry Revenue (Million), by Import Market Analysis (Value & Volume) 2025 & 2033
- Figure 31: Asia Pacific Rubber Industry Revenue Share (%), by Import Market Analysis (Value & Volume) 2025 & 2033
- Figure 32: Asia Pacific Rubber Industry Revenue (Million), by Export Market Analysis (Value & Volume) 2025 & 2033
- Figure 33: Asia Pacific Rubber Industry Revenue Share (%), by Export Market Analysis (Value & Volume) 2025 & 2033
- Figure 34: Asia Pacific Rubber Industry Revenue (Million), by Price Trend Analysis 2025 & 2033
- Figure 35: Asia Pacific Rubber Industry Revenue Share (%), by Price Trend Analysis 2025 & 2033
- Figure 36: Asia Pacific Rubber Industry Revenue (Million), by Country 2025 & 2033
- Figure 37: Asia Pacific Rubber Industry Revenue Share (%), by Country 2025 & 2033
- Figure 38: South America Rubber Industry Revenue (Million), by Production Analysis 2025 & 2033
- Figure 39: South America Rubber Industry Revenue Share (%), by Production Analysis 2025 & 2033
- Figure 40: South America Rubber Industry Revenue (Million), by Consumption Analysis 2025 & 2033
- Figure 41: South America Rubber Industry Revenue Share (%), by Consumption Analysis 2025 & 2033
- Figure 42: South America Rubber Industry Revenue (Million), by Import Market Analysis (Value & Volume) 2025 & 2033
- Figure 43: South America Rubber Industry Revenue Share (%), by Import Market Analysis (Value & Volume) 2025 & 2033
- Figure 44: South America Rubber Industry Revenue (Million), by Export Market Analysis (Value & Volume) 2025 & 2033
- Figure 45: South America Rubber Industry Revenue Share (%), by Export Market Analysis (Value & Volume) 2025 & 2033
- Figure 46: South America Rubber Industry Revenue (Million), by Price Trend Analysis 2025 & 2033
- Figure 47: South America Rubber Industry Revenue Share (%), by Price Trend Analysis 2025 & 2033
- Figure 48: South America Rubber Industry Revenue (Million), by Country 2025 & 2033
- Figure 49: South America Rubber Industry Revenue Share (%), by Country 2025 & 2033
- Figure 50: Africa Rubber Industry Revenue (Million), by Production Analysis 2025 & 2033
- Figure 51: Africa Rubber Industry Revenue Share (%), by Production Analysis 2025 & 2033
- Figure 52: Africa Rubber Industry Revenue (Million), by Consumption Analysis 2025 & 2033
- Figure 53: Africa Rubber Industry Revenue Share (%), by Consumption Analysis 2025 & 2033
- Figure 54: Africa Rubber Industry Revenue (Million), by Import Market Analysis (Value & Volume) 2025 & 2033
- Figure 55: Africa Rubber Industry Revenue Share (%), by Import Market Analysis (Value & Volume) 2025 & 2033
- Figure 56: Africa Rubber Industry Revenue (Million), by Export Market Analysis (Value & Volume) 2025 & 2033
- Figure 57: Africa Rubber Industry Revenue Share (%), by Export Market Analysis (Value & Volume) 2025 & 2033
- Figure 58: Africa Rubber Industry Revenue (Million), by Price Trend Analysis 2025 & 2033
- Figure 59: Africa Rubber Industry Revenue Share (%), by Price Trend Analysis 2025 & 2033
- Figure 60: Africa Rubber Industry Revenue (Million), by Country 2025 & 2033
- Figure 61: Africa Rubber Industry Revenue Share (%), by Country 2025 & 2033
List of Tables
- Table 1: Global Rubber Industry Revenue Million Forecast, by Production Analysis 2020 & 2033
- Table 2: Global Rubber Industry Revenue Million Forecast, by Consumption Analysis 2020 & 2033
- Table 3: Global Rubber Industry Revenue Million Forecast, by Import Market Analysis (Value & Volume) 2020 & 2033
- Table 4: Global Rubber Industry Revenue Million Forecast, by Export Market Analysis (Value & Volume) 2020 & 2033
- Table 5: Global Rubber Industry Revenue Million Forecast, by Price Trend Analysis 2020 & 2033
- Table 6: Global Rubber Industry Revenue Million Forecast, by Region 2020 & 2033
- Table 7: Global Rubber Industry Revenue Million Forecast, by Production Analysis 2020 & 2033
- Table 8: Global Rubber Industry Revenue Million Forecast, by Consumption Analysis 2020 & 2033
- Table 9: Global Rubber Industry Revenue Million Forecast, by Import Market Analysis (Value & Volume) 2020 & 2033
- Table 10: Global Rubber Industry Revenue Million Forecast, by Export Market Analysis (Value & Volume) 2020 & 2033
- Table 11: Global Rubber Industry Revenue Million Forecast, by Price Trend Analysis 2020 & 2033
- Table 12: Global Rubber Industry Revenue Million Forecast, by Country 2020 & 2033
- Table 13: United States Rubber Industry Revenue (Million) Forecast, by Application 2020 & 2033
- Table 14: Mexico Rubber Industry Revenue (Million) Forecast, by Application 2020 & 2033
- Table 15: Global Rubber Industry Revenue Million Forecast, by Production Analysis 2020 & 2033
- Table 16: Global Rubber Industry Revenue Million Forecast, by Consumption Analysis 2020 & 2033
- Table 17: Global Rubber Industry Revenue Million Forecast, by Import Market Analysis (Value & Volume) 2020 & 2033
- Table 18: Global Rubber Industry Revenue Million Forecast, by Export Market Analysis (Value & Volume) 2020 & 2033
- Table 19: Global Rubber Industry Revenue Million Forecast, by Price Trend Analysis 2020 & 2033
- Table 20: Global Rubber Industry Revenue Million Forecast, by Country 2020 & 2033
- Table 21: Germany Rubber Industry Revenue (Million) Forecast, by Application 2020 & 2033
- Table 22: France Rubber Industry Revenue (Million) Forecast, by Application 2020 & 2033
- Table 23: Italy Rubber Industry Revenue (Million) Forecast, by Application 2020 & 2033
- Table 24: Turkey Rubber Industry Revenue (Million) Forecast, by Application 2020 & 2033
- Table 25: Global Rubber Industry Revenue Million Forecast, by Production Analysis 2020 & 2033
- Table 26: Global Rubber Industry Revenue Million Forecast, by Consumption Analysis 2020 & 2033
- Table 27: Global Rubber Industry Revenue Million Forecast, by Import Market Analysis (Value & Volume) 2020 & 2033
- Table 28: Global Rubber Industry Revenue Million Forecast, by Export Market Analysis (Value & Volume) 2020 & 2033
- Table 29: Global Rubber Industry Revenue Million Forecast, by Price Trend Analysis 2020 & 2033
- Table 30: Global Rubber Industry Revenue Million Forecast, by Country 2020 & 2033
- Table 31: China Rubber Industry Revenue (Million) Forecast, by Application 2020 & 2033
- Table 32: Malaysia Rubber Industry Revenue (Million) Forecast, by Application 2020 & 2033
- Table 33: Thailand Rubber Industry Revenue (Million) Forecast, by Application 2020 & 2033
- Table 34: Japan Rubber Industry Revenue (Million) Forecast, by Application 2020 & 2033
- Table 35: India Rubber Industry Revenue (Million) Forecast, by Application 2020 & 2033
- Table 36: Indonesia Rubber Industry Revenue (Million) Forecast, by Application 2020 & 2033
- Table 37: Global Rubber Industry Revenue Million Forecast, by Production Analysis 2020 & 2033
- Table 38: Global Rubber Industry Revenue Million Forecast, by Consumption Analysis 2020 & 2033
- Table 39: Global Rubber Industry Revenue Million Forecast, by Import Market Analysis (Value & Volume) 2020 & 2033
- Table 40: Global Rubber Industry Revenue Million Forecast, by Export Market Analysis (Value & Volume) 2020 & 2033
- Table 41: Global Rubber Industry Revenue Million Forecast, by Price Trend Analysis 2020 & 2033
- Table 42: Global Rubber Industry Revenue Million Forecast, by Country 2020 & 2033
- Table 43: Brazil Rubber Industry Revenue (Million) Forecast, by Application 2020 & 2033
- Table 44: Chile Rubber Industry Revenue (Million) Forecast, by Application 2020 & 2033
- Table 45: Global Rubber Industry Revenue Million Forecast, by Production Analysis 2020 & 2033
- Table 46: Global Rubber Industry Revenue Million Forecast, by Consumption Analysis 2020 & 2033
- Table 47: Global Rubber Industry Revenue Million Forecast, by Import Market Analysis (Value & Volume) 2020 & 2033
- Table 48: Global Rubber Industry Revenue Million Forecast, by Export Market Analysis (Value & Volume) 2020 & 2033
- Table 49: Global Rubber Industry Revenue Million Forecast, by Price Trend Analysis 2020 & 2033
- Table 50: Global Rubber Industry Revenue Million Forecast, by Country 2020 & 2033
- Table 51: South Africa Rubber Industry Revenue (Million) Forecast, by Application 2020 & 2033
Frequently Asked Questions
1. What is the projected Compound Annual Growth Rate (CAGR) of the Rubber Industry?
The projected CAGR is approximately 4.70%.
2. Which companies are prominent players in the Rubber Industry?
Key companies in the market include Bridgestone , Michelin , Continental AG , Cooper Tire & Rubber Company , Apollo Tyres Ltd. , Kumho Tire Co., Inc., The Goodyear Tire & Rubber Company , Pirelli & C. S.p.A. , Sumitomo Rubber Industries, Ltd. , Hankook Tire & Technology.
3. What are the main segments of the Rubber Industry?
The market segments include Production Analysis, Consumption Analysis, Import Market Analysis (Value & Volume), Export Market Analysis (Value & Volume), Price Trend Analysis.
4. Can you provide details about the market size?
The market size is estimated to be USD 18.14 Million as of 2022.
5. What are some drivers contributing to market growth?
Increasing Berry Consumption for Health Benefits; Increasing Adoption of High-Technology Farm Practices; Growing Usage of Berries in the Food and Beverage Industries.
6. What are the notable trends driving market growth?
Increasing demand from Various Industries.
7. Are there any restraints impacting market growth?
High Production Cost Involved in Berry Production; Increasing Disease and Pest Infestations.
8. Can you provide examples of recent developments in the market?
N/A
9. What pricing options are available for accessing the report?
Pricing options include single-user, multi-user, and enterprise licenses priced at USD 4750, USD 5250, and USD 8750 respectively.
10. Is the market size provided in terms of value or volume?
The market size is provided in terms of value, measured in Million.
11. Are there any specific market keywords associated with the report?
Yes, the market keyword associated with the report is "Rubber Industry," which aids in identifying and referencing the specific market segment covered.
12. How do I determine which pricing option suits my needs best?
The pricing options vary based on user requirements and access needs. Individual users may opt for single-user licenses, while businesses requiring broader access may choose multi-user or enterprise licenses for cost-effective access to the report.
13. Are there any additional resources or data provided in the Rubber Industry report?
While the report offers comprehensive insights, it's advisable to review the specific contents or supplementary materials provided to ascertain if additional resources or data are available.
14. How can I stay updated on further developments or reports in the Rubber Industry?
To stay informed about further developments, trends, and reports in the Rubber Industry, consider subscribing to industry newsletters, following relevant companies and organizations, or regularly checking reputable industry news sources and publications.
Methodology
Step 1 - Identification of Relevant Samples Size from Population Database


Step 2 - Approaches for Defining Global Market Size (Value, Volume* & Price*)

Note*: In applicable scenarios
Step 3 - Data Sources
Primary Research
- Web Analytics
- Survey Reports
- Research Institute
- Latest Research Reports
- Opinion Leaders
Secondary Research
- Annual Reports
- White Paper
- Latest Press Release
- Industry Association
- Paid Database
- Investor Presentations

Step 4 - Data Triangulation
Involves using different sources of information in order to increase the validity of a study
These sources are likely to be stakeholders in a program - participants, other researchers, program staff, other community members, and so on.
Then we put all data in single framework & apply various statistical tools to find out the dynamic on the market.
During the analysis stage, feedback from the stakeholder groups would be compared to determine areas of agreement as well as areas of divergence