

Key Insights
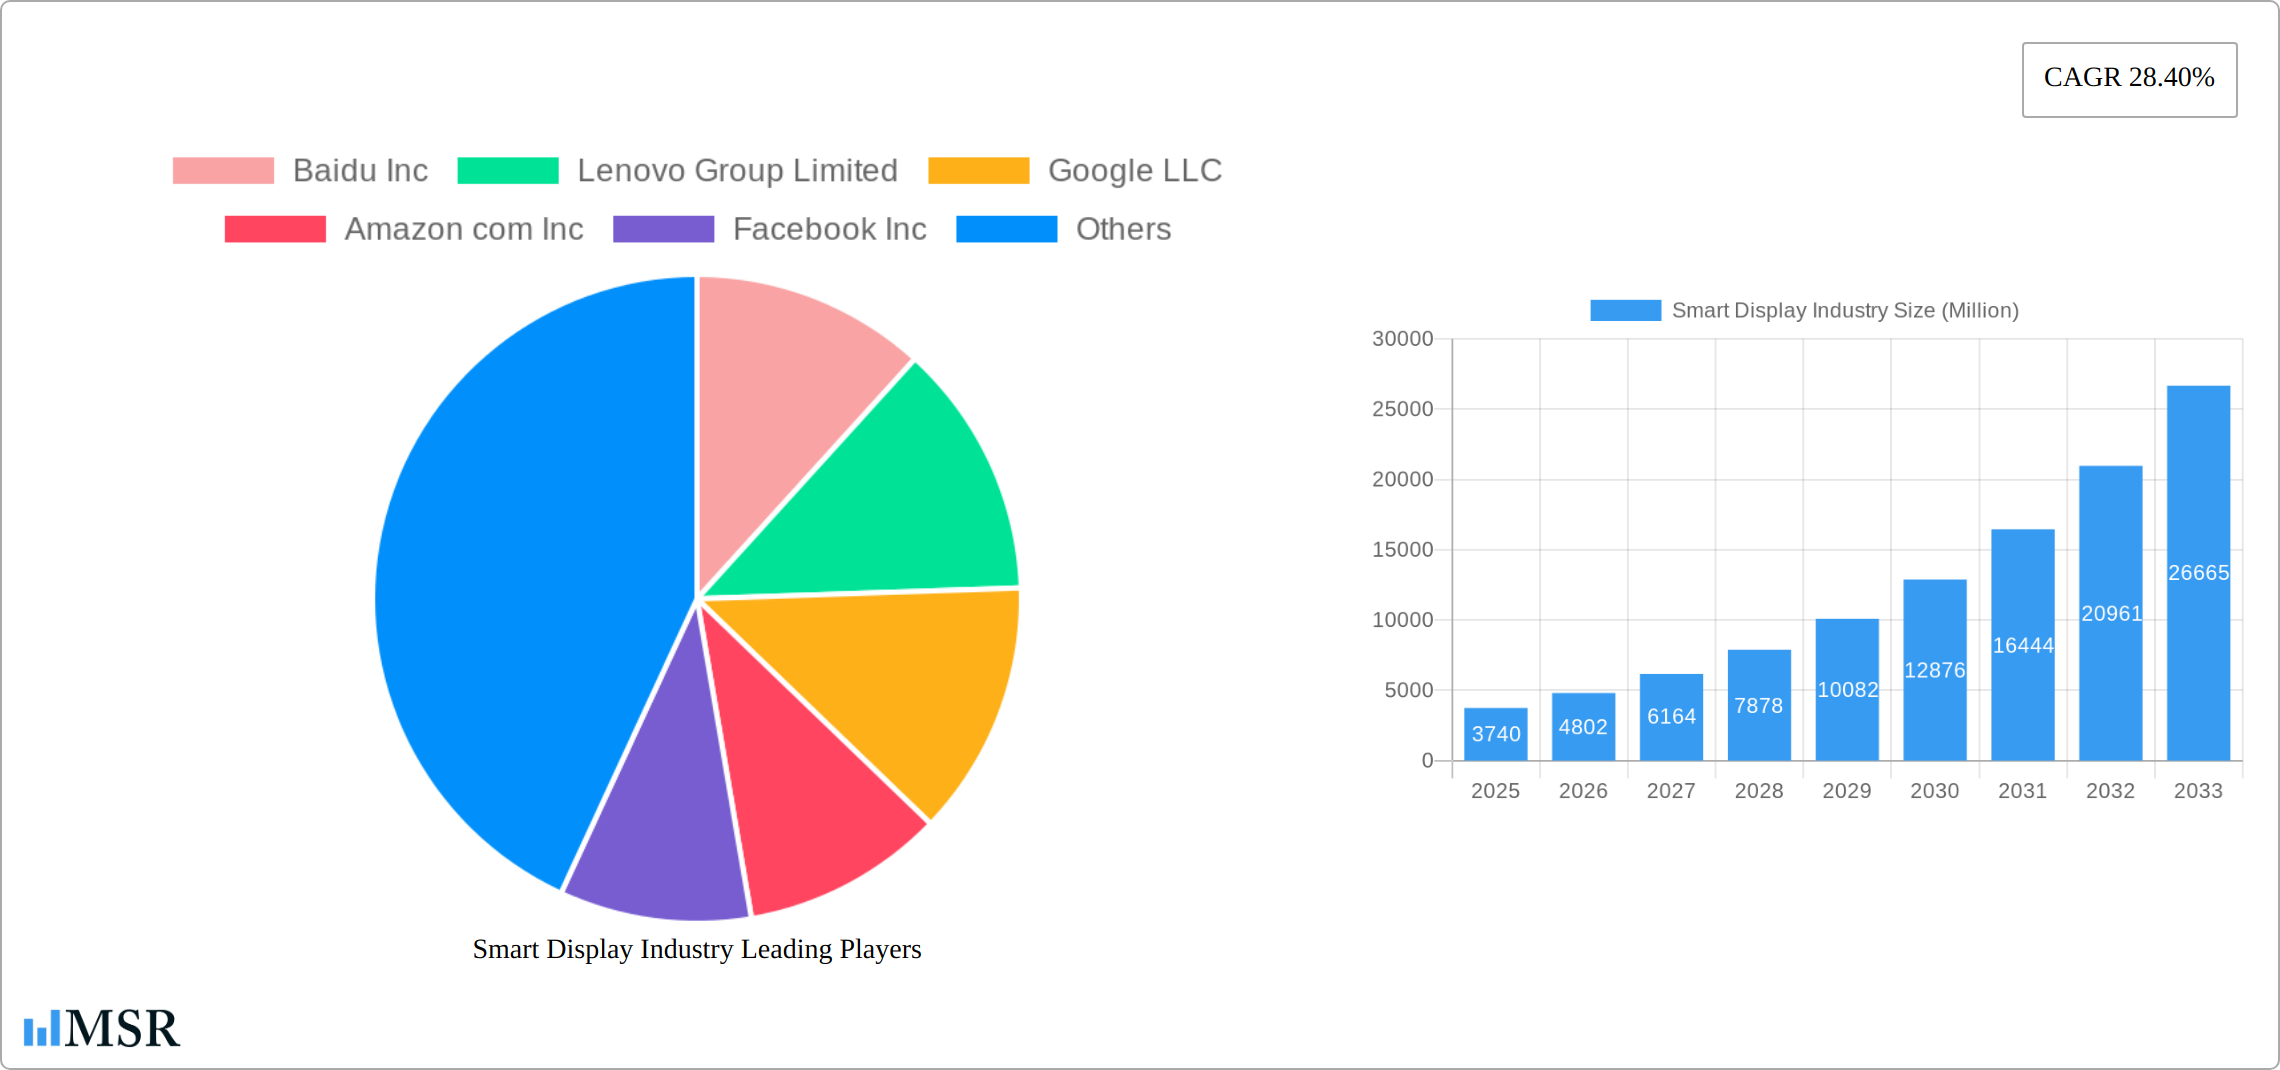
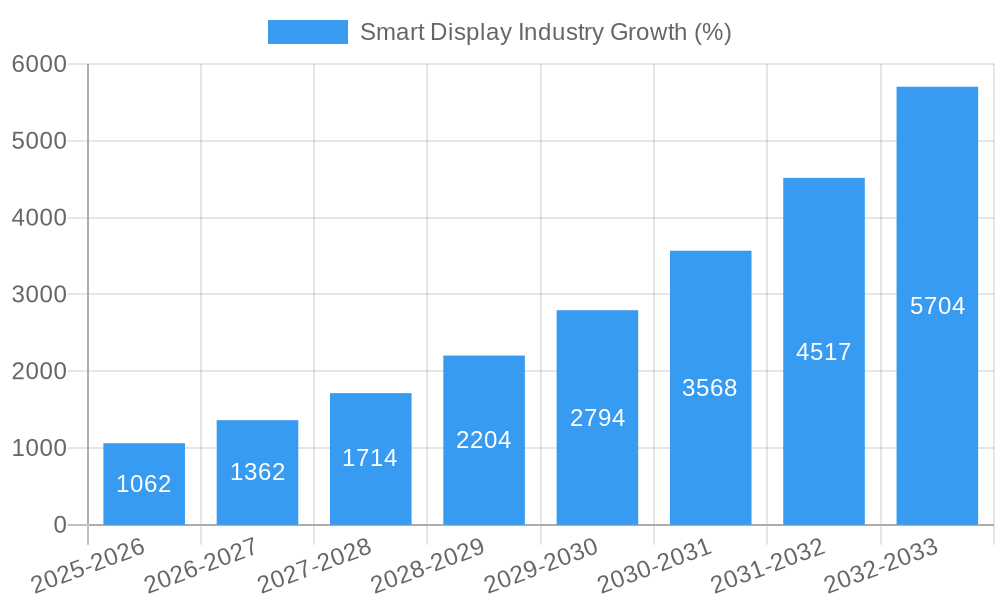
The smart display market, valued at $3.74 billion in 2025, is experiencing robust growth, projected to expand at a compound annual growth rate (CAGR) of 28.40% from 2025 to 2033. This surge is driven by several key factors. Increasing consumer adoption of smart home technology, fueled by the convenience and enhanced connectivity offered by smart displays, is a major driver. The integration of smart displays into various applications, including home automation, entertainment, and business communication, further contributes to market expansion. The continuous innovation in display technology, leading to improved screen quality, resolution, and functionalities like voice control and facial recognition, enhances user experience and boosts demand. Furthermore, the rising disposable incomes in developing economies and the increasing penetration of high-speed internet are creating fertile ground for market growth across regions. Competitive pricing strategies employed by leading players, like Amazon, Google, and Baidu, are also making smart displays more accessible to a wider consumer base.
However, several challenges restrain market growth. Concerns regarding data privacy and security associated with connected devices remain a significant hurdle. The relatively high initial cost of smart displays compared to traditional displays can deter some consumers, especially in price-sensitive markets. Moreover, the need for consistent internet connectivity for optimal functionality could limit adoption in areas with limited or unreliable internet access. Despite these challenges, the market's growth trajectory remains positive, driven by ongoing technological advancements, increasing affordability, and the expanding scope of applications in both residential and commercial sectors. Strategic partnerships and collaborations between technology giants and other businesses are expected to further fuel innovation and widen market penetration throughout the forecast period.
Smart Display Industry Market Report: 2019-2033
This comprehensive report provides an in-depth analysis of the global Smart Display industry, encompassing market size, growth drivers, key players, and future trends. The study period covers 2019-2033, with a focus on the forecast period (2025-2033), base year (2025), and estimated year (2025). The report offers actionable insights for industry stakeholders, investors, and businesses operating in this dynamic sector. The market is expected to reach xx Million by 2033, exhibiting a CAGR of xx% during the forecast period.
Smart Display Industry Market Concentration & Dynamics
The global smart display market exhibits a moderately concentrated landscape, with key players like Google LLC, Amazon com Inc, and Baidu Inc holding significant market share. However, the emergence of new players and innovative product offerings is fostering increased competition. The industry is characterized by a robust innovation ecosystem, driven by advancements in display technology, artificial intelligence (AI), and voice recognition. Regulatory frameworks, particularly concerning data privacy and security, are evolving and influencing market dynamics. Substitute products, such as traditional displays and mobile devices, continue to pose a challenge. End-user trends towards smart home automation and personalized experiences are fueling market growth.
- Market Share: Google LLC and Amazon com Inc. hold an estimated combined market share of 40% in 2025. Baidu Inc. holds approximately 15% share.
- M&A Activity: The historical period (2019-2024) witnessed approximately 50 M&A deals in the smart display industry, with a noticeable increase in activity in recent years reflecting consolidation and expansion strategies among players.
Smart Display Industry Industry Insights & Trends
The smart display market is experiencing significant growth, driven by increasing consumer adoption of smart home devices, advancements in AI and voice-assistant technologies, and the rising demand for personalized user experiences. The market size was valued at xx Million in 2024 and is projected to reach xx Million by 2033. This substantial growth is attributed to several factors: a rising middle class with increased disposable income, a growing preference for voice-controlled devices, and the integration of smart displays into various applications across residential, commercial, and industrial settings. Technological disruptions, like the introduction of advanced display technologies (e.g., micro OLED) and improved AI capabilities, continue to shape market trends. Evolving consumer behaviors, particularly the preference for seamless connectivity and intuitive user interfaces, are also major drivers.
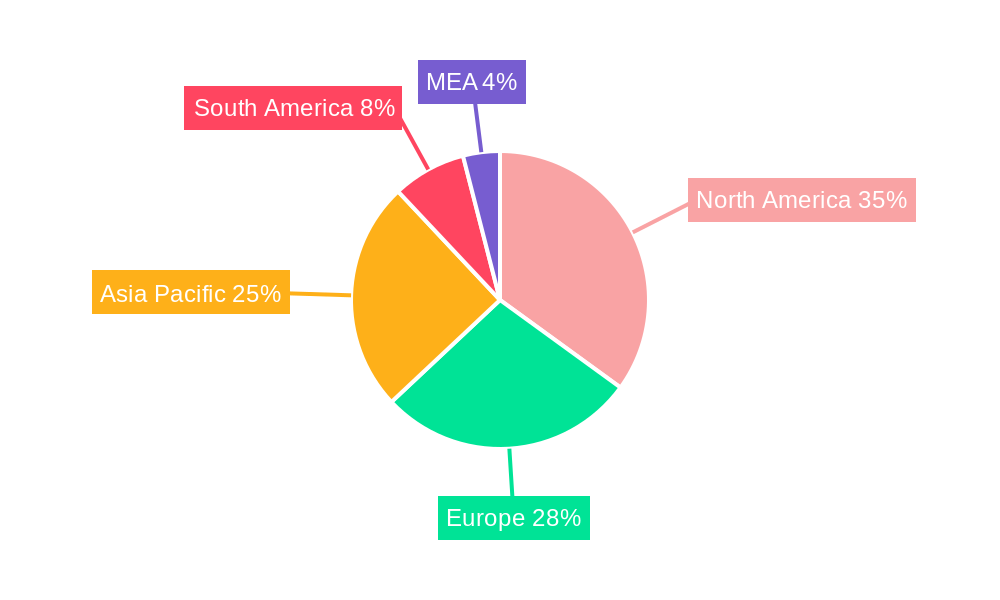
Key Markets & Segments Leading Smart Display Industry
The North American region dominates the smart display market, followed by Asia-Pacific. Within product types, smart home displays hold the largest market share, owing to their versatility and integration with other smart home devices. The home application segment currently leads, with significant potential for expansion into the business and industrial sectors.
- Drivers for North American Dominance: High disposable income, early adoption of smart home technology, and robust infrastructure.
- Drivers for Asia-Pacific Growth: Rapid urbanization, increasing smartphone penetration, and a growing middle class.
- Smart Home Displays: Dominant due to their versatility and integration capabilities.
- Home Application: Leading segment, but the business and industrial sectors present promising avenues for expansion.
Smart Display Industry Product Developments
Recent product innovations include advancements in display technology (higher resolution, larger screen sizes), enhanced voice assistant capabilities, and improved integration with smart home ecosystems. Key features driving market relevance are seamless connectivity, intuitive user interfaces, and sophisticated personalization options. The launch of Lenovo Glasses T1 and Google's second-generation Nest Hub exemplify this trend towards innovation and market expansion. Competition is driving companies to enhance their product offerings with features like improved sound quality, privacy controls, and expanded app ecosystems.
Challenges in the Smart Display Industry Market
The smart display industry faces challenges, including: stringent regulatory hurdles regarding data privacy, potential supply chain disruptions impacting component availability, and intense competition among established and emerging players. These factors can collectively lead to price volatility, delayed product launches, and reduced profit margins. Estimated quantitative impact on market growth is approximately 5-10%.
Forces Driving Smart Display Industry Growth
Key growth drivers include: advancements in AI and machine learning leading to more sophisticated voice assistants and personalized experiences, expanding consumer adoption of smart home devices, and increasing integration of smart displays in various applications, such as healthcare, education, and retail. Government initiatives promoting smart city development are also boosting market expansion.
Long-Term Growth Catalysts in the Smart Display Industry
Long-term growth will be fueled by continued innovation in display technologies, like micro-LED and flexible displays. Strategic partnerships between tech giants and smaller companies specializing in specific technologies will accelerate development. Expansion into new markets (e.g., developing economies in Africa and Latin America) will contribute to sustained growth.
Emerging Opportunities in Smart Display Industry
Emerging opportunities lie in the integration of smart displays with augmented reality (AR) and virtual reality (VR) technologies, the development of more energy-efficient displays, and expansion into niche markets, like healthcare and education. Customized smart display solutions for specific business needs also present considerable opportunities.
Leading Players in the Smart Display Industry Sector
- Baidu Inc
- Lenovo Group Limited
- Google LLC
- Amazon com Inc
- Facebook Inc
- JBL (Harman International)
- LG Electronics Inc
Key Milestones in Smart Display Industry Industry
- September 2022: Lenovo launched its first smart glasses, Lenovo Glasses T1 (also known as Lenovo Yoga Glasses in China), featuring two micro OLED displays, a USB-C port, and built-in speakers. This launch signaled an expansion into the wearable smart display market.
- January 2022: Google launched its second-generation Nest Hub in India, showcasing a floating glass display and improved Nest Audio technology, strengthening its presence in the smart display market.
Strategic Outlook for Smart Display Industry Market
The smart display market is poised for continued robust growth, driven by technological advancements and evolving consumer preferences. Strategic partnerships, expansion into new applications and geographies, and innovation in display technologies will be crucial for success. Companies focused on delivering seamless user experiences, enhanced privacy features, and cost-effective solutions will be well-positioned to capitalize on the market's long-term potential.
Smart Display Industry Segmentation
-
1. Product Type
- 1.1. Smart home displays
- 1.2. Smart speakers
- 1.3. Smart clocks
- 1.4. Smart glasses
-
2. Application
- 2.1. Home
- 2.2. Business
- 2.3. Industry
Smart Display Industry Segmentation By Geography
- 1. North America
- 2. Europe
- 3. Asia Pacific
- 4. Rest of the World
Smart Display Industry REPORT HIGHLIGHTS
| Aspects | Details |
|---|---|
| Study Period | 2019-2033 |
| Base Year | 2024 |
| Estimated Year | 2025 |
| Forecast Period | 2025-2033 |
| Historical Period | 2019-2024 |
| Growth Rate | CAGR of 28.40% from 2019-2033 |
| Segmentation |
|
Table of Contents
- 1. Introduction
- 1.1. Research Scope
- 1.2. Market Segmentation
- 1.3. Research Methodology
- 1.4. Definitions and Assumptions
- 2. Executive Summary
- 2.1. Introduction
- 3. Market Dynamics
- 3.1. Introduction
- 3.2. Market Drivers
- 3.2.1. Increasing Demand of Smart Home Devices
- 3.3. Market Restrains
- 3.3.1. High Cost and Limited Set of Vocabulary
- 3.4. Market Trends
- 3.4.1. Connected Device to Drive the Market Growth
- 4. Market Factor Analysis
- 4.1. Porters Five Forces
- 4.2. Supply/Value Chain
- 4.3. PESTEL analysis
- 4.4. Market Entropy
- 4.5. Patent/Trademark Analysis
- 5. Global Smart Display Industry Analysis, Insights and Forecast, 2019-2031
- 5.1. Market Analysis, Insights and Forecast - by Product Type
- 5.1.1. Smart home displays
- 5.1.2. Smart speakers
- 5.1.3. Smart clocks
- 5.1.4. Smart glasses
- 5.2. Market Analysis, Insights and Forecast - by Application
- 5.2.1. Home
- 5.2.2. Business
- 5.2.3. Industry
- 5.3. Market Analysis, Insights and Forecast - by Region
- 5.3.1. North America
- 5.3.2. Europe
- 5.3.3. Asia Pacific
- 5.3.4. Rest of the World
- 5.1. Market Analysis, Insights and Forecast - by Product Type
- 6. North America Smart Display Industry Analysis, Insights and Forecast, 2019-2031
- 6.1. Market Analysis, Insights and Forecast - by Product Type
- 6.1.1. Smart home displays
- 6.1.2. Smart speakers
- 6.1.3. Smart clocks
- 6.1.4. Smart glasses
- 6.2. Market Analysis, Insights and Forecast - by Application
- 6.2.1. Home
- 6.2.2. Business
- 6.2.3. Industry
- 6.1. Market Analysis, Insights and Forecast - by Product Type
- 7. Europe Smart Display Industry Analysis, Insights and Forecast, 2019-2031
- 7.1. Market Analysis, Insights and Forecast - by Product Type
- 7.1.1. Smart home displays
- 7.1.2. Smart speakers
- 7.1.3. Smart clocks
- 7.1.4. Smart glasses
- 7.2. Market Analysis, Insights and Forecast - by Application
- 7.2.1. Home
- 7.2.2. Business
- 7.2.3. Industry
- 7.1. Market Analysis, Insights and Forecast - by Product Type
- 8. Asia Pacific Smart Display Industry Analysis, Insights and Forecast, 2019-2031
- 8.1. Market Analysis, Insights and Forecast - by Product Type
- 8.1.1. Smart home displays
- 8.1.2. Smart speakers
- 8.1.3. Smart clocks
- 8.1.4. Smart glasses
- 8.2. Market Analysis, Insights and Forecast - by Application
- 8.2.1. Home
- 8.2.2. Business
- 8.2.3. Industry
- 8.1. Market Analysis, Insights and Forecast - by Product Type
- 9. Rest of the World Smart Display Industry Analysis, Insights and Forecast, 2019-2031
- 9.1. Market Analysis, Insights and Forecast - by Product Type
- 9.1.1. Smart home displays
- 9.1.2. Smart speakers
- 9.1.3. Smart clocks
- 9.1.4. Smart glasses
- 9.2. Market Analysis, Insights and Forecast - by Application
- 9.2.1. Home
- 9.2.2. Business
- 9.2.3. Industry
- 9.1. Market Analysis, Insights and Forecast - by Product Type
- 10. North America Smart Display Industry Analysis, Insights and Forecast, 2019-2031
- 10.1. Market Analysis, Insights and Forecast - By Country/Sub-region
- 10.1.1 United States
- 10.1.2 Canada
- 10.1.3 Mexico
- 11. Europe Smart Display Industry Analysis, Insights and Forecast, 2019-2031
- 11.1. Market Analysis, Insights and Forecast - By Country/Sub-region
- 11.1.1 Germany
- 11.1.2 United Kingdom
- 11.1.3 France
- 11.1.4 Spain
- 11.1.5 Italy
- 11.1.6 Spain
- 11.1.7 Belgium
- 11.1.8 Netherland
- 11.1.9 Nordics
- 11.1.10 Rest of Europe
- 12. Asia Pacific Smart Display Industry Analysis, Insights and Forecast, 2019-2031
- 12.1. Market Analysis, Insights and Forecast - By Country/Sub-region
- 12.1.1 China
- 12.1.2 Japan
- 12.1.3 India
- 12.1.4 South Korea
- 12.1.5 Southeast Asia
- 12.1.6 Australia
- 12.1.7 Indonesia
- 12.1.8 Phillipes
- 12.1.9 Singapore
- 12.1.10 Thailandc
- 12.1.11 Rest of Asia Pacific
- 13. South America Smart Display Industry Analysis, Insights and Forecast, 2019-2031
- 13.1. Market Analysis, Insights and Forecast - By Country/Sub-region
- 13.1.1 Brazil
- 13.1.2 Argentina
- 13.1.3 Peru
- 13.1.4 Chile
- 13.1.5 Colombia
- 13.1.6 Ecuador
- 13.1.7 Venezuela
- 13.1.8 Rest of South America
- 14. MEA Smart Display Industry Analysis, Insights and Forecast, 2019-2031
- 14.1. Market Analysis, Insights and Forecast - By Country/Sub-region
- 14.1.1 United Arab Emirates
- 14.1.2 Saudi Arabia
- 14.1.3 South Africa
- 14.1.4 Rest of Middle East and Africa
- 15. Competitive Analysis
- 15.1. Global Market Share Analysis 2024
- 15.2. Company Profiles
- 15.2.1 Baidu Inc
- 15.2.1.1. Overview
- 15.2.1.2. Products
- 15.2.1.3. SWOT Analysis
- 15.2.1.4. Recent Developments
- 15.2.1.5. Financials (Based on Availability)
- 15.2.2 Lenovo Group Limited
- 15.2.2.1. Overview
- 15.2.2.2. Products
- 15.2.2.3. SWOT Analysis
- 15.2.2.4. Recent Developments
- 15.2.2.5. Financials (Based on Availability)
- 15.2.3 Google LLC
- 15.2.3.1. Overview
- 15.2.3.2. Products
- 15.2.3.3. SWOT Analysis
- 15.2.3.4. Recent Developments
- 15.2.3.5. Financials (Based on Availability)
- 15.2.4 Amazon com Inc
- 15.2.4.1. Overview
- 15.2.4.2. Products
- 15.2.4.3. SWOT Analysis
- 15.2.4.4. Recent Developments
- 15.2.4.5. Financials (Based on Availability)
- 15.2.5 Facebook Inc
- 15.2.5.1. Overview
- 15.2.5.2. Products
- 15.2.5.3. SWOT Analysis
- 15.2.5.4. Recent Developments
- 15.2.5.5. Financials (Based on Availability)
- 15.2.6 JBL ( Harman International)
- 15.2.6.1. Overview
- 15.2.6.2. Products
- 15.2.6.3. SWOT Analysis
- 15.2.6.4. Recent Developments
- 15.2.6.5. Financials (Based on Availability)
- 15.2.7 LG Electronics Inc
- 15.2.7.1. Overview
- 15.2.7.2. Products
- 15.2.7.3. SWOT Analysis
- 15.2.7.4. Recent Developments
- 15.2.7.5. Financials (Based on Availability)
- 15.2.1 Baidu Inc
List of Figures
- Figure 1: Global Smart Display Industry Revenue Breakdown (Million, %) by Region 2024 & 2032
- Figure 2: Global Smart Display Industry Volume Breakdown (K Unit, %) by Region 2024 & 2032
- Figure 3: North America Smart Display Industry Revenue (Million), by Country 2024 & 2032
- Figure 4: North America Smart Display Industry Volume (K Unit), by Country 2024 & 2032
- Figure 5: North America Smart Display Industry Revenue Share (%), by Country 2024 & 2032
- Figure 6: North America Smart Display Industry Volume Share (%), by Country 2024 & 2032
- Figure 7: Europe Smart Display Industry Revenue (Million), by Country 2024 & 2032
- Figure 8: Europe Smart Display Industry Volume (K Unit), by Country 2024 & 2032
- Figure 9: Europe Smart Display Industry Revenue Share (%), by Country 2024 & 2032
- Figure 10: Europe Smart Display Industry Volume Share (%), by Country 2024 & 2032
- Figure 11: Asia Pacific Smart Display Industry Revenue (Million), by Country 2024 & 2032
- Figure 12: Asia Pacific Smart Display Industry Volume (K Unit), by Country 2024 & 2032
- Figure 13: Asia Pacific Smart Display Industry Revenue Share (%), by Country 2024 & 2032
- Figure 14: Asia Pacific Smart Display Industry Volume Share (%), by Country 2024 & 2032
- Figure 15: South America Smart Display Industry Revenue (Million), by Country 2024 & 2032
- Figure 16: South America Smart Display Industry Volume (K Unit), by Country 2024 & 2032
- Figure 17: South America Smart Display Industry Revenue Share (%), by Country 2024 & 2032
- Figure 18: South America Smart Display Industry Volume Share (%), by Country 2024 & 2032
- Figure 19: MEA Smart Display Industry Revenue (Million), by Country 2024 & 2032
- Figure 20: MEA Smart Display Industry Volume (K Unit), by Country 2024 & 2032
- Figure 21: MEA Smart Display Industry Revenue Share (%), by Country 2024 & 2032
- Figure 22: MEA Smart Display Industry Volume Share (%), by Country 2024 & 2032
- Figure 23: North America Smart Display Industry Revenue (Million), by Product Type 2024 & 2032
- Figure 24: North America Smart Display Industry Volume (K Unit), by Product Type 2024 & 2032
- Figure 25: North America Smart Display Industry Revenue Share (%), by Product Type 2024 & 2032
- Figure 26: North America Smart Display Industry Volume Share (%), by Product Type 2024 & 2032
- Figure 27: North America Smart Display Industry Revenue (Million), by Application 2024 & 2032
- Figure 28: North America Smart Display Industry Volume (K Unit), by Application 2024 & 2032
- Figure 29: North America Smart Display Industry Revenue Share (%), by Application 2024 & 2032
- Figure 30: North America Smart Display Industry Volume Share (%), by Application 2024 & 2032
- Figure 31: North America Smart Display Industry Revenue (Million), by Country 2024 & 2032
- Figure 32: North America Smart Display Industry Volume (K Unit), by Country 2024 & 2032
- Figure 33: North America Smart Display Industry Revenue Share (%), by Country 2024 & 2032
- Figure 34: North America Smart Display Industry Volume Share (%), by Country 2024 & 2032
- Figure 35: Europe Smart Display Industry Revenue (Million), by Product Type 2024 & 2032
- Figure 36: Europe Smart Display Industry Volume (K Unit), by Product Type 2024 & 2032
- Figure 37: Europe Smart Display Industry Revenue Share (%), by Product Type 2024 & 2032
- Figure 38: Europe Smart Display Industry Volume Share (%), by Product Type 2024 & 2032
- Figure 39: Europe Smart Display Industry Revenue (Million), by Application 2024 & 2032
- Figure 40: Europe Smart Display Industry Volume (K Unit), by Application 2024 & 2032
- Figure 41: Europe Smart Display Industry Revenue Share (%), by Application 2024 & 2032
- Figure 42: Europe Smart Display Industry Volume Share (%), by Application 2024 & 2032
- Figure 43: Europe Smart Display Industry Revenue (Million), by Country 2024 & 2032
- Figure 44: Europe Smart Display Industry Volume (K Unit), by Country 2024 & 2032
- Figure 45: Europe Smart Display Industry Revenue Share (%), by Country 2024 & 2032
- Figure 46: Europe Smart Display Industry Volume Share (%), by Country 2024 & 2032
- Figure 47: Asia Pacific Smart Display Industry Revenue (Million), by Product Type 2024 & 2032
- Figure 48: Asia Pacific Smart Display Industry Volume (K Unit), by Product Type 2024 & 2032
- Figure 49: Asia Pacific Smart Display Industry Revenue Share (%), by Product Type 2024 & 2032
- Figure 50: Asia Pacific Smart Display Industry Volume Share (%), by Product Type 2024 & 2032
- Figure 51: Asia Pacific Smart Display Industry Revenue (Million), by Application 2024 & 2032
- Figure 52: Asia Pacific Smart Display Industry Volume (K Unit), by Application 2024 & 2032
- Figure 53: Asia Pacific Smart Display Industry Revenue Share (%), by Application 2024 & 2032
- Figure 54: Asia Pacific Smart Display Industry Volume Share (%), by Application 2024 & 2032
- Figure 55: Asia Pacific Smart Display Industry Revenue (Million), by Country 2024 & 2032
- Figure 56: Asia Pacific Smart Display Industry Volume (K Unit), by Country 2024 & 2032
- Figure 57: Asia Pacific Smart Display Industry Revenue Share (%), by Country 2024 & 2032
- Figure 58: Asia Pacific Smart Display Industry Volume Share (%), by Country 2024 & 2032
- Figure 59: Rest of the World Smart Display Industry Revenue (Million), by Product Type 2024 & 2032
- Figure 60: Rest of the World Smart Display Industry Volume (K Unit), by Product Type 2024 & 2032
- Figure 61: Rest of the World Smart Display Industry Revenue Share (%), by Product Type 2024 & 2032
- Figure 62: Rest of the World Smart Display Industry Volume Share (%), by Product Type 2024 & 2032
- Figure 63: Rest of the World Smart Display Industry Revenue (Million), by Application 2024 & 2032
- Figure 64: Rest of the World Smart Display Industry Volume (K Unit), by Application 2024 & 2032
- Figure 65: Rest of the World Smart Display Industry Revenue Share (%), by Application 2024 & 2032
- Figure 66: Rest of the World Smart Display Industry Volume Share (%), by Application 2024 & 2032
- Figure 67: Rest of the World Smart Display Industry Revenue (Million), by Country 2024 & 2032
- Figure 68: Rest of the World Smart Display Industry Volume (K Unit), by Country 2024 & 2032
- Figure 69: Rest of the World Smart Display Industry Revenue Share (%), by Country 2024 & 2032
- Figure 70: Rest of the World Smart Display Industry Volume Share (%), by Country 2024 & 2032
List of Tables
- Table 1: Global Smart Display Industry Revenue Million Forecast, by Region 2019 & 2032
- Table 2: Global Smart Display Industry Volume K Unit Forecast, by Region 2019 & 2032
- Table 3: Global Smart Display Industry Revenue Million Forecast, by Product Type 2019 & 2032
- Table 4: Global Smart Display Industry Volume K Unit Forecast, by Product Type 2019 & 2032
- Table 5: Global Smart Display Industry Revenue Million Forecast, by Application 2019 & 2032
- Table 6: Global Smart Display Industry Volume K Unit Forecast, by Application 2019 & 2032
- Table 7: Global Smart Display Industry Revenue Million Forecast, by Region 2019 & 2032
- Table 8: Global Smart Display Industry Volume K Unit Forecast, by Region 2019 & 2032
- Table 9: Global Smart Display Industry Revenue Million Forecast, by Country 2019 & 2032
- Table 10: Global Smart Display Industry Volume K Unit Forecast, by Country 2019 & 2032
- Table 11: United States Smart Display Industry Revenue (Million) Forecast, by Application 2019 & 2032
- Table 12: United States Smart Display Industry Volume (K Unit) Forecast, by Application 2019 & 2032
- Table 13: Canada Smart Display Industry Revenue (Million) Forecast, by Application 2019 & 2032
- Table 14: Canada Smart Display Industry Volume (K Unit) Forecast, by Application 2019 & 2032
- Table 15: Mexico Smart Display Industry Revenue (Million) Forecast, by Application 2019 & 2032
- Table 16: Mexico Smart Display Industry Volume (K Unit) Forecast, by Application 2019 & 2032
- Table 17: Global Smart Display Industry Revenue Million Forecast, by Country 2019 & 2032
- Table 18: Global Smart Display Industry Volume K Unit Forecast, by Country 2019 & 2032
- Table 19: Germany Smart Display Industry Revenue (Million) Forecast, by Application 2019 & 2032
- Table 20: Germany Smart Display Industry Volume (K Unit) Forecast, by Application 2019 & 2032
- Table 21: United Kingdom Smart Display Industry Revenue (Million) Forecast, by Application 2019 & 2032
- Table 22: United Kingdom Smart Display Industry Volume (K Unit) Forecast, by Application 2019 & 2032
- Table 23: France Smart Display Industry Revenue (Million) Forecast, by Application 2019 & 2032
- Table 24: France Smart Display Industry Volume (K Unit) Forecast, by Application 2019 & 2032
- Table 25: Spain Smart Display Industry Revenue (Million) Forecast, by Application 2019 & 2032
- Table 26: Spain Smart Display Industry Volume (K Unit) Forecast, by Application 2019 & 2032
- Table 27: Italy Smart Display Industry Revenue (Million) Forecast, by Application 2019 & 2032
- Table 28: Italy Smart Display Industry Volume (K Unit) Forecast, by Application 2019 & 2032
- Table 29: Spain Smart Display Industry Revenue (Million) Forecast, by Application 2019 & 2032
- Table 30: Spain Smart Display Industry Volume (K Unit) Forecast, by Application 2019 & 2032
- Table 31: Belgium Smart Display Industry Revenue (Million) Forecast, by Application 2019 & 2032
- Table 32: Belgium Smart Display Industry Volume (K Unit) Forecast, by Application 2019 & 2032
- Table 33: Netherland Smart Display Industry Revenue (Million) Forecast, by Application 2019 & 2032
- Table 34: Netherland Smart Display Industry Volume (K Unit) Forecast, by Application 2019 & 2032
- Table 35: Nordics Smart Display Industry Revenue (Million) Forecast, by Application 2019 & 2032
- Table 36: Nordics Smart Display Industry Volume (K Unit) Forecast, by Application 2019 & 2032
- Table 37: Rest of Europe Smart Display Industry Revenue (Million) Forecast, by Application 2019 & 2032
- Table 38: Rest of Europe Smart Display Industry Volume (K Unit) Forecast, by Application 2019 & 2032
- Table 39: Global Smart Display Industry Revenue Million Forecast, by Country 2019 & 2032
- Table 40: Global Smart Display Industry Volume K Unit Forecast, by Country 2019 & 2032
- Table 41: China Smart Display Industry Revenue (Million) Forecast, by Application 2019 & 2032
- Table 42: China Smart Display Industry Volume (K Unit) Forecast, by Application 2019 & 2032
- Table 43: Japan Smart Display Industry Revenue (Million) Forecast, by Application 2019 & 2032
- Table 44: Japan Smart Display Industry Volume (K Unit) Forecast, by Application 2019 & 2032
- Table 45: India Smart Display Industry Revenue (Million) Forecast, by Application 2019 & 2032
- Table 46: India Smart Display Industry Volume (K Unit) Forecast, by Application 2019 & 2032
- Table 47: South Korea Smart Display Industry Revenue (Million) Forecast, by Application 2019 & 2032
- Table 48: South Korea Smart Display Industry Volume (K Unit) Forecast, by Application 2019 & 2032
- Table 49: Southeast Asia Smart Display Industry Revenue (Million) Forecast, by Application 2019 & 2032
- Table 50: Southeast Asia Smart Display Industry Volume (K Unit) Forecast, by Application 2019 & 2032
- Table 51: Australia Smart Display Industry Revenue (Million) Forecast, by Application 2019 & 2032
- Table 52: Australia Smart Display Industry Volume (K Unit) Forecast, by Application 2019 & 2032
- Table 53: Indonesia Smart Display Industry Revenue (Million) Forecast, by Application 2019 & 2032
- Table 54: Indonesia Smart Display Industry Volume (K Unit) Forecast, by Application 2019 & 2032
- Table 55: Phillipes Smart Display Industry Revenue (Million) Forecast, by Application 2019 & 2032
- Table 56: Phillipes Smart Display Industry Volume (K Unit) Forecast, by Application 2019 & 2032
- Table 57: Singapore Smart Display Industry Revenue (Million) Forecast, by Application 2019 & 2032
- Table 58: Singapore Smart Display Industry Volume (K Unit) Forecast, by Application 2019 & 2032
- Table 59: Thailandc Smart Display Industry Revenue (Million) Forecast, by Application 2019 & 2032
- Table 60: Thailandc Smart Display Industry Volume (K Unit) Forecast, by Application 2019 & 2032
- Table 61: Rest of Asia Pacific Smart Display Industry Revenue (Million) Forecast, by Application 2019 & 2032
- Table 62: Rest of Asia Pacific Smart Display Industry Volume (K Unit) Forecast, by Application 2019 & 2032
- Table 63: Global Smart Display Industry Revenue Million Forecast, by Country 2019 & 2032
- Table 64: Global Smart Display Industry Volume K Unit Forecast, by Country 2019 & 2032
- Table 65: Brazil Smart Display Industry Revenue (Million) Forecast, by Application 2019 & 2032
- Table 66: Brazil Smart Display Industry Volume (K Unit) Forecast, by Application 2019 & 2032
- Table 67: Argentina Smart Display Industry Revenue (Million) Forecast, by Application 2019 & 2032
- Table 68: Argentina Smart Display Industry Volume (K Unit) Forecast, by Application 2019 & 2032
- Table 69: Peru Smart Display Industry Revenue (Million) Forecast, by Application 2019 & 2032
- Table 70: Peru Smart Display Industry Volume (K Unit) Forecast, by Application 2019 & 2032
- Table 71: Chile Smart Display Industry Revenue (Million) Forecast, by Application 2019 & 2032
- Table 72: Chile Smart Display Industry Volume (K Unit) Forecast, by Application 2019 & 2032
- Table 73: Colombia Smart Display Industry Revenue (Million) Forecast, by Application 2019 & 2032
- Table 74: Colombia Smart Display Industry Volume (K Unit) Forecast, by Application 2019 & 2032
- Table 75: Ecuador Smart Display Industry Revenue (Million) Forecast, by Application 2019 & 2032
- Table 76: Ecuador Smart Display Industry Volume (K Unit) Forecast, by Application 2019 & 2032
- Table 77: Venezuela Smart Display Industry Revenue (Million) Forecast, by Application 2019 & 2032
- Table 78: Venezuela Smart Display Industry Volume (K Unit) Forecast, by Application 2019 & 2032
- Table 79: Rest of South America Smart Display Industry Revenue (Million) Forecast, by Application 2019 & 2032
- Table 80: Rest of South America Smart Display Industry Volume (K Unit) Forecast, by Application 2019 & 2032
- Table 81: Global Smart Display Industry Revenue Million Forecast, by Country 2019 & 2032
- Table 82: Global Smart Display Industry Volume K Unit Forecast, by Country 2019 & 2032
- Table 83: United Arab Emirates Smart Display Industry Revenue (Million) Forecast, by Application 2019 & 2032
- Table 84: United Arab Emirates Smart Display Industry Volume (K Unit) Forecast, by Application 2019 & 2032
- Table 85: Saudi Arabia Smart Display Industry Revenue (Million) Forecast, by Application 2019 & 2032
- Table 86: Saudi Arabia Smart Display Industry Volume (K Unit) Forecast, by Application 2019 & 2032
- Table 87: South Africa Smart Display Industry Revenue (Million) Forecast, by Application 2019 & 2032
- Table 88: South Africa Smart Display Industry Volume (K Unit) Forecast, by Application 2019 & 2032
- Table 89: Rest of Middle East and Africa Smart Display Industry Revenue (Million) Forecast, by Application 2019 & 2032
- Table 90: Rest of Middle East and Africa Smart Display Industry Volume (K Unit) Forecast, by Application 2019 & 2032
- Table 91: Global Smart Display Industry Revenue Million Forecast, by Product Type 2019 & 2032
- Table 92: Global Smart Display Industry Volume K Unit Forecast, by Product Type 2019 & 2032
- Table 93: Global Smart Display Industry Revenue Million Forecast, by Application 2019 & 2032
- Table 94: Global Smart Display Industry Volume K Unit Forecast, by Application 2019 & 2032
- Table 95: Global Smart Display Industry Revenue Million Forecast, by Country 2019 & 2032
- Table 96: Global Smart Display Industry Volume K Unit Forecast, by Country 2019 & 2032
- Table 97: Global Smart Display Industry Revenue Million Forecast, by Product Type 2019 & 2032
- Table 98: Global Smart Display Industry Volume K Unit Forecast, by Product Type 2019 & 2032
- Table 99: Global Smart Display Industry Revenue Million Forecast, by Application 2019 & 2032
- Table 100: Global Smart Display Industry Volume K Unit Forecast, by Application 2019 & 2032
- Table 101: Global Smart Display Industry Revenue Million Forecast, by Country 2019 & 2032
- Table 102: Global Smart Display Industry Volume K Unit Forecast, by Country 2019 & 2032
- Table 103: Global Smart Display Industry Revenue Million Forecast, by Product Type 2019 & 2032
- Table 104: Global Smart Display Industry Volume K Unit Forecast, by Product Type 2019 & 2032
- Table 105: Global Smart Display Industry Revenue Million Forecast, by Application 2019 & 2032
- Table 106: Global Smart Display Industry Volume K Unit Forecast, by Application 2019 & 2032
- Table 107: Global Smart Display Industry Revenue Million Forecast, by Country 2019 & 2032
- Table 108: Global Smart Display Industry Volume K Unit Forecast, by Country 2019 & 2032
- Table 109: Global Smart Display Industry Revenue Million Forecast, by Product Type 2019 & 2032
- Table 110: Global Smart Display Industry Volume K Unit Forecast, by Product Type 2019 & 2032
- Table 111: Global Smart Display Industry Revenue Million Forecast, by Application 2019 & 2032
- Table 112: Global Smart Display Industry Volume K Unit Forecast, by Application 2019 & 2032
- Table 113: Global Smart Display Industry Revenue Million Forecast, by Country 2019 & 2032
- Table 114: Global Smart Display Industry Volume K Unit Forecast, by Country 2019 & 2032
Frequently Asked Questions
1. What is the projected Compound Annual Growth Rate (CAGR) of the Smart Display Industry?
The projected CAGR is approximately 28.40%.
2. Which companies are prominent players in the Smart Display Industry?
Key companies in the market include Baidu Inc, Lenovo Group Limited, Google LLC, Amazon com Inc, Facebook Inc, JBL ( Harman International), LG Electronics Inc .
3. What are the main segments of the Smart Display Industry?
The market segments include Product Type, Application.
4. Can you provide details about the market size?
The market size is estimated to be USD 3.74 Million as of 2022.
5. What are some drivers contributing to market growth?
Increasing Demand of Smart Home Devices.
6. What are the notable trends driving market growth?
Connected Device to Drive the Market Growth.
7. Are there any restraints impacting market growth?
High Cost and Limited Set of Vocabulary.
8. Can you provide examples of recent developments in the market?
September 2022: Lenovo launched its first smart glasses called Lenovo Glasses T1. The highlights of the smart glasses include two micro OLED displays, a USB-C port for connectivity, and built-in speakers. The Lenovo smart glasses are also called Lenovo Yoga Glasses in China.
9. What pricing options are available for accessing the report?
Pricing options include single-user, multi-user, and enterprise licenses priced at USD 4750, USD 5250, and USD 8750 respectively.
10. Is the market size provided in terms of value or volume?
The market size is provided in terms of value, measured in Million and volume, measured in K Unit.
11. Are there any specific market keywords associated with the report?
Yes, the market keyword associated with the report is "Smart Display Industry," which aids in identifying and referencing the specific market segment covered.
12. How do I determine which pricing option suits my needs best?
The pricing options vary based on user requirements and access needs. Individual users may opt for single-user licenses, while businesses requiring broader access may choose multi-user or enterprise licenses for cost-effective access to the report.
13. Are there any additional resources or data provided in the Smart Display Industry report?
While the report offers comprehensive insights, it's advisable to review the specific contents or supplementary materials provided to ascertain if additional resources or data are available.
14. How can I stay updated on further developments or reports in the Smart Display Industry?
To stay informed about further developments, trends, and reports in the Smart Display Industry, consider subscribing to industry newsletters, following relevant companies and organizations, or regularly checking reputable industry news sources and publications.
Methodology
Step 1 - Identification of Relevant Samples Size from Population Database


Step 2 - Approaches for Defining Global Market Size (Value, Volume* & Price*)

Note*: In applicable scenarios
Step 3 - Data Sources
Primary Research
- Web Analytics
- Survey Reports
- Research Institute
- Latest Research Reports
- Opinion Leaders
Secondary Research
- Annual Reports
- White Paper
- Latest Press Release
- Industry Association
- Paid Database
- Investor Presentations

Step 4 - Data Triangulation
Involves using different sources of information in order to increase the validity of a study
These sources are likely to be stakeholders in a program - participants, other researchers, program staff, other community members, and so on.
Then we put all data in single framework & apply various statistical tools to find out the dynamic on the market.
During the analysis stage, feedback from the stakeholder groups would be compared to determine areas of agreement as well as areas of divergence
