

Key Insights
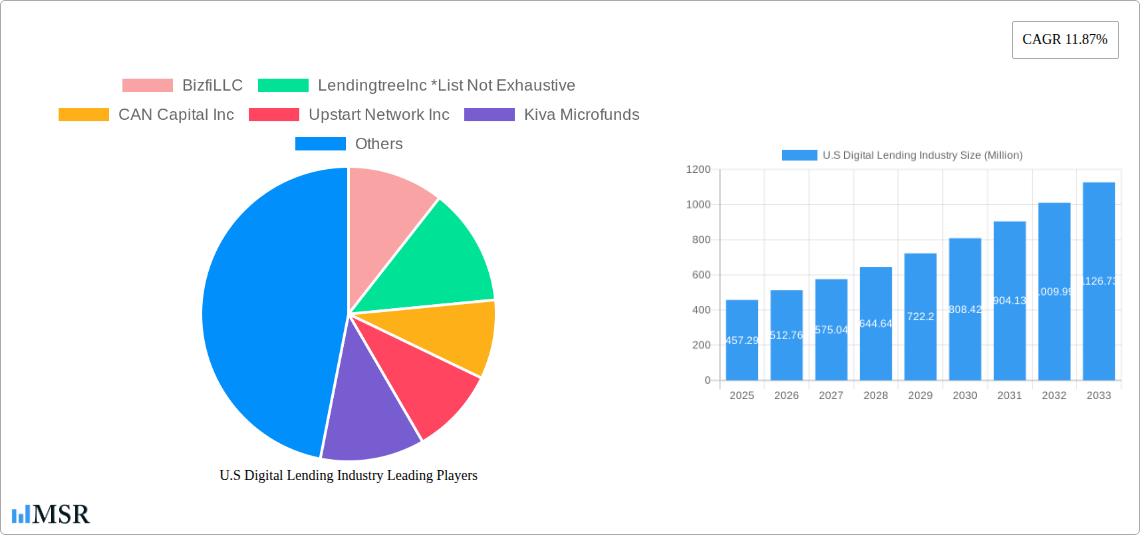
The U.S. digital lending industry is experiencing robust growth, driven by increasing smartphone penetration, technological advancements in lending platforms, and a shift towards convenient and faster loan processing. The market, valued at $457.29 million in 2025, is projected to expand significantly over the forecast period (2025-2033), fueled by a compound annual growth rate (CAGR) of 11.87%. This growth is propelled by the rising adoption of digital lending platforms by both businesses and consumers, seeking efficient and streamlined financing solutions. Key segments include business digital lending, catering to SMEs seeking operational capital, and consumer digital lending, serving individual borrowers needing personal loans, mortgages, or credit lines. The competitive landscape is dynamic, with established players like LendingTree and LendingClub alongside innovative fintech startups such as Upstart and SoFi constantly vying for market share. The industry's expansion is also influenced by evolving regulatory frameworks and the increasing focus on responsible lending practices.
Several factors contribute to the industry's continued expansion. Technological innovation, specifically AI-driven credit scoring and improved risk assessment models, are enabling lenders to extend credit to a wider range of borrowers more efficiently. Moreover, the increasing integration of open banking technologies improves data accessibility and underwrites lending decisions more effectively. While regulatory scrutiny and potential economic downturns present challenges, the overall industry trajectory remains positive, driven by consistent demand for convenient and accessible financial solutions. The industry is predicted to benefit from ongoing advancements in financial technology and a growing preference among businesses and individuals for digital platforms. North America is anticipated to maintain a substantial market share, reflecting strong adoption rates and technological infrastructure.
U.S. Digital Lending Industry Report: 2019-2033
This comprehensive report provides an in-depth analysis of the U.S. digital lending industry, covering market dynamics, key segments, leading players, and future growth prospects. The study period spans from 2019 to 2033, with 2025 as the base and estimated year. This report is essential for investors, lenders, fintech companies, and anyone seeking to understand this rapidly evolving market. Expect detailed insights into market size, CAGR, and key trends shaping the future of digital lending.
U.S Digital Lending Industry Market Concentration & Dynamics
The U.S. digital lending market is characterized by a dynamic interplay of concentration, innovation, regulation, and competitive pressures. While a few large players like LendingClub Corp and SoFi hold significant market share, the industry remains relatively fragmented with numerous smaller firms competing for market share. The market share of the top 5 players in 2025 is estimated to be xx%. Mergers and acquisitions (M&A) are frequent, reflecting a consolidation trend driven by the need for scale and technological advancement. The number of M&A deals in the sector from 2019-2024 totaled approximately xx.
- Market Concentration: Highly fragmented, with significant potential for further consolidation.
- Innovation Ecosystems: Rapid technological advancements, fueled by AI, machine learning, and blockchain technologies, are transforming lending processes.
- Regulatory Frameworks: The industry faces evolving regulatory scrutiny focused on consumer protection, data privacy, and fair lending practices.
- Substitute Products: Traditional lending channels pose competition, although digital lending's speed and convenience are major differentiators.
- End-User Trends: Growing consumer preference for online and mobile-based financial services fuels market growth.
- M&A Activities: Frequent M&A activity signifies industry consolidation and competition for market leadership.
U.S Digital Lending Industry Industry Insights & Trends
The U.S. digital lending market experienced significant growth during the historical period (2019-2024), driven by increasing adoption of digital technologies and changing consumer behavior. The market size reached an estimated $xx Million in 2024, with a compound annual growth rate (CAGR) of xx% during this period. This growth is projected to continue during the forecast period (2025-2033), although at a slightly moderated pace. Key market growth drivers include: expanding smartphone penetration, rising demand for quick and convenient financing, and the increasing availability of alternative data for credit scoring. Technological disruptions, particularly the use of AI and machine learning in credit underwriting and risk assessment, are transforming the industry and creating opportunities for new entrants. Evolving consumer preferences, including a demand for personalized lending experiences and transparent pricing, further shape the market landscape.

Key Markets & Segments Leading U.S Digital Lending Industry
The U.S. digital lending market is broadly categorized into business digital lending and consumer digital lending. Both segments are witnessing significant growth, but consumer digital lending currently holds a larger market share due to the high volume of individual borrowers.
- Consumer Digital Lending: This segment dominates the market, driven by factors such as:
- High smartphone penetration and online banking usage.
- The convenience and speed of online applications and approvals.
- Growing demand for personal loans, auto loans, and credit cards.
- Business Digital Lending: This sector is experiencing rapid growth fueled by:
- Increased access to online financial services for small and medium-sized businesses (SMBs).
- Technological solutions streamlining business lending processes.
- The need for faster access to capital for business expansion and operations.
The dominance of consumer digital lending is due to the sheer volume of individual borrowers seeking various financial products. However, the business digital lending segment shows significant growth potential as technology adoption continues to increase among SMBs.
U.S Digital Lending Industry Product Developments
Recent innovations include AI-powered credit scoring, personalized lending options, and embedded finance solutions that integrate lending services into other platforms. These advancements enhance efficiency, risk management, and customer experience, providing a competitive edge for digital lenders. The introduction of products like TruStage Payment Guard Insurance highlights an emerging trend towards risk mitigation solutions that improve both borrower and lender outcomes.
Challenges in the U.S Digital Lending Industry Market
The U.S. digital lending industry faces numerous challenges, including stringent regulatory compliance requirements, the potential for increased cybersecurity risks and fraud, and the intensifying competition among established and new market players. These factors contribute to a complex and evolving market landscape. The industry also needs to navigate concerns about data privacy and the potential for biased algorithms in credit scoring.
Forces Driving U.S Digital Lending Industry Growth
Several factors are driving the growth of the U.S. digital lending industry, including technological advancements (AI, machine learning), the increasing adoption of mobile financial services, and changing consumer preferences. Government initiatives aimed at expanding financial inclusion also play a role.
Challenges in the U.S Digital Lending Industry Market
Long-term growth will be fueled by further technological innovations, strategic partnerships, and expansion into underserved markets. The increasing integration of digital lending with other financial services, such as payment processing and wealth management, will further drive market growth.
Emerging Opportunities in U.S Digital Lending Industry
Emerging opportunities lie in leveraging AI and machine learning to personalize lending offers, expanding into niche markets with specialized lending products, and developing innovative solutions for risk management and fraud detection. The integration of digital lending into other financial service ecosystems also presents significant growth potential.
Leading Players in the U.S Digital Lending Industry Sector
- Bizfi LLC
- LendingTree Inc
- CAN Capital Inc
- Upstart Network Inc
- Kiva Microfunds
- LendingClub Corp
- Social Finance Inc (SoFi)
- On Deck Capital Inc
- Kabbage Inc
- Prosper Marketplace Inc
Key Milestones in U.S Digital Lending Industry Industry
- September 2023: Launch of TruStage Payment Guard Insurance, a significant innovation in risk mitigation for digital lenders.
- September 2023: Acquisition of Citi's Bridge platform by Foro Holdings, expanding access to capital for SMBs.
- August 2022: Arc Home LLC selects Tavant to accelerate its digital transformation, emphasizing the importance of technological advancements in the industry.
- July 2022: Upstart expands its AI lending platform access to CDFIs, promoting financial inclusion.
Strategic Outlook for U.S Digital Lending Industry Market
The future of the U.S. digital lending industry is bright, driven by continuous technological innovation, expanding market penetration, and a growing demand for accessible and convenient financial services. Strategic opportunities abound for companies that can leverage data analytics, AI, and personalized lending experiences to offer superior products and services to borrowers and businesses. The industry's future hinges on the ability of firms to navigate regulatory complexities while meeting the evolving needs of a diverse customer base.
U.S Digital Lending Industry Segmentation
-
1. Type
-
1.1. Business
- 1.1.1. Business Digital Lending Market Dynamics
- 1.1.2. Business
- 1.1.3. Market Size Estimates and Forecasts
-
1.2. Consumer
- 1.2.1. Consumer Digital Lending Market Dynamics
- 1.2.2. Consumer
- 1.2.3. Consumer
-
1.1. Business
U.S Digital Lending Industry Segmentation By Geography
-
1. North America
- 1.1. United States
- 1.2. Canada
- 1.3. Mexico
-
2. South America
- 2.1. Brazil
- 2.2. Argentina
- 2.3. Rest of South America
-
3. Europe
- 3.1. United Kingdom
- 3.2. Germany
- 3.3. France
- 3.4. Italy
- 3.5. Spain
- 3.6. Russia
- 3.7. Benelux
- 3.8. Nordics
- 3.9. Rest of Europe
-
4. Middle East & Africa
- 4.1. Turkey
- 4.2. Israel
- 4.3. GCC
- 4.4. North Africa
- 4.5. South Africa
- 4.6. Rest of Middle East & Africa
-
5. Asia Pacific
- 5.1. China
- 5.2. India
- 5.3. Japan
- 5.4. South Korea
- 5.5. ASEAN
- 5.6. Oceania
- 5.7. Rest of Asia Pacific

U.S Digital Lending Industry REPORT HIGHLIGHTS
| Aspects | Details |
|---|---|
| Study Period | 2019-2033 |
| Base Year | 2024 |
| Estimated Year | 2025 |
| Forecast Period | 2025-2033 |
| Historical Period | 2019-2024 |
| Growth Rate | CAGR of 11.87% from 2019-2033 |
| Segmentation |
|
Table of Contents
- 1. Introduction
- 1.1. Research Scope
- 1.2. Market Segmentation
- 1.3. Research Methodology
- 1.4. Definitions and Assumptions
- 2. Executive Summary
- 2.1. Introduction
- 3. Market Dynamics
- 3.1. Introduction
- 3.2. Market Drivers
- 3.2.1. 5.1 Increasing Number of Potential Loan Purchasers with 'Digital Behavior'5.2 Increasing disposable income
- 3.3. Market Restrains
- 3.3.1. Low Light Sensing Capabilities Act as a Restraining Factor; Low-cost Sensors are Increasing the Threat to Scale Down the Quality
- 3.4. Market Trends
- 3.4.1. Increasing Number of Potential Loan Purchasers with Digital Behavior
- 4. Market Factor Analysis
- 4.1. Porters Five Forces
- 4.2. Supply/Value Chain
- 4.3. PESTEL analysis
- 4.4. Market Entropy
- 4.5. Patent/Trademark Analysis
- 5. Global U.S Digital Lending Industry Analysis, Insights and Forecast, 2019-2031
- 5.1. Market Analysis, Insights and Forecast - by Type
- 5.1.1. Business
- 5.1.1.1. Business Digital Lending Market Dynamics
- 5.1.1.2. Business
- 5.1.1.3. Market Size Estimates and Forecasts
- 5.1.2. Consumer
- 5.1.2.1. Consumer Digital Lending Market Dynamics
- 5.1.2.2. Consumer
- 5.1.2.3. Consumer
- 5.1.1. Business
- 5.2. Market Analysis, Insights and Forecast - by Region
- 5.2.1. North America
- 5.2.2. South America
- 5.2.3. Europe
- 5.2.4. Middle East & Africa
- 5.2.5. Asia Pacific
- 5.1. Market Analysis, Insights and Forecast - by Type
- 6. North America U.S Digital Lending Industry Analysis, Insights and Forecast, 2019-2031
- 6.1. Market Analysis, Insights and Forecast - by Type
- 6.1.1. Business
- 6.1.1.1. Business Digital Lending Market Dynamics
- 6.1.1.2. Business
- 6.1.1.3. Market Size Estimates and Forecasts
- 6.1.2. Consumer
- 6.1.2.1. Consumer Digital Lending Market Dynamics
- 6.1.2.2. Consumer
- 6.1.2.3. Consumer
- 6.1.1. Business
- 6.1. Market Analysis, Insights and Forecast - by Type
- 7. South America U.S Digital Lending Industry Analysis, Insights and Forecast, 2019-2031
- 7.1. Market Analysis, Insights and Forecast - by Type
- 7.1.1. Business
- 7.1.1.1. Business Digital Lending Market Dynamics
- 7.1.1.2. Business
- 7.1.1.3. Market Size Estimates and Forecasts
- 7.1.2. Consumer
- 7.1.2.1. Consumer Digital Lending Market Dynamics
- 7.1.2.2. Consumer
- 7.1.2.3. Consumer
- 7.1.1. Business
- 7.1. Market Analysis, Insights and Forecast - by Type
- 8. Europe U.S Digital Lending Industry Analysis, Insights and Forecast, 2019-2031
- 8.1. Market Analysis, Insights and Forecast - by Type
- 8.1.1. Business
- 8.1.1.1. Business Digital Lending Market Dynamics
- 8.1.1.2. Business
- 8.1.1.3. Market Size Estimates and Forecasts
- 8.1.2. Consumer
- 8.1.2.1. Consumer Digital Lending Market Dynamics
- 8.1.2.2. Consumer
- 8.1.2.3. Consumer
- 8.1.1. Business
- 8.1. Market Analysis, Insights and Forecast - by Type
- 9. Middle East & Africa U.S Digital Lending Industry Analysis, Insights and Forecast, 2019-2031
- 9.1. Market Analysis, Insights and Forecast - by Type
- 9.1.1. Business
- 9.1.1.1. Business Digital Lending Market Dynamics
- 9.1.1.2. Business
- 9.1.1.3. Market Size Estimates and Forecasts
- 9.1.2. Consumer
- 9.1.2.1. Consumer Digital Lending Market Dynamics
- 9.1.2.2. Consumer
- 9.1.2.3. Consumer
- 9.1.1. Business
- 9.1. Market Analysis, Insights and Forecast - by Type
- 10. Asia Pacific U.S Digital Lending Industry Analysis, Insights and Forecast, 2019-2031
- 10.1. Market Analysis, Insights and Forecast - by Type
- 10.1.1. Business
- 10.1.1.1. Business Digital Lending Market Dynamics
- 10.1.1.2. Business
- 10.1.1.3. Market Size Estimates and Forecasts
- 10.1.2. Consumer
- 10.1.2.1. Consumer Digital Lending Market Dynamics
- 10.1.2.2. Consumer
- 10.1.2.3. Consumer
- 10.1.1. Business
- 10.1. Market Analysis, Insights and Forecast - by Type
- 11. North America U.S Digital Lending Industry Analysis, Insights and Forecast, 2019-2031
- 11.1. Market Analysis, Insights and Forecast - By Country/Sub-region
- 11.1.1.
- 12. Europe U.S Digital Lending Industry Analysis, Insights and Forecast, 2019-2031
- 12.1. Market Analysis, Insights and Forecast - By Country/Sub-region
- 12.1.1.
- 13. Asia Pacific U.S Digital Lending Industry Analysis, Insights and Forecast, 2019-2031
- 13.1. Market Analysis, Insights and Forecast - By Country/Sub-region
- 13.1.1.
- 14. Latin America U.S Digital Lending Industry Analysis, Insights and Forecast, 2019-2031
- 14.1. Market Analysis, Insights and Forecast - By Country/Sub-region
- 14.1.1.
- 15. Middle East and Africa U.S Digital Lending Industry Analysis, Insights and Forecast, 2019-2031
- 15.1. Market Analysis, Insights and Forecast - By Country/Sub-region
- 15.1.1.
- 16. Competitive Analysis
- 16.1. Global Market Share Analysis 2024
- 16.2. Company Profiles
- 16.2.1 BizfiLLC
- 16.2.1.1. Overview
- 16.2.1.2. Products
- 16.2.1.3. SWOT Analysis
- 16.2.1.4. Recent Developments
- 16.2.1.5. Financials (Based on Availability)
- 16.2.2 LendingtreeInc *List Not Exhaustive
- 16.2.2.1. Overview
- 16.2.2.2. Products
- 16.2.2.3. SWOT Analysis
- 16.2.2.4. Recent Developments
- 16.2.2.5. Financials (Based on Availability)
- 16.2.3 CAN Capital Inc
- 16.2.3.1. Overview
- 16.2.3.2. Products
- 16.2.3.3. SWOT Analysis
- 16.2.3.4. Recent Developments
- 16.2.3.5. Financials (Based on Availability)
- 16.2.4 Upstart Network Inc
- 16.2.4.1. Overview
- 16.2.4.2. Products
- 16.2.4.3. SWOT Analysis
- 16.2.4.4. Recent Developments
- 16.2.4.5. Financials (Based on Availability)
- 16.2.5 Kiva Microfunds
- 16.2.5.1. Overview
- 16.2.5.2. Products
- 16.2.5.3. SWOT Analysis
- 16.2.5.4. Recent Developments
- 16.2.5.5. Financials (Based on Availability)
- 16.2.6 LendingClubCorp
- 16.2.6.1. Overview
- 16.2.6.2. Products
- 16.2.6.3. SWOT Analysis
- 16.2.6.4. Recent Developments
- 16.2.6.5. Financials (Based on Availability)
- 16.2.7 Social Finance Inc (SoFi)
- 16.2.7.1. Overview
- 16.2.7.2. Products
- 16.2.7.3. SWOT Analysis
- 16.2.7.4. Recent Developments
- 16.2.7.5. Financials (Based on Availability)
- 16.2.8 On Deck Capital Inc
- 16.2.8.1. Overview
- 16.2.8.2. Products
- 16.2.8.3. SWOT Analysis
- 16.2.8.4. Recent Developments
- 16.2.8.5. Financials (Based on Availability)
- 16.2.9 Kabbage Inc
- 16.2.9.1. Overview
- 16.2.9.2. Products
- 16.2.9.3. SWOT Analysis
- 16.2.9.4. Recent Developments
- 16.2.9.5. Financials (Based on Availability)
- 16.2.10 Prosper Marketplace Inc
- 16.2.10.1. Overview
- 16.2.10.2. Products
- 16.2.10.3. SWOT Analysis
- 16.2.10.4. Recent Developments
- 16.2.10.5. Financials (Based on Availability)
- 16.2.1 BizfiLLC
List of Figures
- Figure 1: Global U.S Digital Lending Industry Revenue Breakdown (Million, %) by Region 2024 & 2032
- Figure 2: North America U.S Digital Lending Industry Revenue (Million), by Country 2024 & 2032
- Figure 3: North America U.S Digital Lending Industry Revenue Share (%), by Country 2024 & 2032
- Figure 4: Europe U.S Digital Lending Industry Revenue (Million), by Country 2024 & 2032
- Figure 5: Europe U.S Digital Lending Industry Revenue Share (%), by Country 2024 & 2032
- Figure 6: Asia Pacific U.S Digital Lending Industry Revenue (Million), by Country 2024 & 2032
- Figure 7: Asia Pacific U.S Digital Lending Industry Revenue Share (%), by Country 2024 & 2032
- Figure 8: Latin America U.S Digital Lending Industry Revenue (Million), by Country 2024 & 2032
- Figure 9: Latin America U.S Digital Lending Industry Revenue Share (%), by Country 2024 & 2032
- Figure 10: Middle East and Africa U.S Digital Lending Industry Revenue (Million), by Country 2024 & 2032
- Figure 11: Middle East and Africa U.S Digital Lending Industry Revenue Share (%), by Country 2024 & 2032
- Figure 12: North America U.S Digital Lending Industry Revenue (Million), by Type 2024 & 2032
- Figure 13: North America U.S Digital Lending Industry Revenue Share (%), by Type 2024 & 2032
- Figure 14: North America U.S Digital Lending Industry Revenue (Million), by Country 2024 & 2032
- Figure 15: North America U.S Digital Lending Industry Revenue Share (%), by Country 2024 & 2032
- Figure 16: South America U.S Digital Lending Industry Revenue (Million), by Type 2024 & 2032
- Figure 17: South America U.S Digital Lending Industry Revenue Share (%), by Type 2024 & 2032
- Figure 18: South America U.S Digital Lending Industry Revenue (Million), by Country 2024 & 2032
- Figure 19: South America U.S Digital Lending Industry Revenue Share (%), by Country 2024 & 2032
- Figure 20: Europe U.S Digital Lending Industry Revenue (Million), by Type 2024 & 2032
- Figure 21: Europe U.S Digital Lending Industry Revenue Share (%), by Type 2024 & 2032
- Figure 22: Europe U.S Digital Lending Industry Revenue (Million), by Country 2024 & 2032
- Figure 23: Europe U.S Digital Lending Industry Revenue Share (%), by Country 2024 & 2032
- Figure 24: Middle East & Africa U.S Digital Lending Industry Revenue (Million), by Type 2024 & 2032
- Figure 25: Middle East & Africa U.S Digital Lending Industry Revenue Share (%), by Type 2024 & 2032
- Figure 26: Middle East & Africa U.S Digital Lending Industry Revenue (Million), by Country 2024 & 2032
- Figure 27: Middle East & Africa U.S Digital Lending Industry Revenue Share (%), by Country 2024 & 2032
- Figure 28: Asia Pacific U.S Digital Lending Industry Revenue (Million), by Type 2024 & 2032
- Figure 29: Asia Pacific U.S Digital Lending Industry Revenue Share (%), by Type 2024 & 2032
- Figure 30: Asia Pacific U.S Digital Lending Industry Revenue (Million), by Country 2024 & 2032
- Figure 31: Asia Pacific U.S Digital Lending Industry Revenue Share (%), by Country 2024 & 2032
List of Tables
- Table 1: Global U.S Digital Lending Industry Revenue Million Forecast, by Region 2019 & 2032
- Table 2: Global U.S Digital Lending Industry Revenue Million Forecast, by Type 2019 & 2032
- Table 3: Global U.S Digital Lending Industry Revenue Million Forecast, by Region 2019 & 2032
- Table 4: Global U.S Digital Lending Industry Revenue Million Forecast, by Country 2019 & 2032
- Table 5: U.S Digital Lending Industry Revenue (Million) Forecast, by Application 2019 & 2032
- Table 6: Global U.S Digital Lending Industry Revenue Million Forecast, by Country 2019 & 2032
- Table 7: U.S Digital Lending Industry Revenue (Million) Forecast, by Application 2019 & 2032
- Table 8: Global U.S Digital Lending Industry Revenue Million Forecast, by Country 2019 & 2032
- Table 9: U.S Digital Lending Industry Revenue (Million) Forecast, by Application 2019 & 2032
- Table 10: Global U.S Digital Lending Industry Revenue Million Forecast, by Country 2019 & 2032
- Table 11: U.S Digital Lending Industry Revenue (Million) Forecast, by Application 2019 & 2032
- Table 12: Global U.S Digital Lending Industry Revenue Million Forecast, by Country 2019 & 2032
- Table 13: U.S Digital Lending Industry Revenue (Million) Forecast, by Application 2019 & 2032
- Table 14: Global U.S Digital Lending Industry Revenue Million Forecast, by Type 2019 & 2032
- Table 15: Global U.S Digital Lending Industry Revenue Million Forecast, by Country 2019 & 2032
- Table 16: United States U.S Digital Lending Industry Revenue (Million) Forecast, by Application 2019 & 2032
- Table 17: Canada U.S Digital Lending Industry Revenue (Million) Forecast, by Application 2019 & 2032
- Table 18: Mexico U.S Digital Lending Industry Revenue (Million) Forecast, by Application 2019 & 2032
- Table 19: Global U.S Digital Lending Industry Revenue Million Forecast, by Type 2019 & 2032
- Table 20: Global U.S Digital Lending Industry Revenue Million Forecast, by Country 2019 & 2032
- Table 21: Brazil U.S Digital Lending Industry Revenue (Million) Forecast, by Application 2019 & 2032
- Table 22: Argentina U.S Digital Lending Industry Revenue (Million) Forecast, by Application 2019 & 2032
- Table 23: Rest of South America U.S Digital Lending Industry Revenue (Million) Forecast, by Application 2019 & 2032
- Table 24: Global U.S Digital Lending Industry Revenue Million Forecast, by Type 2019 & 2032
- Table 25: Global U.S Digital Lending Industry Revenue Million Forecast, by Country 2019 & 2032
- Table 26: United Kingdom U.S Digital Lending Industry Revenue (Million) Forecast, by Application 2019 & 2032
- Table 27: Germany U.S Digital Lending Industry Revenue (Million) Forecast, by Application 2019 & 2032
- Table 28: France U.S Digital Lending Industry Revenue (Million) Forecast, by Application 2019 & 2032
- Table 29: Italy U.S Digital Lending Industry Revenue (Million) Forecast, by Application 2019 & 2032
- Table 30: Spain U.S Digital Lending Industry Revenue (Million) Forecast, by Application 2019 & 2032
- Table 31: Russia U.S Digital Lending Industry Revenue (Million) Forecast, by Application 2019 & 2032
- Table 32: Benelux U.S Digital Lending Industry Revenue (Million) Forecast, by Application 2019 & 2032
- Table 33: Nordics U.S Digital Lending Industry Revenue (Million) Forecast, by Application 2019 & 2032
- Table 34: Rest of Europe U.S Digital Lending Industry Revenue (Million) Forecast, by Application 2019 & 2032
- Table 35: Global U.S Digital Lending Industry Revenue Million Forecast, by Type 2019 & 2032
- Table 36: Global U.S Digital Lending Industry Revenue Million Forecast, by Country 2019 & 2032
- Table 37: Turkey U.S Digital Lending Industry Revenue (Million) Forecast, by Application 2019 & 2032
- Table 38: Israel U.S Digital Lending Industry Revenue (Million) Forecast, by Application 2019 & 2032
- Table 39: GCC U.S Digital Lending Industry Revenue (Million) Forecast, by Application 2019 & 2032
- Table 40: North Africa U.S Digital Lending Industry Revenue (Million) Forecast, by Application 2019 & 2032
- Table 41: South Africa U.S Digital Lending Industry Revenue (Million) Forecast, by Application 2019 & 2032
- Table 42: Rest of Middle East & Africa U.S Digital Lending Industry Revenue (Million) Forecast, by Application 2019 & 2032
- Table 43: Global U.S Digital Lending Industry Revenue Million Forecast, by Type 2019 & 2032
- Table 44: Global U.S Digital Lending Industry Revenue Million Forecast, by Country 2019 & 2032
- Table 45: China U.S Digital Lending Industry Revenue (Million) Forecast, by Application 2019 & 2032
- Table 46: India U.S Digital Lending Industry Revenue (Million) Forecast, by Application 2019 & 2032
- Table 47: Japan U.S Digital Lending Industry Revenue (Million) Forecast, by Application 2019 & 2032
- Table 48: South Korea U.S Digital Lending Industry Revenue (Million) Forecast, by Application 2019 & 2032
- Table 49: ASEAN U.S Digital Lending Industry Revenue (Million) Forecast, by Application 2019 & 2032
- Table 50: Oceania U.S Digital Lending Industry Revenue (Million) Forecast, by Application 2019 & 2032
- Table 51: Rest of Asia Pacific U.S Digital Lending Industry Revenue (Million) Forecast, by Application 2019 & 2032
Frequently Asked Questions
1. What is the projected Compound Annual Growth Rate (CAGR) of the U.S Digital Lending Industry?
The projected CAGR is approximately 11.87%.
2. Which companies are prominent players in the U.S Digital Lending Industry?
Key companies in the market include BizfiLLC, LendingtreeInc *List Not Exhaustive, CAN Capital Inc, Upstart Network Inc, Kiva Microfunds, LendingClubCorp, Social Finance Inc (SoFi), On Deck Capital Inc, Kabbage Inc, Prosper Marketplace Inc.
3. What are the main segments of the U.S Digital Lending Industry?
The market segments include Type.
4. Can you provide details about the market size?
The market size is estimated to be USD 457.29 Million as of 2022.
5. What are some drivers contributing to market growth?
5.1 Increasing Number of Potential Loan Purchasers with 'Digital Behavior'5.2 Increasing disposable income.
6. What are the notable trends driving market growth?
Increasing Number of Potential Loan Purchasers with Digital Behavior.
7. Are there any restraints impacting market growth?
Low Light Sensing Capabilities Act as a Restraining Factor; Low-cost Sensors are Increasing the Threat to Scale Down the Quality.
8. Can you provide examples of recent developments in the market?
September 2023 - Payment Guard Insurance, a new lending solution offered by TruStage, a stable financial insurance, investment, and technology provider, was officially made available. As an inbuilt insurance solution for digital lenders and borrowers, the Payment Guard product is an innovative development in the insurance market for digital lending and was recently selected as a finalist for the Finovate Awards. It is intended to guard against sudden covered losses that can cause loan defaults. Borrowers are safeguarded in the case of a covered disability or job loss with TruStage Payment Guard Insurance.
9. What pricing options are available for accessing the report?
Pricing options include single-user, multi-user, and enterprise licenses priced at USD 3800, USD 4500, and USD 5800 respectively.
10. Is the market size provided in terms of value or volume?
The market size is provided in terms of value, measured in Million.
11. Are there any specific market keywords associated with the report?
Yes, the market keyword associated with the report is "U.S Digital Lending Industry," which aids in identifying and referencing the specific market segment covered.
12. How do I determine which pricing option suits my needs best?
The pricing options vary based on user requirements and access needs. Individual users may opt for single-user licenses, while businesses requiring broader access may choose multi-user or enterprise licenses for cost-effective access to the report.
13. Are there any additional resources or data provided in the U.S Digital Lending Industry report?
While the report offers comprehensive insights, it's advisable to review the specific contents or supplementary materials provided to ascertain if additional resources or data are available.
14. How can I stay updated on further developments or reports in the U.S Digital Lending Industry?
To stay informed about further developments, trends, and reports in the U.S Digital Lending Industry, consider subscribing to industry newsletters, following relevant companies and organizations, or regularly checking reputable industry news sources and publications.
Methodology
Step 1 - Identification of Relevant Samples Size from Population Database


Step 2 - Approaches for Defining Global Market Size (Value, Volume* & Price*)

Note*: In applicable scenarios
Step 3 - Data Sources
Primary Research
- Web Analytics
- Survey Reports
- Research Institute
- Latest Research Reports
- Opinion Leaders
Secondary Research
- Annual Reports
- White Paper
- Latest Press Release
- Industry Association
- Paid Database
- Investor Presentations

Step 4 - Data Triangulation
Involves using different sources of information in order to increase the validity of a study
These sources are likely to be stakeholders in a program - participants, other researchers, program staff, other community members, and so on.
Then we put all data in single framework & apply various statistical tools to find out the dynamic on the market.
During the analysis stage, feedback from the stakeholder groups would be compared to determine areas of agreement as well as areas of divergence
