

Key Insights
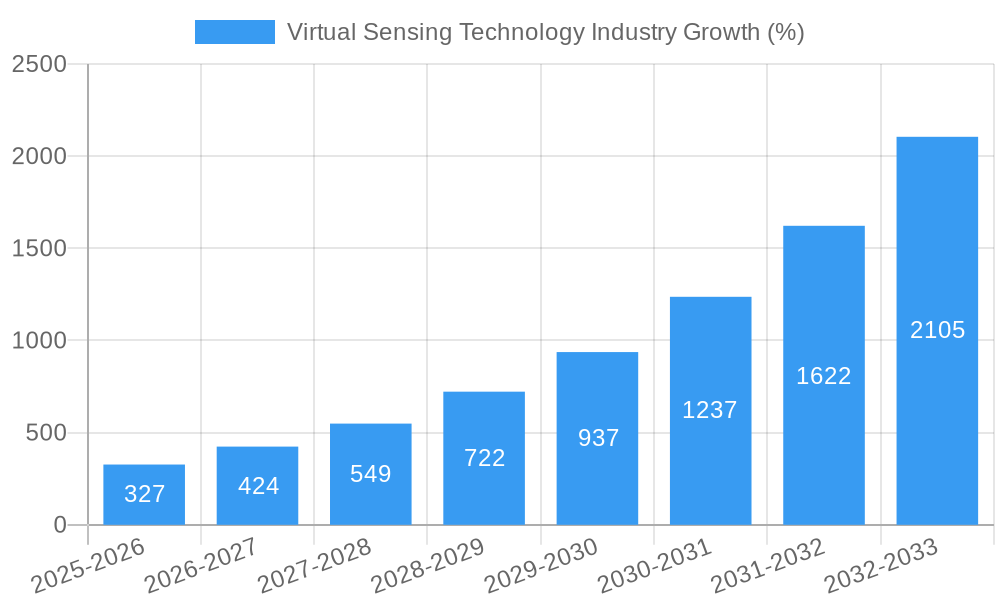
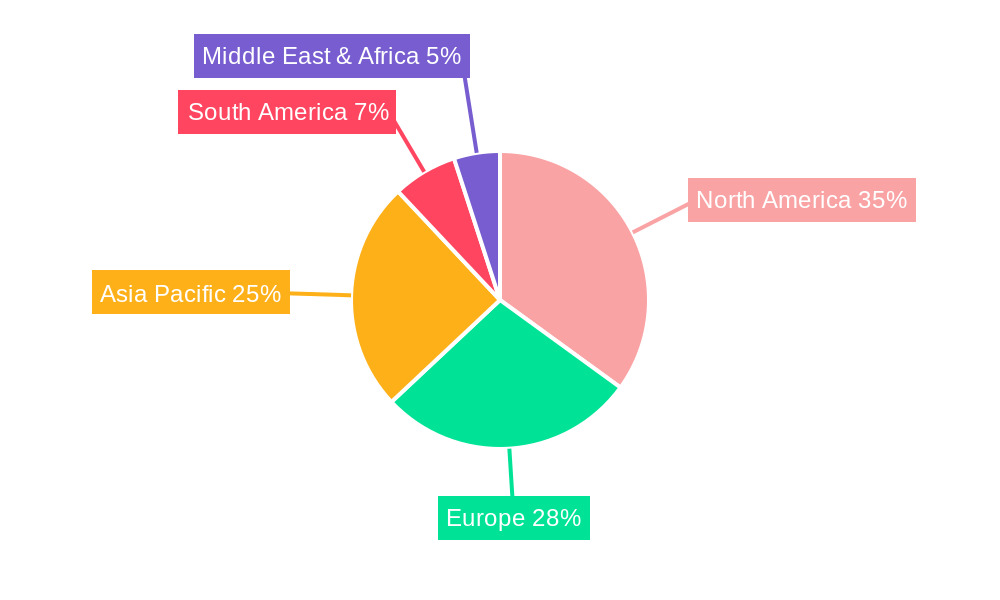
The virtual sensing technology market is experiencing robust growth, projected to reach $1.04 billion in 2025 and exhibiting a remarkable Compound Annual Growth Rate (CAGR) of 31.38% from 2025 to 2033. This expansion is driven by several key factors. The increasing adoption of IoT (Internet of Things) devices across diverse sectors like healthcare, manufacturing, and smart buildings fuels demand for efficient and cost-effective sensing solutions. Advancements in sensor technology, particularly in wearable and vehicle-integrated sensors, are enhancing accuracy, reliability, and data processing capabilities. The growing need for predictive maintenance in industrial settings and remote patient monitoring in healthcare are further stimulating market growth. Furthermore, stringent government regulations promoting energy efficiency and safety in buildings are driving the adoption of virtual sensing solutions within the construction industry. Competitive landscapes are shaped by established players like Siemens and Cisco alongside innovative technology providers, fostering both consolidation and innovation within the sector. The market is segmented based on sensor type (wearable, vehicle, building), application (healthcare, manufacturing, smart buildings), and end-use industry (healthcare, manufacturing, transportation), allowing for targeted market penetration strategies. Regional variations exist, with North America and Asia Pacific expected to dominate market share due to strong technological advancements and substantial investments in infrastructure.
The forecast period (2025-2033) promises further expansion, influenced by continuous technological breakthroughs, particularly in artificial intelligence (AI) and machine learning (ML) integration within virtual sensing systems. These advancements enhance data analysis, predictive capabilities, and overall system efficiency. While challenges remain in terms of data security, interoperability issues across different platforms, and the need for skilled professionals to manage and interpret complex datasets, the market is well-positioned for continued significant growth fueled by the ongoing digital transformation across industries and a growing focus on data-driven decision-making. The long-term outlook is positive, with virtual sensing technology poised to become an integral part of smart infrastructure and advanced industrial automation.

Virtual Sensing Technology Industry: A Comprehensive Market Report (2019-2033)
This in-depth report provides a comprehensive analysis of the Virtual Sensing Technology industry, covering market size, growth drivers, key players, and future trends. With a study period spanning 2019-2033, a base year of 2025, and a forecast period of 2025-2033, this report offers invaluable insights for stakeholders across the healthcare, manufacturing, transportation, and smart building sectors. The report leverages data from the historical period (2019-2024) to project future market dynamics, providing actionable intelligence for strategic decision-making. The global market is expected to reach xx Million by 2033, exhibiting a CAGR of xx%.
Virtual Sensing Technology Industry Market Concentration & Dynamics
The virtual sensing technology market exhibits a moderately concentrated landscape, with several major players holding significant market share. However, the presence of numerous smaller, innovative firms contributes to a dynamic competitive environment. The market is characterized by a robust innovation ecosystem, fueled by advancements in AI, machine learning, and sensor technologies. Regulatory frameworks, particularly concerning data privacy and safety standards, play a crucial role in shaping market dynamics. Substitute products, such as traditional sensors, pose a competitive challenge, although the advantages of virtual sensing – cost-effectiveness, enhanced accuracy, and reduced maintenance – are driving market adoption. End-user trends indicate a strong preference for integrated, smart solutions that leverage virtual sensing data for improved efficiency and decision-making.
Mergers and acquisitions (M&A) activity has been relatively high in recent years, reflecting industry consolidation and the pursuit of technological capabilities. Estimated M&A deal counts totalled xx in 2024, resulting in a market share realignment among key players. For example, the integration of Unity’s Digital Twin Professional Services arm into Capgemini demonstrates the consolidation trend within the virtual sensing ecosystem.
- Market Concentration: Moderately concentrated, with several leading players holding significant share.
- Innovation Ecosystem: Robust, driven by advancements in AI, ML, and sensor technologies.
- Regulatory Frameworks: Increasingly important, focusing on data privacy and safety.
- Substitute Products: Traditional sensors, posing a competitive challenge.
- End-User Trends: Preference for integrated, smart solutions leveraging virtual sensing data.
- M&A Activity: Significant activity reflecting industry consolidation and technological acquisitions.
Virtual Sensing Technology Industry Insights & Trends
The virtual sensing technology market is experiencing rapid growth, driven by factors such as the increasing demand for automation across various industries, rising adoption of IoT devices, and the need for real-time data analysis. The market size in 2025 is estimated at xx Million, projected to reach xx Million by 2033, exhibiting a significant CAGR. Technological advancements, particularly in areas like AI-powered sensor fusion and edge computing, are revolutionizing the capabilities of virtual sensing systems. Evolving consumer behaviors, with a growing preference for seamless, connected experiences, are further fueling the demand for sophisticated virtual sensing solutions. The integration of virtual sensing technologies with digital twin platforms is expected to propel market growth in the manufacturing and smart building segments. The market is also witnessing an increase in demand for wearable sensors in the healthcare sector for personalized health monitoring. The implementation of 5G network infrastructure is also a key trend expected to provide significant enhancements in speed and connectivity for the data-intensive nature of this technology.
Key Markets & Segments Leading Virtual Sensing Technology Industry
The global virtual sensing technology market is driven by strong growth across various segments and regions. While the precise dominant region and country require further analysis for precise determination (indicated as xx), the healthcare sector demonstrates robust growth across all segments.
Dominant Segments & Drivers:
- Sensor Type: Wearable sensors are experiencing rapid growth, driven by the rising popularity of fitness trackers and smartwatches in the healthcare sector and the automotive industry with features like advanced driver-assistance systems (ADAS).
- Application: The healthcare and manufacturing sectors are key drivers. Healthcare applications focus on remote patient monitoring, while manufacturing utilizes virtual sensing for predictive maintenance and process optimization. Smart building applications are increasingly integrated with building management systems (BMS), driving adoption for energy efficiency and enhanced safety.
- End-Use Industry: The healthcare, manufacturing and transportation sectors represent the largest end-use markets. Growth in these sectors is fueled by factors like rising healthcare expenditure, automation in manufacturing, and the growing need for improved safety and efficiency in transportation.
Detailed Dominance Analysis: While specific country dominance requires further data analysis, the prevalence of technological advancements and digital transformation across North America and parts of Asia is expected to propel growth in these regions. The continued growth and investment in smart city initiatives also suggest that regions with significant urban development will be key drivers of virtual sensing technology adoption.
Virtual Sensing Technology Industry Product Developments
Recent product innovations in virtual sensing technology focus on enhancing accuracy, reducing power consumption, and improving integration with existing systems. Advancements in AI-powered sensor fusion allow for more precise data analysis and better decision-making. Miniaturization of sensors and the development of energy-efficient designs are extending the lifespan of battery-powered devices and enhancing usability across various applications. The growing incorporation of virtual sensing technologies into digital twin platforms is providing companies with real-time insights into operational efficiency and predictive maintenance capabilities, providing a significant competitive edge.
Challenges in the Virtual Sensing Technology Industry Market
The virtual sensing technology market faces several challenges. Regulatory hurdles concerning data privacy and cybersecurity are significant, potentially hindering market expansion. Supply chain disruptions, particularly concerning the availability of specialized components, can impact production and timely delivery. Intense competition among established players and new entrants creates pricing pressures and necessitates continuous innovation to maintain a competitive edge. These factors can lead to significant project delays and cost overruns. Accurate quantifiable impacts require further data analysis which would be included in the final report.
Forces Driving Virtual Sensing Technology Industry Growth
Technological advancements in AI, machine learning, and sensor technology are key drivers of market growth. Increasing demand for automation and digitization across various industries, particularly healthcare, manufacturing, and transportation, fuels the adoption of virtual sensing solutions. Supportive government policies and initiatives promoting the development and deployment of smart technologies further accelerate market expansion. The rising adoption of IoT devices and the need for real-time data analysis further contribute to strong market growth. For instance, the integration of virtual sensing into ADAS systems in vehicles showcases one of the key growth drivers.
Long-Term Growth Catalysts in the Virtual Sensing Technology Industry
Long-term growth will be driven by continued innovations in sensor technology, resulting in smaller, more energy-efficient, and more accurate sensors. Strategic partnerships between technology providers and end-users will accelerate the adoption of virtual sensing solutions. Market expansion into emerging economies with growing infrastructure development and urbanization will create new opportunities for growth. Investment in research and development focused on the integration of virtual sensing technologies with digital twin platforms is also expected to contribute significantly to long-term growth.
Emerging Opportunities in Virtual Sensing Technology Industry
The integration of virtual sensing with extended reality (XR) technologies offers exciting new opportunities for immersive training and remote collaboration. The development of advanced sensor fusion techniques to combine data from multiple sources will enhance the accuracy and reliability of virtual sensing systems. The emergence of new applications in areas like precision agriculture and environmental monitoring will further expand the market reach. Furthermore, the increased focus on data security and privacy in the industry would also lead to further developments.
Leading Players in the Virtual Sensing Technology Industry Sector
- Körber AG
- Modelway SRL
- Elliptic Labs ASA
- Cisco Systems Inc
- Siemens AG
- Schneider Electric SE
- Andata Lt
- Intelli Dynamics (Biocomp Systems Inc )
- General Electric Company
Key Milestones in Virtual Sensing Technology Industry
- March 2024: Elliptic Labs announced the deployment of over 500 million devices and the shipping of its AI Virtual Proximity Sensor INNER BEAUTY on the Lava Blaze Curve smartphone, signifying a major milestone in market penetration.
- February 2024: Capgemini and Unity's expanded strategic alliance, creating one of the largest pools of Unity enterprise developers, accelerating the development and deployment of real-time 3D visualization software for industrial digital twin applications, impacting the market through increased development capacity.
Strategic Outlook for Virtual Sensing Technology Market
The future of the virtual sensing technology market is bright, with significant growth potential driven by technological advancements, increasing industry adoption, and expansion into new applications. Strategic partnerships, investments in R&D, and the development of innovative solutions will be key to success in this rapidly evolving market. The focus on integrating virtual sensing with other technologies like AI, IoT, and digital twins will create significant value across various sectors, unlocking new levels of efficiency and creating opportunities for companies to gain a competitive edge.
Virtual Sensing Technology Industry Segmentation
-
1. Deployment Type
- 1.1. Cloud
- 1.2. On-premise
-
2. End-user Industry
- 2.1. Oil and Gas
- 2.2. Manufacturing
- 2.3. Transportation and Automotive
- 2.4. Metal and Mining
- 2.5. Aerospace and Defense
- 2.6. Electronics and Consumer Technologies
- 2.7. Other End User Industries
- 3. Market Segmentation and Target Audience
- 4. Value Proposition
- 5. Distribution Channel Strategies
- 6. Competitive Landscape
- 7. Addressing Market Challenges
- 8. Conclusion and Recommendations
Virtual Sensing Technology Industry Segmentation By Geography
-
1. North America
- 1.1. United States
- 1.2. Canada
-
2. Europe
- 2.1. United Kingdom
- 2.2. Germany
- 2.3. France
- 2.4. Italy
-
3. Asia
- 3.1. China
- 3.2. Japan
- 3.3. India
- 4. Australia and New Zealand
- 5. Latin America
- 6. Middle East and Africa
Virtual Sensing Technology Industry REPORT HIGHLIGHTS
| Aspects | Details |
|---|---|
| Study Period | 2019-2033 |
| Base Year | 2024 |
| Estimated Year | 2025 |
| Forecast Period | 2025-2033 |
| Historical Period | 2019-2024 |
| Growth Rate | CAGR of 31.38% from 2019-2033 |
| Segmentation |
|
Table of Contents
- 1. Introduction
- 1.1. Research Scope
- 1.2. Market Segmentation
- 1.3. Research Methodology
- 1.4. Definitions and Assumptions
- 2. Executive Summary
- 2.1. Introduction
- 3. Market Dynamics
- 3.1. Introduction
- 3.2. Market Drivers
- 3.2.1. Increasing Adoption of IoT and Cloud Platform Is Expected to Drive the Market; Growing Need For Enhanced Cost-effectiveness and Operational Efficiency in Manufacturing
- 3.3. Market Restrains
- 3.3.1. High Deployment and Maintenance Cost
- 3.4. Market Trends
- 3.4.1. Transportation and Automotive Industry to be the Fastest Growing End User
- 4. Market Factor Analysis
- 4.1. Porters Five Forces
- 4.2. Supply/Value Chain
- 4.3. PESTEL analysis
- 4.4. Market Entropy
- 4.5. Patent/Trademark Analysis
- 5. Global Virtual Sensing Technology Industry Analysis, Insights and Forecast, 2019-2031
- 5.1. Market Analysis, Insights and Forecast - by Deployment Type
- 5.1.1. Cloud
- 5.1.2. On-premise
- 5.2. Market Analysis, Insights and Forecast - by End-user Industry
- 5.2.1. Oil and Gas
- 5.2.2. Manufacturing
- 5.2.3. Transportation and Automotive
- 5.2.4. Metal and Mining
- 5.2.5. Aerospace and Defense
- 5.2.6. Electronics and Consumer Technologies
- 5.2.7. Other End User Industries
- 5.3. Market Analysis, Insights and Forecast - by Market Segmentation and Target Audience
- 5.4. Market Analysis, Insights and Forecast - by Value Proposition
- 5.5. Market Analysis, Insights and Forecast - by Distribution Channel Strategies
- 5.6. Market Analysis, Insights and Forecast - by Competitive Landscape
- 5.7. Market Analysis, Insights and Forecast - by Addressing Market Challenges
- 5.8. Market Analysis, Insights and Forecast - by Conclusion and Recommendations
- 5.9. Market Analysis, Insights and Forecast - by Region
- 5.9.1. North America
- 5.9.2. Europe
- 5.9.3. Asia
- 5.9.4. Australia and New Zealand
- 5.9.5. Latin America
- 5.9.6. Middle East and Africa
- 5.1. Market Analysis, Insights and Forecast - by Deployment Type
- 6. North America Virtual Sensing Technology Industry Analysis, Insights and Forecast, 2019-2031
- 6.1. Market Analysis, Insights and Forecast - by Deployment Type
- 6.1.1. Cloud
- 6.1.2. On-premise
- 6.2. Market Analysis, Insights and Forecast - by End-user Industry
- 6.2.1. Oil and Gas
- 6.2.2. Manufacturing
- 6.2.3. Transportation and Automotive
- 6.2.4. Metal and Mining
- 6.2.5. Aerospace and Defense
- 6.2.6. Electronics and Consumer Technologies
- 6.2.7. Other End User Industries
- 6.3. Market Analysis, Insights and Forecast - by Market Segmentation and Target Audience
- 6.4. Market Analysis, Insights and Forecast - by Value Proposition
- 6.5. Market Analysis, Insights and Forecast - by Distribution Channel Strategies
- 6.6. Market Analysis, Insights and Forecast - by Competitive Landscape
- 6.7. Market Analysis, Insights and Forecast - by Addressing Market Challenges
- 6.8. Market Analysis, Insights and Forecast - by Conclusion and Recommendations
- 6.1. Market Analysis, Insights and Forecast - by Deployment Type
- 7. Europe Virtual Sensing Technology Industry Analysis, Insights and Forecast, 2019-2031
- 7.1. Market Analysis, Insights and Forecast - by Deployment Type
- 7.1.1. Cloud
- 7.1.2. On-premise
- 7.2. Market Analysis, Insights and Forecast - by End-user Industry
- 7.2.1. Oil and Gas
- 7.2.2. Manufacturing
- 7.2.3. Transportation and Automotive
- 7.2.4. Metal and Mining
- 7.2.5. Aerospace and Defense
- 7.2.6. Electronics and Consumer Technologies
- 7.2.7. Other End User Industries
- 7.3. Market Analysis, Insights and Forecast - by Market Segmentation and Target Audience
- 7.4. Market Analysis, Insights and Forecast - by Value Proposition
- 7.5. Market Analysis, Insights and Forecast - by Distribution Channel Strategies
- 7.6. Market Analysis, Insights and Forecast - by Competitive Landscape
- 7.7. Market Analysis, Insights and Forecast - by Addressing Market Challenges
- 7.8. Market Analysis, Insights and Forecast - by Conclusion and Recommendations
- 7.1. Market Analysis, Insights and Forecast - by Deployment Type
- 8. Asia Virtual Sensing Technology Industry Analysis, Insights and Forecast, 2019-2031
- 8.1. Market Analysis, Insights and Forecast - by Deployment Type
- 8.1.1. Cloud
- 8.1.2. On-premise
- 8.2. Market Analysis, Insights and Forecast - by End-user Industry
- 8.2.1. Oil and Gas
- 8.2.2. Manufacturing
- 8.2.3. Transportation and Automotive
- 8.2.4. Metal and Mining
- 8.2.5. Aerospace and Defense
- 8.2.6. Electronics and Consumer Technologies
- 8.2.7. Other End User Industries
- 8.3. Market Analysis, Insights and Forecast - by Market Segmentation and Target Audience
- 8.4. Market Analysis, Insights and Forecast - by Value Proposition
- 8.5. Market Analysis, Insights and Forecast - by Distribution Channel Strategies
- 8.6. Market Analysis, Insights and Forecast - by Competitive Landscape
- 8.7. Market Analysis, Insights and Forecast - by Addressing Market Challenges
- 8.8. Market Analysis, Insights and Forecast - by Conclusion and Recommendations
- 8.1. Market Analysis, Insights and Forecast - by Deployment Type
- 9. Australia and New Zealand Virtual Sensing Technology Industry Analysis, Insights and Forecast, 2019-2031
- 9.1. Market Analysis, Insights and Forecast - by Deployment Type
- 9.1.1. Cloud
- 9.1.2. On-premise
- 9.2. Market Analysis, Insights and Forecast - by End-user Industry
- 9.2.1. Oil and Gas
- 9.2.2. Manufacturing
- 9.2.3. Transportation and Automotive
- 9.2.4. Metal and Mining
- 9.2.5. Aerospace and Defense
- 9.2.6. Electronics and Consumer Technologies
- 9.2.7. Other End User Industries
- 9.3. Market Analysis, Insights and Forecast - by Market Segmentation and Target Audience
- 9.4. Market Analysis, Insights and Forecast - by Value Proposition
- 9.5. Market Analysis, Insights and Forecast - by Distribution Channel Strategies
- 9.6. Market Analysis, Insights and Forecast - by Competitive Landscape
- 9.7. Market Analysis, Insights and Forecast - by Addressing Market Challenges
- 9.8. Market Analysis, Insights and Forecast - by Conclusion and Recommendations
- 9.1. Market Analysis, Insights and Forecast - by Deployment Type
- 10. Latin America Virtual Sensing Technology Industry Analysis, Insights and Forecast, 2019-2031
- 10.1. Market Analysis, Insights and Forecast - by Deployment Type
- 10.1.1. Cloud
- 10.1.2. On-premise
- 10.2. Market Analysis, Insights and Forecast - by End-user Industry
- 10.2.1. Oil and Gas
- 10.2.2. Manufacturing
- 10.2.3. Transportation and Automotive
- 10.2.4. Metal and Mining
- 10.2.5. Aerospace and Defense
- 10.2.6. Electronics and Consumer Technologies
- 10.2.7. Other End User Industries
- 10.3. Market Analysis, Insights and Forecast - by Market Segmentation and Target Audience
- 10.4. Market Analysis, Insights and Forecast - by Value Proposition
- 10.5. Market Analysis, Insights and Forecast - by Distribution Channel Strategies
- 10.6. Market Analysis, Insights and Forecast - by Competitive Landscape
- 10.7. Market Analysis, Insights and Forecast - by Addressing Market Challenges
- 10.8. Market Analysis, Insights and Forecast - by Conclusion and Recommendations
- 10.1. Market Analysis, Insights and Forecast - by Deployment Type
- 11. Middle East and Africa Virtual Sensing Technology Industry Analysis, Insights and Forecast, 2019-2031
- 11.1. Market Analysis, Insights and Forecast - by Deployment Type
- 11.1.1. Cloud
- 11.1.2. On-premise
- 11.2. Market Analysis, Insights and Forecast - by End-user Industry
- 11.2.1. Oil and Gas
- 11.2.2. Manufacturing
- 11.2.3. Transportation and Automotive
- 11.2.4. Metal and Mining
- 11.2.5. Aerospace and Defense
- 11.2.6. Electronics and Consumer Technologies
- 11.2.7. Other End User Industries
- 11.3. Market Analysis, Insights and Forecast - by Market Segmentation and Target Audience
- 11.4. Market Analysis, Insights and Forecast - by Value Proposition
- 11.5. Market Analysis, Insights and Forecast - by Distribution Channel Strategies
- 11.6. Market Analysis, Insights and Forecast - by Competitive Landscape
- 11.7. Market Analysis, Insights and Forecast - by Addressing Market Challenges
- 11.8. Market Analysis, Insights and Forecast - by Conclusion and Recommendations
- 11.1. Market Analysis, Insights and Forecast - by Deployment Type
- 12. North America Virtual Sensing Technology Industry Analysis, Insights and Forecast, 2019-2031
- 12.1. Market Analysis, Insights and Forecast - By Country/Sub-region
- 12.1.1 United States
- 12.1.2 Canada
- 13. Asia Pacific Virtual Sensing Technology Industry Analysis, Insights and Forecast, 2019-2031
- 13.1. Market Analysis, Insights and Forecast - By Country/Sub-region
- 13.1.1 China
- 13.1.2 Japan
- 13.1.3 India
- 13.1.4 South Korea
- 13.1.5 Taiwan
- 13.1.6 Australia
- 13.1.7 Rest of Asia-Pacific
- 14. Europe Virtual Sensing Technology Industry Analysis, Insights and Forecast, 2019-2031
- 14.1. Market Analysis, Insights and Forecast - By Country/Sub-region
- 14.1.1 Germany
- 14.1.2 France
- 14.1.3 Italy
- 14.1.4 United Kingdom
- 14.1.5 Netherlands
- 14.1.6 Sweden
- 14.1.7 Rest of Europe
- 15. South America Virtual Sensing Technology Industry Analysis, Insights and Forecast, 2019-2031
- 15.1. Market Analysis, Insights and Forecast - By Country/Sub-region
- 15.1.1 Brazil
- 15.1.2 Argentina
- 15.1.3 Rest of South America
- 16. Middle East & Africa Virtual Sensing Technology Industry Analysis, Insights and Forecast, 2019-2031
- 16.1. Market Analysis, Insights and Forecast - By Country/Sub-region
- 16.1.1 UAE
- 16.1.2 South Africa
- 16.1.3 Saudi Arabia
- 16.1.4 Rest of MEA
- 17. Competitive Analysis
- 17.1. Global Market Share Analysis 2024
- 17.2. Company Profiles
- 17.2.1 Körber AG
- 17.2.1.1. Overview
- 17.2.1.2. Products
- 17.2.1.3. SWOT Analysis
- 17.2.1.4. Recent Developments
- 17.2.1.5. Financials (Based on Availability)
- 17.2.2 Modelway SRL
- 17.2.2.1. Overview
- 17.2.2.2. Products
- 17.2.2.3. SWOT Analysis
- 17.2.2.4. Recent Developments
- 17.2.2.5. Financials (Based on Availability)
- 17.2.3 Elliptic Labs ASA
- 17.2.3.1. Overview
- 17.2.3.2. Products
- 17.2.3.3. SWOT Analysis
- 17.2.3.4. Recent Developments
- 17.2.3.5. Financials (Based on Availability)
- 17.2.4 Cisco Systems Inc
- 17.2.4.1. Overview
- 17.2.4.2. Products
- 17.2.4.3. SWOT Analysis
- 17.2.4.4. Recent Developments
- 17.2.4.5. Financials (Based on Availability)
- 17.2.5 Siemens AG
- 17.2.5.1. Overview
- 17.2.5.2. Products
- 17.2.5.3. SWOT Analysis
- 17.2.5.4. Recent Developments
- 17.2.5.5. Financials (Based on Availability)
- 17.2.6 Schneider Electric SE
- 17.2.6.1. Overview
- 17.2.6.2. Products
- 17.2.6.3. SWOT Analysis
- 17.2.6.4. Recent Developments
- 17.2.6.5. Financials (Based on Availability)
- 17.2.7 Andata Lt
- 17.2.7.1. Overview
- 17.2.7.2. Products
- 17.2.7.3. SWOT Analysis
- 17.2.7.4. Recent Developments
- 17.2.7.5. Financials (Based on Availability)
- 17.2.8 Intelli Dynamics (Biocomp Systems Inc )
- 17.2.8.1. Overview
- 17.2.8.2. Products
- 17.2.8.3. SWOT Analysis
- 17.2.8.4. Recent Developments
- 17.2.8.5. Financials (Based on Availability)
- 17.2.9 General Electric Company
- 17.2.9.1. Overview
- 17.2.9.2. Products
- 17.2.9.3. SWOT Analysis
- 17.2.9.4. Recent Developments
- 17.2.9.5. Financials (Based on Availability)
- 17.2.1 Körber AG
List of Figures
- Figure 1: Global Virtual Sensing Technology Industry Revenue Breakdown (Million, %) by Region 2024 & 2032
- Figure 2: North America Virtual Sensing Technology Industry Revenue (Million), by Country 2024 & 2032
- Figure 3: North America Virtual Sensing Technology Industry Revenue Share (%), by Country 2024 & 2032
- Figure 4: Asia Pacific Virtual Sensing Technology Industry Revenue (Million), by Country 2024 & 2032
- Figure 5: Asia Pacific Virtual Sensing Technology Industry Revenue Share (%), by Country 2024 & 2032
- Figure 6: Europe Virtual Sensing Technology Industry Revenue (Million), by Country 2024 & 2032
- Figure 7: Europe Virtual Sensing Technology Industry Revenue Share (%), by Country 2024 & 2032
- Figure 8: South America Virtual Sensing Technology Industry Revenue (Million), by Country 2024 & 2032
- Figure 9: South America Virtual Sensing Technology Industry Revenue Share (%), by Country 2024 & 2032
- Figure 10: Middle East & Africa Virtual Sensing Technology Industry Revenue (Million), by Country 2024 & 2032
- Figure 11: Middle East & Africa Virtual Sensing Technology Industry Revenue Share (%), by Country 2024 & 2032
- Figure 12: North America Virtual Sensing Technology Industry Revenue (Million), by Deployment Type 2024 & 2032
- Figure 13: North America Virtual Sensing Technology Industry Revenue Share (%), by Deployment Type 2024 & 2032
- Figure 14: North America Virtual Sensing Technology Industry Revenue (Million), by End-user Industry 2024 & 2032
- Figure 15: North America Virtual Sensing Technology Industry Revenue Share (%), by End-user Industry 2024 & 2032
- Figure 16: North America Virtual Sensing Technology Industry Revenue (Million), by Market Segmentation and Target Audience 2024 & 2032
- Figure 17: North America Virtual Sensing Technology Industry Revenue Share (%), by Market Segmentation and Target Audience 2024 & 2032
- Figure 18: North America Virtual Sensing Technology Industry Revenue (Million), by Value Proposition 2024 & 2032
- Figure 19: North America Virtual Sensing Technology Industry Revenue Share (%), by Value Proposition 2024 & 2032
- Figure 20: North America Virtual Sensing Technology Industry Revenue (Million), by Distribution Channel Strategies 2024 & 2032
- Figure 21: North America Virtual Sensing Technology Industry Revenue Share (%), by Distribution Channel Strategies 2024 & 2032
- Figure 22: North America Virtual Sensing Technology Industry Revenue (Million), by Competitive Landscape 2024 & 2032
- Figure 23: North America Virtual Sensing Technology Industry Revenue Share (%), by Competitive Landscape 2024 & 2032
- Figure 24: North America Virtual Sensing Technology Industry Revenue (Million), by Addressing Market Challenges 2024 & 2032
- Figure 25: North America Virtual Sensing Technology Industry Revenue Share (%), by Addressing Market Challenges 2024 & 2032
- Figure 26: North America Virtual Sensing Technology Industry Revenue (Million), by Conclusion and Recommendations 2024 & 2032
- Figure 27: North America Virtual Sensing Technology Industry Revenue Share (%), by Conclusion and Recommendations 2024 & 2032
- Figure 28: North America Virtual Sensing Technology Industry Revenue (Million), by Country 2024 & 2032
- Figure 29: North America Virtual Sensing Technology Industry Revenue Share (%), by Country 2024 & 2032
- Figure 30: Europe Virtual Sensing Technology Industry Revenue (Million), by Deployment Type 2024 & 2032
- Figure 31: Europe Virtual Sensing Technology Industry Revenue Share (%), by Deployment Type 2024 & 2032
- Figure 32: Europe Virtual Sensing Technology Industry Revenue (Million), by End-user Industry 2024 & 2032
- Figure 33: Europe Virtual Sensing Technology Industry Revenue Share (%), by End-user Industry 2024 & 2032
- Figure 34: Europe Virtual Sensing Technology Industry Revenue (Million), by Market Segmentation and Target Audience 2024 & 2032
- Figure 35: Europe Virtual Sensing Technology Industry Revenue Share (%), by Market Segmentation and Target Audience 2024 & 2032
- Figure 36: Europe Virtual Sensing Technology Industry Revenue (Million), by Value Proposition 2024 & 2032
- Figure 37: Europe Virtual Sensing Technology Industry Revenue Share (%), by Value Proposition 2024 & 2032
- Figure 38: Europe Virtual Sensing Technology Industry Revenue (Million), by Distribution Channel Strategies 2024 & 2032
- Figure 39: Europe Virtual Sensing Technology Industry Revenue Share (%), by Distribution Channel Strategies 2024 & 2032
- Figure 40: Europe Virtual Sensing Technology Industry Revenue (Million), by Competitive Landscape 2024 & 2032
- Figure 41: Europe Virtual Sensing Technology Industry Revenue Share (%), by Competitive Landscape 2024 & 2032
- Figure 42: Europe Virtual Sensing Technology Industry Revenue (Million), by Addressing Market Challenges 2024 & 2032
- Figure 43: Europe Virtual Sensing Technology Industry Revenue Share (%), by Addressing Market Challenges 2024 & 2032
- Figure 44: Europe Virtual Sensing Technology Industry Revenue (Million), by Conclusion and Recommendations 2024 & 2032
- Figure 45: Europe Virtual Sensing Technology Industry Revenue Share (%), by Conclusion and Recommendations 2024 & 2032
- Figure 46: Europe Virtual Sensing Technology Industry Revenue (Million), by Country 2024 & 2032
- Figure 47: Europe Virtual Sensing Technology Industry Revenue Share (%), by Country 2024 & 2032
- Figure 48: Asia Virtual Sensing Technology Industry Revenue (Million), by Deployment Type 2024 & 2032
- Figure 49: Asia Virtual Sensing Technology Industry Revenue Share (%), by Deployment Type 2024 & 2032
- Figure 50: Asia Virtual Sensing Technology Industry Revenue (Million), by End-user Industry 2024 & 2032
- Figure 51: Asia Virtual Sensing Technology Industry Revenue Share (%), by End-user Industry 2024 & 2032
- Figure 52: Asia Virtual Sensing Technology Industry Revenue (Million), by Market Segmentation and Target Audience 2024 & 2032
- Figure 53: Asia Virtual Sensing Technology Industry Revenue Share (%), by Market Segmentation and Target Audience 2024 & 2032
- Figure 54: Asia Virtual Sensing Technology Industry Revenue (Million), by Value Proposition 2024 & 2032
- Figure 55: Asia Virtual Sensing Technology Industry Revenue Share (%), by Value Proposition 2024 & 2032
- Figure 56: Asia Virtual Sensing Technology Industry Revenue (Million), by Distribution Channel Strategies 2024 & 2032
- Figure 57: Asia Virtual Sensing Technology Industry Revenue Share (%), by Distribution Channel Strategies 2024 & 2032
- Figure 58: Asia Virtual Sensing Technology Industry Revenue (Million), by Competitive Landscape 2024 & 2032
- Figure 59: Asia Virtual Sensing Technology Industry Revenue Share (%), by Competitive Landscape 2024 & 2032
- Figure 60: Asia Virtual Sensing Technology Industry Revenue (Million), by Addressing Market Challenges 2024 & 2032
- Figure 61: Asia Virtual Sensing Technology Industry Revenue Share (%), by Addressing Market Challenges 2024 & 2032
- Figure 62: Asia Virtual Sensing Technology Industry Revenue (Million), by Conclusion and Recommendations 2024 & 2032
- Figure 63: Asia Virtual Sensing Technology Industry Revenue Share (%), by Conclusion and Recommendations 2024 & 2032
- Figure 64: Asia Virtual Sensing Technology Industry Revenue (Million), by Country 2024 & 2032
- Figure 65: Asia Virtual Sensing Technology Industry Revenue Share (%), by Country 2024 & 2032
- Figure 66: Australia and New Zealand Virtual Sensing Technology Industry Revenue (Million), by Deployment Type 2024 & 2032
- Figure 67: Australia and New Zealand Virtual Sensing Technology Industry Revenue Share (%), by Deployment Type 2024 & 2032
- Figure 68: Australia and New Zealand Virtual Sensing Technology Industry Revenue (Million), by End-user Industry 2024 & 2032
- Figure 69: Australia and New Zealand Virtual Sensing Technology Industry Revenue Share (%), by End-user Industry 2024 & 2032
- Figure 70: Australia and New Zealand Virtual Sensing Technology Industry Revenue (Million), by Market Segmentation and Target Audience 2024 & 2032
- Figure 71: Australia and New Zealand Virtual Sensing Technology Industry Revenue Share (%), by Market Segmentation and Target Audience 2024 & 2032
- Figure 72: Australia and New Zealand Virtual Sensing Technology Industry Revenue (Million), by Value Proposition 2024 & 2032
- Figure 73: Australia and New Zealand Virtual Sensing Technology Industry Revenue Share (%), by Value Proposition 2024 & 2032
- Figure 74: Australia and New Zealand Virtual Sensing Technology Industry Revenue (Million), by Distribution Channel Strategies 2024 & 2032
- Figure 75: Australia and New Zealand Virtual Sensing Technology Industry Revenue Share (%), by Distribution Channel Strategies 2024 & 2032
- Figure 76: Australia and New Zealand Virtual Sensing Technology Industry Revenue (Million), by Competitive Landscape 2024 & 2032
- Figure 77: Australia and New Zealand Virtual Sensing Technology Industry Revenue Share (%), by Competitive Landscape 2024 & 2032
- Figure 78: Australia and New Zealand Virtual Sensing Technology Industry Revenue (Million), by Addressing Market Challenges 2024 & 2032
- Figure 79: Australia and New Zealand Virtual Sensing Technology Industry Revenue Share (%), by Addressing Market Challenges 2024 & 2032
- Figure 80: Australia and New Zealand Virtual Sensing Technology Industry Revenue (Million), by Conclusion and Recommendations 2024 & 2032
- Figure 81: Australia and New Zealand Virtual Sensing Technology Industry Revenue Share (%), by Conclusion and Recommendations 2024 & 2032
- Figure 82: Australia and New Zealand Virtual Sensing Technology Industry Revenue (Million), by Country 2024 & 2032
- Figure 83: Australia and New Zealand Virtual Sensing Technology Industry Revenue Share (%), by Country 2024 & 2032
- Figure 84: Latin America Virtual Sensing Technology Industry Revenue (Million), by Deployment Type 2024 & 2032
- Figure 85: Latin America Virtual Sensing Technology Industry Revenue Share (%), by Deployment Type 2024 & 2032
- Figure 86: Latin America Virtual Sensing Technology Industry Revenue (Million), by End-user Industry 2024 & 2032
- Figure 87: Latin America Virtual Sensing Technology Industry Revenue Share (%), by End-user Industry 2024 & 2032
- Figure 88: Latin America Virtual Sensing Technology Industry Revenue (Million), by Market Segmentation and Target Audience 2024 & 2032
- Figure 89: Latin America Virtual Sensing Technology Industry Revenue Share (%), by Market Segmentation and Target Audience 2024 & 2032
- Figure 90: Latin America Virtual Sensing Technology Industry Revenue (Million), by Value Proposition 2024 & 2032
- Figure 91: Latin America Virtual Sensing Technology Industry Revenue Share (%), by Value Proposition 2024 & 2032
- Figure 92: Latin America Virtual Sensing Technology Industry Revenue (Million), by Distribution Channel Strategies 2024 & 2032
- Figure 93: Latin America Virtual Sensing Technology Industry Revenue Share (%), by Distribution Channel Strategies 2024 & 2032
- Figure 94: Latin America Virtual Sensing Technology Industry Revenue (Million), by Competitive Landscape 2024 & 2032
- Figure 95: Latin America Virtual Sensing Technology Industry Revenue Share (%), by Competitive Landscape 2024 & 2032
- Figure 96: Latin America Virtual Sensing Technology Industry Revenue (Million), by Addressing Market Challenges 2024 & 2032
- Figure 97: Latin America Virtual Sensing Technology Industry Revenue Share (%), by Addressing Market Challenges 2024 & 2032
- Figure 98: Latin America Virtual Sensing Technology Industry Revenue (Million), by Conclusion and Recommendations 2024 & 2032
- Figure 99: Latin America Virtual Sensing Technology Industry Revenue Share (%), by Conclusion and Recommendations 2024 & 2032
- Figure 100: Latin America Virtual Sensing Technology Industry Revenue (Million), by Country 2024 & 2032
- Figure 101: Latin America Virtual Sensing Technology Industry Revenue Share (%), by Country 2024 & 2032
- Figure 102: Middle East and Africa Virtual Sensing Technology Industry Revenue (Million), by Deployment Type 2024 & 2032
- Figure 103: Middle East and Africa Virtual Sensing Technology Industry Revenue Share (%), by Deployment Type 2024 & 2032
- Figure 104: Middle East and Africa Virtual Sensing Technology Industry Revenue (Million), by End-user Industry 2024 & 2032
- Figure 105: Middle East and Africa Virtual Sensing Technology Industry Revenue Share (%), by End-user Industry 2024 & 2032
- Figure 106: Middle East and Africa Virtual Sensing Technology Industry Revenue (Million), by Market Segmentation and Target Audience 2024 & 2032
- Figure 107: Middle East and Africa Virtual Sensing Technology Industry Revenue Share (%), by Market Segmentation and Target Audience 2024 & 2032
- Figure 108: Middle East and Africa Virtual Sensing Technology Industry Revenue (Million), by Value Proposition 2024 & 2032
- Figure 109: Middle East and Africa Virtual Sensing Technology Industry Revenue Share (%), by Value Proposition 2024 & 2032
- Figure 110: Middle East and Africa Virtual Sensing Technology Industry Revenue (Million), by Distribution Channel Strategies 2024 & 2032
- Figure 111: Middle East and Africa Virtual Sensing Technology Industry Revenue Share (%), by Distribution Channel Strategies 2024 & 2032
- Figure 112: Middle East and Africa Virtual Sensing Technology Industry Revenue (Million), by Competitive Landscape 2024 & 2032
- Figure 113: Middle East and Africa Virtual Sensing Technology Industry Revenue Share (%), by Competitive Landscape 2024 & 2032
- Figure 114: Middle East and Africa Virtual Sensing Technology Industry Revenue (Million), by Addressing Market Challenges 2024 & 2032
- Figure 115: Middle East and Africa Virtual Sensing Technology Industry Revenue Share (%), by Addressing Market Challenges 2024 & 2032
- Figure 116: Middle East and Africa Virtual Sensing Technology Industry Revenue (Million), by Conclusion and Recommendations 2024 & 2032
- Figure 117: Middle East and Africa Virtual Sensing Technology Industry Revenue Share (%), by Conclusion and Recommendations 2024 & 2032
- Figure 118: Middle East and Africa Virtual Sensing Technology Industry Revenue (Million), by Country 2024 & 2032
- Figure 119: Middle East and Africa Virtual Sensing Technology Industry Revenue Share (%), by Country 2024 & 2032
List of Tables
- Table 1: Global Virtual Sensing Technology Industry Revenue Million Forecast, by Region 2019 & 2032
- Table 2: Global Virtual Sensing Technology Industry Revenue Million Forecast, by Deployment Type 2019 & 2032
- Table 3: Global Virtual Sensing Technology Industry Revenue Million Forecast, by End-user Industry 2019 & 2032
- Table 4: Global Virtual Sensing Technology Industry Revenue Million Forecast, by Market Segmentation and Target Audience 2019 & 2032
- Table 5: Global Virtual Sensing Technology Industry Revenue Million Forecast, by Value Proposition 2019 & 2032
- Table 6: Global Virtual Sensing Technology Industry Revenue Million Forecast, by Distribution Channel Strategies 2019 & 2032
- Table 7: Global Virtual Sensing Technology Industry Revenue Million Forecast, by Competitive Landscape 2019 & 2032
- Table 8: Global Virtual Sensing Technology Industry Revenue Million Forecast, by Addressing Market Challenges 2019 & 2032
- Table 9: Global Virtual Sensing Technology Industry Revenue Million Forecast, by Conclusion and Recommendations 2019 & 2032
- Table 10: Global Virtual Sensing Technology Industry Revenue Million Forecast, by Region 2019 & 2032
- Table 11: Global Virtual Sensing Technology Industry Revenue Million Forecast, by Country 2019 & 2032
- Table 12: United States Virtual Sensing Technology Industry Revenue (Million) Forecast, by Application 2019 & 2032
- Table 13: Canada Virtual Sensing Technology Industry Revenue (Million) Forecast, by Application 2019 & 2032
- Table 14: Global Virtual Sensing Technology Industry Revenue Million Forecast, by Country 2019 & 2032
- Table 15: China Virtual Sensing Technology Industry Revenue (Million) Forecast, by Application 2019 & 2032
- Table 16: Japan Virtual Sensing Technology Industry Revenue (Million) Forecast, by Application 2019 & 2032
- Table 17: India Virtual Sensing Technology Industry Revenue (Million) Forecast, by Application 2019 & 2032
- Table 18: South Korea Virtual Sensing Technology Industry Revenue (Million) Forecast, by Application 2019 & 2032
- Table 19: Taiwan Virtual Sensing Technology Industry Revenue (Million) Forecast, by Application 2019 & 2032
- Table 20: Australia Virtual Sensing Technology Industry Revenue (Million) Forecast, by Application 2019 & 2032
- Table 21: Rest of Asia-Pacific Virtual Sensing Technology Industry Revenue (Million) Forecast, by Application 2019 & 2032
- Table 22: Global Virtual Sensing Technology Industry Revenue Million Forecast, by Country 2019 & 2032
- Table 23: Germany Virtual Sensing Technology Industry Revenue (Million) Forecast, by Application 2019 & 2032
- Table 24: France Virtual Sensing Technology Industry Revenue (Million) Forecast, by Application 2019 & 2032
- Table 25: Italy Virtual Sensing Technology Industry Revenue (Million) Forecast, by Application 2019 & 2032
- Table 26: United Kingdom Virtual Sensing Technology Industry Revenue (Million) Forecast, by Application 2019 & 2032
- Table 27: Netherlands Virtual Sensing Technology Industry Revenue (Million) Forecast, by Application 2019 & 2032
- Table 28: Sweden Virtual Sensing Technology Industry Revenue (Million) Forecast, by Application 2019 & 2032
- Table 29: Rest of Europe Virtual Sensing Technology Industry Revenue (Million) Forecast, by Application 2019 & 2032
- Table 30: Global Virtual Sensing Technology Industry Revenue Million Forecast, by Country 2019 & 2032
- Table 31: Brazil Virtual Sensing Technology Industry Revenue (Million) Forecast, by Application 2019 & 2032
- Table 32: Argentina Virtual Sensing Technology Industry Revenue (Million) Forecast, by Application 2019 & 2032
- Table 33: Rest of South America Virtual Sensing Technology Industry Revenue (Million) Forecast, by Application 2019 & 2032
- Table 34: Global Virtual Sensing Technology Industry Revenue Million Forecast, by Country 2019 & 2032
- Table 35: UAE Virtual Sensing Technology Industry Revenue (Million) Forecast, by Application 2019 & 2032
- Table 36: South Africa Virtual Sensing Technology Industry Revenue (Million) Forecast, by Application 2019 & 2032
- Table 37: Saudi Arabia Virtual Sensing Technology Industry Revenue (Million) Forecast, by Application 2019 & 2032
- Table 38: Rest of MEA Virtual Sensing Technology Industry Revenue (Million) Forecast, by Application 2019 & 2032
- Table 39: Global Virtual Sensing Technology Industry Revenue Million Forecast, by Deployment Type 2019 & 2032
- Table 40: Global Virtual Sensing Technology Industry Revenue Million Forecast, by End-user Industry 2019 & 2032
- Table 41: Global Virtual Sensing Technology Industry Revenue Million Forecast, by Market Segmentation and Target Audience 2019 & 2032
- Table 42: Global Virtual Sensing Technology Industry Revenue Million Forecast, by Value Proposition 2019 & 2032
- Table 43: Global Virtual Sensing Technology Industry Revenue Million Forecast, by Distribution Channel Strategies 2019 & 2032
- Table 44: Global Virtual Sensing Technology Industry Revenue Million Forecast, by Competitive Landscape 2019 & 2032
- Table 45: Global Virtual Sensing Technology Industry Revenue Million Forecast, by Addressing Market Challenges 2019 & 2032
- Table 46: Global Virtual Sensing Technology Industry Revenue Million Forecast, by Conclusion and Recommendations 2019 & 2032
- Table 47: Global Virtual Sensing Technology Industry Revenue Million Forecast, by Country 2019 & 2032
- Table 48: United States Virtual Sensing Technology Industry Revenue (Million) Forecast, by Application 2019 & 2032
- Table 49: Canada Virtual Sensing Technology Industry Revenue (Million) Forecast, by Application 2019 & 2032
- Table 50: Global Virtual Sensing Technology Industry Revenue Million Forecast, by Deployment Type 2019 & 2032
- Table 51: Global Virtual Sensing Technology Industry Revenue Million Forecast, by End-user Industry 2019 & 2032
- Table 52: Global Virtual Sensing Technology Industry Revenue Million Forecast, by Market Segmentation and Target Audience 2019 & 2032
- Table 53: Global Virtual Sensing Technology Industry Revenue Million Forecast, by Value Proposition 2019 & 2032
- Table 54: Global Virtual Sensing Technology Industry Revenue Million Forecast, by Distribution Channel Strategies 2019 & 2032
- Table 55: Global Virtual Sensing Technology Industry Revenue Million Forecast, by Competitive Landscape 2019 & 2032
- Table 56: Global Virtual Sensing Technology Industry Revenue Million Forecast, by Addressing Market Challenges 2019 & 2032
- Table 57: Global Virtual Sensing Technology Industry Revenue Million Forecast, by Conclusion and Recommendations 2019 & 2032
- Table 58: Global Virtual Sensing Technology Industry Revenue Million Forecast, by Country 2019 & 2032
- Table 59: United Kingdom Virtual Sensing Technology Industry Revenue (Million) Forecast, by Application 2019 & 2032
- Table 60: Germany Virtual Sensing Technology Industry Revenue (Million) Forecast, by Application 2019 & 2032
- Table 61: France Virtual Sensing Technology Industry Revenue (Million) Forecast, by Application 2019 & 2032
- Table 62: Italy Virtual Sensing Technology Industry Revenue (Million) Forecast, by Application 2019 & 2032
- Table 63: Global Virtual Sensing Technology Industry Revenue Million Forecast, by Deployment Type 2019 & 2032
- Table 64: Global Virtual Sensing Technology Industry Revenue Million Forecast, by End-user Industry 2019 & 2032
- Table 65: Global Virtual Sensing Technology Industry Revenue Million Forecast, by Market Segmentation and Target Audience 2019 & 2032
- Table 66: Global Virtual Sensing Technology Industry Revenue Million Forecast, by Value Proposition 2019 & 2032
- Table 67: Global Virtual Sensing Technology Industry Revenue Million Forecast, by Distribution Channel Strategies 2019 & 2032
- Table 68: Global Virtual Sensing Technology Industry Revenue Million Forecast, by Competitive Landscape 2019 & 2032
- Table 69: Global Virtual Sensing Technology Industry Revenue Million Forecast, by Addressing Market Challenges 2019 & 2032
- Table 70: Global Virtual Sensing Technology Industry Revenue Million Forecast, by Conclusion and Recommendations 2019 & 2032
- Table 71: Global Virtual Sensing Technology Industry Revenue Million Forecast, by Country 2019 & 2032
- Table 72: China Virtual Sensing Technology Industry Revenue (Million) Forecast, by Application 2019 & 2032
- Table 73: Japan Virtual Sensing Technology Industry Revenue (Million) Forecast, by Application 2019 & 2032
- Table 74: India Virtual Sensing Technology Industry Revenue (Million) Forecast, by Application 2019 & 2032
- Table 75: Global Virtual Sensing Technology Industry Revenue Million Forecast, by Deployment Type 2019 & 2032
- Table 76: Global Virtual Sensing Technology Industry Revenue Million Forecast, by End-user Industry 2019 & 2032
- Table 77: Global Virtual Sensing Technology Industry Revenue Million Forecast, by Market Segmentation and Target Audience 2019 & 2032
- Table 78: Global Virtual Sensing Technology Industry Revenue Million Forecast, by Value Proposition 2019 & 2032
- Table 79: Global Virtual Sensing Technology Industry Revenue Million Forecast, by Distribution Channel Strategies 2019 & 2032
- Table 80: Global Virtual Sensing Technology Industry Revenue Million Forecast, by Competitive Landscape 2019 & 2032
- Table 81: Global Virtual Sensing Technology Industry Revenue Million Forecast, by Addressing Market Challenges 2019 & 2032
- Table 82: Global Virtual Sensing Technology Industry Revenue Million Forecast, by Conclusion and Recommendations 2019 & 2032
- Table 83: Global Virtual Sensing Technology Industry Revenue Million Forecast, by Country 2019 & 2032
- Table 84: Global Virtual Sensing Technology Industry Revenue Million Forecast, by Deployment Type 2019 & 2032
- Table 85: Global Virtual Sensing Technology Industry Revenue Million Forecast, by End-user Industry 2019 & 2032
- Table 86: Global Virtual Sensing Technology Industry Revenue Million Forecast, by Market Segmentation and Target Audience 2019 & 2032
- Table 87: Global Virtual Sensing Technology Industry Revenue Million Forecast, by Value Proposition 2019 & 2032
- Table 88: Global Virtual Sensing Technology Industry Revenue Million Forecast, by Distribution Channel Strategies 2019 & 2032
- Table 89: Global Virtual Sensing Technology Industry Revenue Million Forecast, by Competitive Landscape 2019 & 2032
- Table 90: Global Virtual Sensing Technology Industry Revenue Million Forecast, by Addressing Market Challenges 2019 & 2032
- Table 91: Global Virtual Sensing Technology Industry Revenue Million Forecast, by Conclusion and Recommendations 2019 & 2032
- Table 92: Global Virtual Sensing Technology Industry Revenue Million Forecast, by Country 2019 & 2032
- Table 93: Global Virtual Sensing Technology Industry Revenue Million Forecast, by Deployment Type 2019 & 2032
- Table 94: Global Virtual Sensing Technology Industry Revenue Million Forecast, by End-user Industry 2019 & 2032
- Table 95: Global Virtual Sensing Technology Industry Revenue Million Forecast, by Market Segmentation and Target Audience 2019 & 2032
- Table 96: Global Virtual Sensing Technology Industry Revenue Million Forecast, by Value Proposition 2019 & 2032
- Table 97: Global Virtual Sensing Technology Industry Revenue Million Forecast, by Distribution Channel Strategies 2019 & 2032
- Table 98: Global Virtual Sensing Technology Industry Revenue Million Forecast, by Competitive Landscape 2019 & 2032
- Table 99: Global Virtual Sensing Technology Industry Revenue Million Forecast, by Addressing Market Challenges 2019 & 2032
- Table 100: Global Virtual Sensing Technology Industry Revenue Million Forecast, by Conclusion and Recommendations 2019 & 2032
- Table 101: Global Virtual Sensing Technology Industry Revenue Million Forecast, by Country 2019 & 2032
Frequently Asked Questions
1. What is the projected Compound Annual Growth Rate (CAGR) of the Virtual Sensing Technology Industry?
The projected CAGR is approximately 31.38%.
2. Which companies are prominent players in the Virtual Sensing Technology Industry?
Key companies in the market include Körber AG, Modelway SRL, Elliptic Labs ASA, Cisco Systems Inc, Siemens AG, Schneider Electric SE, Andata Lt, Intelli Dynamics (Biocomp Systems Inc ), General Electric Company.
3. What are the main segments of the Virtual Sensing Technology Industry?
The market segments include Deployment Type, End-user Industry, Market Segmentation and Target Audience, Value Proposition, Distribution Channel Strategies, Competitive Landscape, Addressing Market Challenges, Conclusion and Recommendations.
4. Can you provide details about the market size?
The market size is estimated to be USD 1.04 Million as of 2022.
5. What are some drivers contributing to market growth?
Increasing Adoption of IoT and Cloud Platform Is Expected to Drive the Market; Growing Need For Enhanced Cost-effectiveness and Operational Efficiency in Manufacturing.
6. What are the notable trends driving market growth?
Transportation and Automotive Industry to be the Fastest Growing End User.
7. Are there any restraints impacting market growth?
High Deployment and Maintenance Cost.
8. Can you provide examples of recent developments in the market?
March 2024 - Elliptic Labs announced that it has deployed over 500 million devices and is shipping its AI Virtual Proximity Sensor INNER BEAUTY on the Lava Blaze Curve smartphone. Elliptic Labs' newest smartphone customer, Lava International, has released the Lava Blaze Curve smartphone for the international market. Lava has collaborated with Elliptic Labs' partner MediaTek and chosen MediaTek's Dimensity 7050 chipset to drive the Blaze Curve smartphone. Elliptic Labs previously announced the contract for this launch.
9. What pricing options are available for accessing the report?
Pricing options include single-user, multi-user, and enterprise licenses priced at USD 4750, USD 5250, and USD 8750 respectively.
10. Is the market size provided in terms of value or volume?
The market size is provided in terms of value, measured in Million.
11. Are there any specific market keywords associated with the report?
Yes, the market keyword associated with the report is "Virtual Sensing Technology Industry," which aids in identifying and referencing the specific market segment covered.
12. How do I determine which pricing option suits my needs best?
The pricing options vary based on user requirements and access needs. Individual users may opt for single-user licenses, while businesses requiring broader access may choose multi-user or enterprise licenses for cost-effective access to the report.
13. Are there any additional resources or data provided in the Virtual Sensing Technology Industry report?
While the report offers comprehensive insights, it's advisable to review the specific contents or supplementary materials provided to ascertain if additional resources or data are available.
14. How can I stay updated on further developments or reports in the Virtual Sensing Technology Industry?
To stay informed about further developments, trends, and reports in the Virtual Sensing Technology Industry, consider subscribing to industry newsletters, following relevant companies and organizations, or regularly checking reputable industry news sources and publications.
Methodology
Step 1 - Identification of Relevant Samples Size from Population Database


Step 2 - Approaches for Defining Global Market Size (Value, Volume* & Price*)

Note*: In applicable scenarios
Step 3 - Data Sources
Primary Research
- Web Analytics
- Survey Reports
- Research Institute
- Latest Research Reports
- Opinion Leaders
Secondary Research
- Annual Reports
- White Paper
- Latest Press Release
- Industry Association
- Paid Database
- Investor Presentations

Step 4 - Data Triangulation
Involves using different sources of information in order to increase the validity of a study
These sources are likely to be stakeholders in a program - participants, other researchers, program staff, other community members, and so on.
Then we put all data in single framework & apply various statistical tools to find out the dynamic on the market.
During the analysis stage, feedback from the stakeholder groups would be compared to determine areas of agreement as well as areas of divergence
