

Key Insights
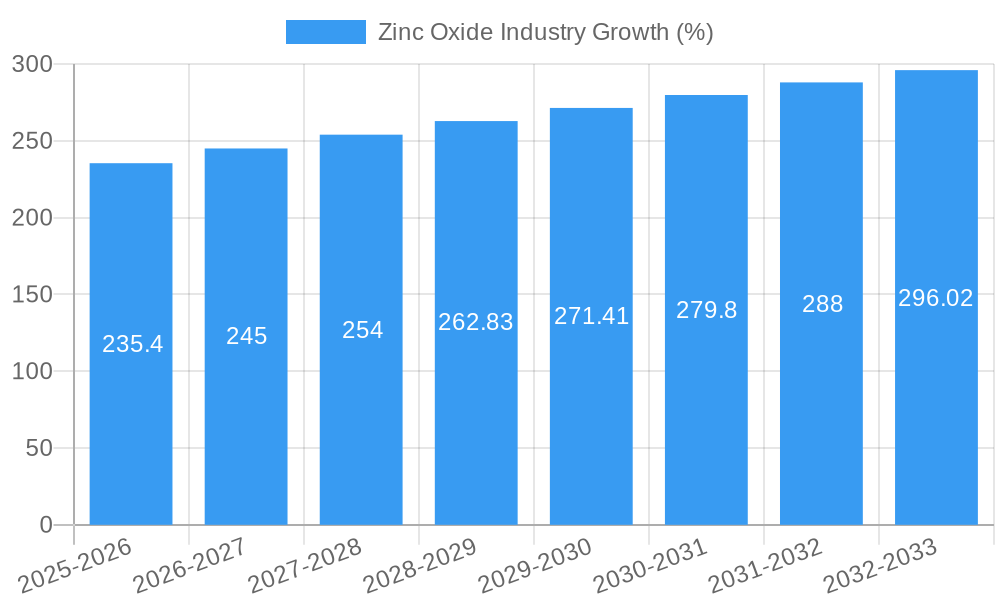
The global zinc oxide market, valued at $5.51 billion in 2025, is projected to experience robust growth, exhibiting a Compound Annual Growth Rate (CAGR) exceeding 4% from 2025 to 2033. This expansion is driven by the increasing demand from key application sectors. The rubber and tire industry relies heavily on zinc oxide as a crucial vulcanization activator, enhancing tire durability and performance. Similarly, the burgeoning ceramics and glass industries utilize zinc oxide for its optical and strengthening properties, contributing significantly to market growth. Furthermore, the pharmaceuticals and cosmetics sectors leverage zinc oxide's UV-blocking and antimicrobial capabilities in sunscreens and skincare products, fueling consistent demand. Growth is also anticipated from the paints and coatings industry, where zinc oxide provides corrosion resistance and opacity. While the indirect French process remains a dominant manufacturing method, the direct American process and wet process methods are gaining traction due to their efficiency and cost-effectiveness. Regional variations exist, with Asia Pacific, particularly China and India, representing significant market shares due to their substantial manufacturing bases and growing downstream industries. North America and Europe also maintain substantial market presence.
The market's growth trajectory is expected to be influenced by several factors. Technological advancements leading to improved production efficiency and cost reduction will likely boost market expansion. Stringent environmental regulations regarding the use of hazardous materials could present challenges, however, the inherent safety and biocompatibility of zinc oxide make it a preferable alternative to many other materials. Furthermore, fluctuations in zinc prices, a key raw material, can impact production costs and overall market dynamics. However, the diverse applications and essential role of zinc oxide across various industries suggest continued market growth, even amidst these potential challenges. Competitive dynamics are characterized by a mix of large multinational corporations and smaller regional players, leading to a dynamic landscape with opportunities for both established and emerging companies. Future market expansion will likely be driven by innovations in material science, exploring new applications of zinc oxide in emerging technologies like nanotechnology.

Zinc Oxide Industry: A Comprehensive Market Report (2019-2033)
This in-depth report provides a comprehensive analysis of the global Zinc Oxide industry, covering market dynamics, key players, emerging trends, and future growth prospects. The report leverages a robust data set, encompassing the historical period (2019-2024), base year (2025), and forecast period (2025-2033), to deliver actionable insights for industry stakeholders. The global Zinc Oxide market is projected to reach xx Million by 2033, showcasing significant growth potential.
Zinc Oxide Industry Market Concentration & Dynamics
The Zinc Oxide market exhibits a moderately concentrated landscape, with a few major players holding significant market share. While precise market share figures vary across regions and segments, companies like EverZinc, Hindustan Zinc Limited, and Zochem Inc. command substantial portions. The industry is characterized by a dynamic interplay of innovation, mergers and acquisitions (M&A), and evolving regulatory landscapes.
- Market Concentration: The top 5 players likely account for over 40% of the global market, with the remaining share distributed across numerous regional and specialized producers.
- Innovation Ecosystems: Ongoing R&D efforts focus on improving production efficiency (e.g., advanced wet processes), enhancing product purity, and expanding applications into high-growth sectors like electronics and renewable energy.
- Regulatory Frameworks: Environmental regulations concerning heavy metal emissions and waste management significantly influence production processes and operational costs. Stringent safety standards for pharmaceutical and cosmetic grade Zinc Oxide also impact the market.
- Substitute Products: While few direct substitutes exist, certain applications might utilize alternative materials, depending on specific requirements. The competitive pressure from these alternatives varies across segments.
- End-User Trends: Growing demand from the rubber and tire, paints and coatings, and pharmaceuticals and cosmetics sectors are key growth drivers. Shifting consumer preferences towards sustainable products also influence material selection.
- M&A Activities: The recent merger of U.S. Zinc and EverZinc (June 2022) exemplifies the consolidation trend in the industry, aiming for economies of scale and enhanced market dominance. The number of significant M&A deals averaged approximately xx per year during the historical period.
Zinc Oxide Industry Insights & Trends
The global Zinc Oxide market is experiencing robust growth, driven by rising demand across various applications. The market size reached xx Million in 2024, and is projected to register a CAGR of xx% during the forecast period (2025-2033), reaching xx Million by 2033. Several factors contribute to this upward trajectory: expanding infrastructure projects, particularly in developing economies, fuel demand in construction and related industries. The increasing adoption of Zinc Oxide nanoparticles in specialized applications, such as sunscreens and advanced materials, further fuels market growth. Technological advancements in production processes, leading to higher efficiency and reduced costs, are also significant contributors. Changing consumer preferences for eco-friendly materials and the rising focus on sustainability in various industries have led to higher adoption. Emerging applications in electronics and energy storage are also contributing to expansion.
Key Markets & Segments Leading Zinc Oxide Industry
The Asia-Pacific region dominates the global Zinc Oxide market, fueled by robust economic growth, extensive infrastructure development, and significant manufacturing activities within the region. China, India, and other rapidly developing economies are major consumption hubs.
Dominant Segments:
- Process: The indirect process (French process) remains the most prevalent production method, although the wet process is gaining traction for its potential for higher purity and specialized applications. The direct process (American process) maintains a niche market.
- Application: The rubber and tire industry remains the largest consumer of Zinc Oxide, followed by paints and coatings and pharmaceuticals and cosmetics. Growth in these segments significantly impacts overall market demand.
Drivers by Segment:
- Rubber and Tires: Increasing vehicle production, both passenger and commercial, and the rising demand for high-performance tires drive consumption.
- Ceramics and Glass: Expansion in the construction and building materials industry, coupled with rising demand for specialized ceramics, boosts demand.
- Pharmaceuticals and Cosmetics: The growing awareness of skincare and sun protection, coupled with the increasing use of Zinc Oxide in cosmetics, creates substantial growth potential.
- Agriculture: Zinc Oxide is used as a micronutrient in fertilizers, particularly in regions with Zinc-deficient soil. The demand is largely driven by increasing crop production needs.
- Paints and Coatings: Its use as a pigment and additive in various paints and coatings contributes significantly to market demand, influenced by construction and industrial activities.
Zinc Oxide Industry Product Developments
Recent innovations in Zinc Oxide production focus on enhancing product purity, particle size control, and surface modification to optimize performance in specific applications. Nanotechnology plays a crucial role, allowing for the creation of specialized Zinc Oxide nanoparticles with unique properties for advanced applications. This creates a competitive advantage for manufacturers offering tailored products.
Challenges in the Zinc Oxide Industry Market
The Zinc Oxide industry faces several challenges, including fluctuating zinc prices, impacting production costs. Supply chain disruptions, particularly concerning raw materials, can significantly affect production and market stability. Furthermore, stringent environmental regulations and the increasing need for sustainable practices necessitate significant investments in pollution control technologies. The intensity of competition from established players and new entrants also presents a challenge.
Forces Driving Zinc Oxide Industry Growth
Several factors propel the growth of the Zinc Oxide industry. Technological advancements in production processes and product formulation improve efficiency and expand application possibilities. Strong economic growth in developing nations fuels demand in construction, manufacturing, and other key sectors. Favourable government policies and initiatives supporting infrastructure development and industrial growth also boost consumption.
Long-Term Growth Catalysts in the Zinc Oxide Industry
Long-term growth is fueled by continuous innovation in material science, leading to new applications in emerging fields such as electronics and renewable energy. Strategic partnerships and collaborations between manufacturers and end-users facilitate the development and adoption of specialized Zinc Oxide products. Expansion into new geographic markets, particularly in rapidly developing economies, unlocks further growth opportunities.
Emerging Opportunities in Zinc Oxide Industry
Emerging opportunities lie in the growing demand for high-purity Zinc Oxide in specialized applications like electronics, solar cells, and biomedical devices. The increasing adoption of nanotechnology enables the development of advanced Zinc Oxide-based materials with enhanced properties. Sustainable production methods and circular economy approaches further enhance market competitiveness.
Leading Players in the Zinc Oxide Industry Sector
- Pan-Continental Chemical
- Hanil
- HAKUSUI TECH
- EverZinc
- Zinc-Co-India
- Rubamin
- Weifang Longda Zinc Industry Co Ltd
- Suraj Udyog
- Hindustan Zinc Limited
- Zochem Inc
- Zinc Nacional SA
- Silox SA
- Akrochem Corporation
- ZM SILESIA SA
Key Milestones in Zinc Oxide Industry Industry
- June 2022: Aterian Investment Partners merged U.S. Zinc and EverZinc, creating a global leader in zinc chemistry, significantly impacting market consolidation.
- February 2022: Zochem Inc. expanded its Zinc Oxide production capacity by 15,000 metric tons, demonstrating industry growth and investment.
Strategic Outlook for Zinc Oxide Industry Market
The Zinc Oxide market is poised for continued growth, driven by technological advancements, increasing demand from key application sectors, and expansion into new markets. Strategic initiatives focusing on innovation, sustainability, and efficient supply chains will be crucial for manufacturers to capitalize on the market's long-term potential.
Zinc Oxide Industry Segmentation
-
1. Process
- 1.1. Indirect Process (French Process)
- 1.2. Direct Process (American Process)
- 1.3. Wet Process
-
2. Application
- 2.1. Rubber and Tires
- 2.2. Ceramics and Glass
- 2.3. Pharmaceuticals and Cosmetics
- 2.4. Agriculture
- 2.5. Paints and Coatings
- 2.6. Other Applications (Chemicals and Food)
Zinc Oxide Industry Segmentation By Geography
-
1. Asia Pacific
- 1.1. China
- 1.2. India
- 1.3. Japan
- 1.4. South Korea
- 1.5. Rest of Asia Pacific
-
2. North America
- 2.1. United States
- 2.2. Canada
- 2.3. Mexico
-
3. Europe
- 3.1. Germany
- 3.2. United Kingdom
- 3.3. France
- 3.4. Italy
- 3.5. Rest of Europe
-
4. South America
- 4.1. Brazil
- 4.2. Argentina
- 4.3. Rest of South America
-
5. Middle East and Africa
- 5.1. Saudi Arabia
- 5.2. South Africa
- 5.3. Rest of Middle East and Africa

Zinc Oxide Industry REPORT HIGHLIGHTS
| Aspects | Details |
|---|---|
| Study Period | 2019-2033 |
| Base Year | 2024 |
| Estimated Year | 2025 |
| Forecast Period | 2025-2033 |
| Historical Period | 2019-2024 |
| Growth Rate | CAGR of > 4.00% from 2019-2033 |
| Segmentation |
|
Table of Contents
- 1. Introduction
- 1.1. Research Scope
- 1.2. Market Segmentation
- 1.3. Research Methodology
- 1.4. Definitions and Assumptions
- 2. Executive Summary
- 2.1. Introduction
- 3. Market Dynamics
- 3.1. Introduction
- 3.2. Market Drivers
- 3.2.1. Growing Demand from the Rubber and Tire Industry; Other Drivers
- 3.3. Market Restrains
- 3.3.1. Fluctuation in Raw Material Prices; Other Restraints
- 3.4. Market Trends
- 3.4.1. The Rubber and Tire Industry Dominate the Market
- 4. Market Factor Analysis
- 4.1. Porters Five Forces
- 4.2. Supply/Value Chain
- 4.3. PESTEL analysis
- 4.4. Market Entropy
- 4.5. Patent/Trademark Analysis
- 5. Global Zinc Oxide Industry Analysis, Insights and Forecast, 2019-2031
- 5.1. Market Analysis, Insights and Forecast - by Process
- 5.1.1. Indirect Process (French Process)
- 5.1.2. Direct Process (American Process)
- 5.1.3. Wet Process
- 5.2. Market Analysis, Insights and Forecast - by Application
- 5.2.1. Rubber and Tires
- 5.2.2. Ceramics and Glass
- 5.2.3. Pharmaceuticals and Cosmetics
- 5.2.4. Agriculture
- 5.2.5. Paints and Coatings
- 5.2.6. Other Applications (Chemicals and Food)
- 5.3. Market Analysis, Insights and Forecast - by Region
- 5.3.1. Asia Pacific
- 5.3.2. North America
- 5.3.3. Europe
- 5.3.4. South America
- 5.3.5. Middle East and Africa
- 5.1. Market Analysis, Insights and Forecast - by Process
- 6. Asia Pacific Zinc Oxide Industry Analysis, Insights and Forecast, 2019-2031
- 6.1. Market Analysis, Insights and Forecast - by Process
- 6.1.1. Indirect Process (French Process)
- 6.1.2. Direct Process (American Process)
- 6.1.3. Wet Process
- 6.2. Market Analysis, Insights and Forecast - by Application
- 6.2.1. Rubber and Tires
- 6.2.2. Ceramics and Glass
- 6.2.3. Pharmaceuticals and Cosmetics
- 6.2.4. Agriculture
- 6.2.5. Paints and Coatings
- 6.2.6. Other Applications (Chemicals and Food)
- 6.1. Market Analysis, Insights and Forecast - by Process
- 7. North America Zinc Oxide Industry Analysis, Insights and Forecast, 2019-2031
- 7.1. Market Analysis, Insights and Forecast - by Process
- 7.1.1. Indirect Process (French Process)
- 7.1.2. Direct Process (American Process)
- 7.1.3. Wet Process
- 7.2. Market Analysis, Insights and Forecast - by Application
- 7.2.1. Rubber and Tires
- 7.2.2. Ceramics and Glass
- 7.2.3. Pharmaceuticals and Cosmetics
- 7.2.4. Agriculture
- 7.2.5. Paints and Coatings
- 7.2.6. Other Applications (Chemicals and Food)
- 7.1. Market Analysis, Insights and Forecast - by Process
- 8. Europe Zinc Oxide Industry Analysis, Insights and Forecast, 2019-2031
- 8.1. Market Analysis, Insights and Forecast - by Process
- 8.1.1. Indirect Process (French Process)
- 8.1.2. Direct Process (American Process)
- 8.1.3. Wet Process
- 8.2. Market Analysis, Insights and Forecast - by Application
- 8.2.1. Rubber and Tires
- 8.2.2. Ceramics and Glass
- 8.2.3. Pharmaceuticals and Cosmetics
- 8.2.4. Agriculture
- 8.2.5. Paints and Coatings
- 8.2.6. Other Applications (Chemicals and Food)
- 8.1. Market Analysis, Insights and Forecast - by Process
- 9. South America Zinc Oxide Industry Analysis, Insights and Forecast, 2019-2031
- 9.1. Market Analysis, Insights and Forecast - by Process
- 9.1.1. Indirect Process (French Process)
- 9.1.2. Direct Process (American Process)
- 9.1.3. Wet Process
- 9.2. Market Analysis, Insights and Forecast - by Application
- 9.2.1. Rubber and Tires
- 9.2.2. Ceramics and Glass
- 9.2.3. Pharmaceuticals and Cosmetics
- 9.2.4. Agriculture
- 9.2.5. Paints and Coatings
- 9.2.6. Other Applications (Chemicals and Food)
- 9.1. Market Analysis, Insights and Forecast - by Process
- 10. Middle East and Africa Zinc Oxide Industry Analysis, Insights and Forecast, 2019-2031
- 10.1. Market Analysis, Insights and Forecast - by Process
- 10.1.1. Indirect Process (French Process)
- 10.1.2. Direct Process (American Process)
- 10.1.3. Wet Process
- 10.2. Market Analysis, Insights and Forecast - by Application
- 10.2.1. Rubber and Tires
- 10.2.2. Ceramics and Glass
- 10.2.3. Pharmaceuticals and Cosmetics
- 10.2.4. Agriculture
- 10.2.5. Paints and Coatings
- 10.2.6. Other Applications (Chemicals and Food)
- 10.1. Market Analysis, Insights and Forecast - by Process
- 11. Asia Pacific Zinc Oxide Industry Analysis, Insights and Forecast, 2019-2031
- 11.1. Market Analysis, Insights and Forecast - By Country/Sub-region
- 11.1.1 China
- 11.1.2 India
- 11.1.3 Japan
- 11.1.4 South Korea
- 11.1.5 Rest of Asia Pacific
- 12. North America Zinc Oxide Industry Analysis, Insights and Forecast, 2019-2031
- 12.1. Market Analysis, Insights and Forecast - By Country/Sub-region
- 12.1.1 United States
- 12.1.2 Canada
- 12.1.3 Mexico
- 13. Europe Zinc Oxide Industry Analysis, Insights and Forecast, 2019-2031
- 13.1. Market Analysis, Insights and Forecast - By Country/Sub-region
- 13.1.1 Germany
- 13.1.2 United Kingdom
- 13.1.3 France
- 13.1.4 Italy
- 13.1.5 Rest of Europe
- 14. South America Zinc Oxide Industry Analysis, Insights and Forecast, 2019-2031
- 14.1. Market Analysis, Insights and Forecast - By Country/Sub-region
- 14.1.1 Brazil
- 14.1.2 Argentina
- 14.1.3 Rest of South America
- 15. Middle East and Africa Zinc Oxide Industry Analysis, Insights and Forecast, 2019-2031
- 15.1. Market Analysis, Insights and Forecast - By Country/Sub-region
- 15.1.1 Saudi Arabia
- 15.1.2 South Africa
- 15.1.3 Rest of Middle East and Africa
- 16. Competitive Analysis
- 16.1. Global Market Share Analysis 2024
- 16.2. Company Profiles
- 16.2.1 Pan-Continental Chemical
- 16.2.1.1. Overview
- 16.2.1.2. Products
- 16.2.1.3. SWOT Analysis
- 16.2.1.4. Recent Developments
- 16.2.1.5. Financials (Based on Availability)
- 16.2.2 Hanil
- 16.2.2.1. Overview
- 16.2.2.2. Products
- 16.2.2.3. SWOT Analysis
- 16.2.2.4. Recent Developments
- 16.2.2.5. Financials (Based on Availability)
- 16.2.3 HAKUSUI TECH
- 16.2.3.1. Overview
- 16.2.3.2. Products
- 16.2.3.3. SWOT Analysis
- 16.2.3.4. Recent Developments
- 16.2.3.5. Financials (Based on Availability)
- 16.2.4 EverZinc
- 16.2.4.1. Overview
- 16.2.4.2. Products
- 16.2.4.3. SWOT Analysis
- 16.2.4.4. Recent Developments
- 16.2.4.5. Financials (Based on Availability)
- 16.2.5 Zinc-Co-India
- 16.2.5.1. Overview
- 16.2.5.2. Products
- 16.2.5.3. SWOT Analysis
- 16.2.5.4. Recent Developments
- 16.2.5.5. Financials (Based on Availability)
- 16.2.6 Rubamin
- 16.2.6.1. Overview
- 16.2.6.2. Products
- 16.2.6.3. SWOT Analysis
- 16.2.6.4. Recent Developments
- 16.2.6.5. Financials (Based on Availability)
- 16.2.7 Weifang Longda Zinc Industry Co Ltd
- 16.2.7.1. Overview
- 16.2.7.2. Products
- 16.2.7.3. SWOT Analysis
- 16.2.7.4. Recent Developments
- 16.2.7.5. Financials (Based on Availability)
- 16.2.8 Suraj Udyog
- 16.2.8.1. Overview
- 16.2.8.2. Products
- 16.2.8.3. SWOT Analysis
- 16.2.8.4. Recent Developments
- 16.2.8.5. Financials (Based on Availability)
- 16.2.9 Hindustan Zinc Limited
- 16.2.9.1. Overview
- 16.2.9.2. Products
- 16.2.9.3. SWOT Analysis
- 16.2.9.4. Recent Developments
- 16.2.9.5. Financials (Based on Availability)
- 16.2.10 Zochem Inc *List Not Exhaustive
- 16.2.10.1. Overview
- 16.2.10.2. Products
- 16.2.10.3. SWOT Analysis
- 16.2.10.4. Recent Developments
- 16.2.10.5. Financials (Based on Availability)
- 16.2.11 Zinc Nacional SA
- 16.2.11.1. Overview
- 16.2.11.2. Products
- 16.2.11.3. SWOT Analysis
- 16.2.11.4. Recent Developments
- 16.2.11.5. Financials (Based on Availability)
- 16.2.12 Silox SA
- 16.2.12.1. Overview
- 16.2.12.2. Products
- 16.2.12.3. SWOT Analysis
- 16.2.12.4. Recent Developments
- 16.2.12.5. Financials (Based on Availability)
- 16.2.13 Akrochem Corporation
- 16.2.13.1. Overview
- 16.2.13.2. Products
- 16.2.13.3. SWOT Analysis
- 16.2.13.4. Recent Developments
- 16.2.13.5. Financials (Based on Availability)
- 16.2.14 ZM SILESIA SA
- 16.2.14.1. Overview
- 16.2.14.2. Products
- 16.2.14.3. SWOT Analysis
- 16.2.14.4. Recent Developments
- 16.2.14.5. Financials (Based on Availability)
- 16.2.1 Pan-Continental Chemical
List of Figures
- Figure 1: Global Zinc Oxide Industry Revenue Breakdown (Million, %) by Region 2024 & 2032
- Figure 2: Global Zinc Oxide Industry Volume Breakdown (K Tons, %) by Region 2024 & 2032
- Figure 3: Asia Pacific Zinc Oxide Industry Revenue (Million), by Country 2024 & 2032
- Figure 4: Asia Pacific Zinc Oxide Industry Volume (K Tons), by Country 2024 & 2032
- Figure 5: Asia Pacific Zinc Oxide Industry Revenue Share (%), by Country 2024 & 2032
- Figure 6: Asia Pacific Zinc Oxide Industry Volume Share (%), by Country 2024 & 2032
- Figure 7: North America Zinc Oxide Industry Revenue (Million), by Country 2024 & 2032
- Figure 8: North America Zinc Oxide Industry Volume (K Tons), by Country 2024 & 2032
- Figure 9: North America Zinc Oxide Industry Revenue Share (%), by Country 2024 & 2032
- Figure 10: North America Zinc Oxide Industry Volume Share (%), by Country 2024 & 2032
- Figure 11: Europe Zinc Oxide Industry Revenue (Million), by Country 2024 & 2032
- Figure 12: Europe Zinc Oxide Industry Volume (K Tons), by Country 2024 & 2032
- Figure 13: Europe Zinc Oxide Industry Revenue Share (%), by Country 2024 & 2032
- Figure 14: Europe Zinc Oxide Industry Volume Share (%), by Country 2024 & 2032
- Figure 15: South America Zinc Oxide Industry Revenue (Million), by Country 2024 & 2032
- Figure 16: South America Zinc Oxide Industry Volume (K Tons), by Country 2024 & 2032
- Figure 17: South America Zinc Oxide Industry Revenue Share (%), by Country 2024 & 2032
- Figure 18: South America Zinc Oxide Industry Volume Share (%), by Country 2024 & 2032
- Figure 19: Middle East and Africa Zinc Oxide Industry Revenue (Million), by Country 2024 & 2032
- Figure 20: Middle East and Africa Zinc Oxide Industry Volume (K Tons), by Country 2024 & 2032
- Figure 21: Middle East and Africa Zinc Oxide Industry Revenue Share (%), by Country 2024 & 2032
- Figure 22: Middle East and Africa Zinc Oxide Industry Volume Share (%), by Country 2024 & 2032
- Figure 23: Asia Pacific Zinc Oxide Industry Revenue (Million), by Process 2024 & 2032
- Figure 24: Asia Pacific Zinc Oxide Industry Volume (K Tons), by Process 2024 & 2032
- Figure 25: Asia Pacific Zinc Oxide Industry Revenue Share (%), by Process 2024 & 2032
- Figure 26: Asia Pacific Zinc Oxide Industry Volume Share (%), by Process 2024 & 2032
- Figure 27: Asia Pacific Zinc Oxide Industry Revenue (Million), by Application 2024 & 2032
- Figure 28: Asia Pacific Zinc Oxide Industry Volume (K Tons), by Application 2024 & 2032
- Figure 29: Asia Pacific Zinc Oxide Industry Revenue Share (%), by Application 2024 & 2032
- Figure 30: Asia Pacific Zinc Oxide Industry Volume Share (%), by Application 2024 & 2032
- Figure 31: Asia Pacific Zinc Oxide Industry Revenue (Million), by Country 2024 & 2032
- Figure 32: Asia Pacific Zinc Oxide Industry Volume (K Tons), by Country 2024 & 2032
- Figure 33: Asia Pacific Zinc Oxide Industry Revenue Share (%), by Country 2024 & 2032
- Figure 34: Asia Pacific Zinc Oxide Industry Volume Share (%), by Country 2024 & 2032
- Figure 35: North America Zinc Oxide Industry Revenue (Million), by Process 2024 & 2032
- Figure 36: North America Zinc Oxide Industry Volume (K Tons), by Process 2024 & 2032
- Figure 37: North America Zinc Oxide Industry Revenue Share (%), by Process 2024 & 2032
- Figure 38: North America Zinc Oxide Industry Volume Share (%), by Process 2024 & 2032
- Figure 39: North America Zinc Oxide Industry Revenue (Million), by Application 2024 & 2032
- Figure 40: North America Zinc Oxide Industry Volume (K Tons), by Application 2024 & 2032
- Figure 41: North America Zinc Oxide Industry Revenue Share (%), by Application 2024 & 2032
- Figure 42: North America Zinc Oxide Industry Volume Share (%), by Application 2024 & 2032
- Figure 43: North America Zinc Oxide Industry Revenue (Million), by Country 2024 & 2032
- Figure 44: North America Zinc Oxide Industry Volume (K Tons), by Country 2024 & 2032
- Figure 45: North America Zinc Oxide Industry Revenue Share (%), by Country 2024 & 2032
- Figure 46: North America Zinc Oxide Industry Volume Share (%), by Country 2024 & 2032
- Figure 47: Europe Zinc Oxide Industry Revenue (Million), by Process 2024 & 2032
- Figure 48: Europe Zinc Oxide Industry Volume (K Tons), by Process 2024 & 2032
- Figure 49: Europe Zinc Oxide Industry Revenue Share (%), by Process 2024 & 2032
- Figure 50: Europe Zinc Oxide Industry Volume Share (%), by Process 2024 & 2032
- Figure 51: Europe Zinc Oxide Industry Revenue (Million), by Application 2024 & 2032
- Figure 52: Europe Zinc Oxide Industry Volume (K Tons), by Application 2024 & 2032
- Figure 53: Europe Zinc Oxide Industry Revenue Share (%), by Application 2024 & 2032
- Figure 54: Europe Zinc Oxide Industry Volume Share (%), by Application 2024 & 2032
- Figure 55: Europe Zinc Oxide Industry Revenue (Million), by Country 2024 & 2032
- Figure 56: Europe Zinc Oxide Industry Volume (K Tons), by Country 2024 & 2032
- Figure 57: Europe Zinc Oxide Industry Revenue Share (%), by Country 2024 & 2032
- Figure 58: Europe Zinc Oxide Industry Volume Share (%), by Country 2024 & 2032
- Figure 59: South America Zinc Oxide Industry Revenue (Million), by Process 2024 & 2032
- Figure 60: South America Zinc Oxide Industry Volume (K Tons), by Process 2024 & 2032
- Figure 61: South America Zinc Oxide Industry Revenue Share (%), by Process 2024 & 2032
- Figure 62: South America Zinc Oxide Industry Volume Share (%), by Process 2024 & 2032
- Figure 63: South America Zinc Oxide Industry Revenue (Million), by Application 2024 & 2032
- Figure 64: South America Zinc Oxide Industry Volume (K Tons), by Application 2024 & 2032
- Figure 65: South America Zinc Oxide Industry Revenue Share (%), by Application 2024 & 2032
- Figure 66: South America Zinc Oxide Industry Volume Share (%), by Application 2024 & 2032
- Figure 67: South America Zinc Oxide Industry Revenue (Million), by Country 2024 & 2032
- Figure 68: South America Zinc Oxide Industry Volume (K Tons), by Country 2024 & 2032
- Figure 69: South America Zinc Oxide Industry Revenue Share (%), by Country 2024 & 2032
- Figure 70: South America Zinc Oxide Industry Volume Share (%), by Country 2024 & 2032
- Figure 71: Middle East and Africa Zinc Oxide Industry Revenue (Million), by Process 2024 & 2032
- Figure 72: Middle East and Africa Zinc Oxide Industry Volume (K Tons), by Process 2024 & 2032
- Figure 73: Middle East and Africa Zinc Oxide Industry Revenue Share (%), by Process 2024 & 2032
- Figure 74: Middle East and Africa Zinc Oxide Industry Volume Share (%), by Process 2024 & 2032
- Figure 75: Middle East and Africa Zinc Oxide Industry Revenue (Million), by Application 2024 & 2032
- Figure 76: Middle East and Africa Zinc Oxide Industry Volume (K Tons), by Application 2024 & 2032
- Figure 77: Middle East and Africa Zinc Oxide Industry Revenue Share (%), by Application 2024 & 2032
- Figure 78: Middle East and Africa Zinc Oxide Industry Volume Share (%), by Application 2024 & 2032
- Figure 79: Middle East and Africa Zinc Oxide Industry Revenue (Million), by Country 2024 & 2032
- Figure 80: Middle East and Africa Zinc Oxide Industry Volume (K Tons), by Country 2024 & 2032
- Figure 81: Middle East and Africa Zinc Oxide Industry Revenue Share (%), by Country 2024 & 2032
- Figure 82: Middle East and Africa Zinc Oxide Industry Volume Share (%), by Country 2024 & 2032
List of Tables
- Table 1: Global Zinc Oxide Industry Revenue Million Forecast, by Region 2019 & 2032
- Table 2: Global Zinc Oxide Industry Volume K Tons Forecast, by Region 2019 & 2032
- Table 3: Global Zinc Oxide Industry Revenue Million Forecast, by Process 2019 & 2032
- Table 4: Global Zinc Oxide Industry Volume K Tons Forecast, by Process 2019 & 2032
- Table 5: Global Zinc Oxide Industry Revenue Million Forecast, by Application 2019 & 2032
- Table 6: Global Zinc Oxide Industry Volume K Tons Forecast, by Application 2019 & 2032
- Table 7: Global Zinc Oxide Industry Revenue Million Forecast, by Region 2019 & 2032
- Table 8: Global Zinc Oxide Industry Volume K Tons Forecast, by Region 2019 & 2032
- Table 9: Global Zinc Oxide Industry Revenue Million Forecast, by Country 2019 & 2032
- Table 10: Global Zinc Oxide Industry Volume K Tons Forecast, by Country 2019 & 2032
- Table 11: China Zinc Oxide Industry Revenue (Million) Forecast, by Application 2019 & 2032
- Table 12: China Zinc Oxide Industry Volume (K Tons) Forecast, by Application 2019 & 2032
- Table 13: India Zinc Oxide Industry Revenue (Million) Forecast, by Application 2019 & 2032
- Table 14: India Zinc Oxide Industry Volume (K Tons) Forecast, by Application 2019 & 2032
- Table 15: Japan Zinc Oxide Industry Revenue (Million) Forecast, by Application 2019 & 2032
- Table 16: Japan Zinc Oxide Industry Volume (K Tons) Forecast, by Application 2019 & 2032
- Table 17: South Korea Zinc Oxide Industry Revenue (Million) Forecast, by Application 2019 & 2032
- Table 18: South Korea Zinc Oxide Industry Volume (K Tons) Forecast, by Application 2019 & 2032
- Table 19: Rest of Asia Pacific Zinc Oxide Industry Revenue (Million) Forecast, by Application 2019 & 2032
- Table 20: Rest of Asia Pacific Zinc Oxide Industry Volume (K Tons) Forecast, by Application 2019 & 2032
- Table 21: Global Zinc Oxide Industry Revenue Million Forecast, by Country 2019 & 2032
- Table 22: Global Zinc Oxide Industry Volume K Tons Forecast, by Country 2019 & 2032
- Table 23: United States Zinc Oxide Industry Revenue (Million) Forecast, by Application 2019 & 2032
- Table 24: United States Zinc Oxide Industry Volume (K Tons) Forecast, by Application 2019 & 2032
- Table 25: Canada Zinc Oxide Industry Revenue (Million) Forecast, by Application 2019 & 2032
- Table 26: Canada Zinc Oxide Industry Volume (K Tons) Forecast, by Application 2019 & 2032
- Table 27: Mexico Zinc Oxide Industry Revenue (Million) Forecast, by Application 2019 & 2032
- Table 28: Mexico Zinc Oxide Industry Volume (K Tons) Forecast, by Application 2019 & 2032
- Table 29: Global Zinc Oxide Industry Revenue Million Forecast, by Country 2019 & 2032
- Table 30: Global Zinc Oxide Industry Volume K Tons Forecast, by Country 2019 & 2032
- Table 31: Germany Zinc Oxide Industry Revenue (Million) Forecast, by Application 2019 & 2032
- Table 32: Germany Zinc Oxide Industry Volume (K Tons) Forecast, by Application 2019 & 2032
- Table 33: United Kingdom Zinc Oxide Industry Revenue (Million) Forecast, by Application 2019 & 2032
- Table 34: United Kingdom Zinc Oxide Industry Volume (K Tons) Forecast, by Application 2019 & 2032
- Table 35: France Zinc Oxide Industry Revenue (Million) Forecast, by Application 2019 & 2032
- Table 36: France Zinc Oxide Industry Volume (K Tons) Forecast, by Application 2019 & 2032
- Table 37: Italy Zinc Oxide Industry Revenue (Million) Forecast, by Application 2019 & 2032
- Table 38: Italy Zinc Oxide Industry Volume (K Tons) Forecast, by Application 2019 & 2032
- Table 39: Rest of Europe Zinc Oxide Industry Revenue (Million) Forecast, by Application 2019 & 2032
- Table 40: Rest of Europe Zinc Oxide Industry Volume (K Tons) Forecast, by Application 2019 & 2032
- Table 41: Global Zinc Oxide Industry Revenue Million Forecast, by Country 2019 & 2032
- Table 42: Global Zinc Oxide Industry Volume K Tons Forecast, by Country 2019 & 2032
- Table 43: Brazil Zinc Oxide Industry Revenue (Million) Forecast, by Application 2019 & 2032
- Table 44: Brazil Zinc Oxide Industry Volume (K Tons) Forecast, by Application 2019 & 2032
- Table 45: Argentina Zinc Oxide Industry Revenue (Million) Forecast, by Application 2019 & 2032
- Table 46: Argentina Zinc Oxide Industry Volume (K Tons) Forecast, by Application 2019 & 2032
- Table 47: Rest of South America Zinc Oxide Industry Revenue (Million) Forecast, by Application 2019 & 2032
- Table 48: Rest of South America Zinc Oxide Industry Volume (K Tons) Forecast, by Application 2019 & 2032
- Table 49: Global Zinc Oxide Industry Revenue Million Forecast, by Country 2019 & 2032
- Table 50: Global Zinc Oxide Industry Volume K Tons Forecast, by Country 2019 & 2032
- Table 51: Saudi Arabia Zinc Oxide Industry Revenue (Million) Forecast, by Application 2019 & 2032
- Table 52: Saudi Arabia Zinc Oxide Industry Volume (K Tons) Forecast, by Application 2019 & 2032
- Table 53: South Africa Zinc Oxide Industry Revenue (Million) Forecast, by Application 2019 & 2032
- Table 54: South Africa Zinc Oxide Industry Volume (K Tons) Forecast, by Application 2019 & 2032
- Table 55: Rest of Middle East and Africa Zinc Oxide Industry Revenue (Million) Forecast, by Application 2019 & 2032
- Table 56: Rest of Middle East and Africa Zinc Oxide Industry Volume (K Tons) Forecast, by Application 2019 & 2032
- Table 57: Global Zinc Oxide Industry Revenue Million Forecast, by Process 2019 & 2032
- Table 58: Global Zinc Oxide Industry Volume K Tons Forecast, by Process 2019 & 2032
- Table 59: Global Zinc Oxide Industry Revenue Million Forecast, by Application 2019 & 2032
- Table 60: Global Zinc Oxide Industry Volume K Tons Forecast, by Application 2019 & 2032
- Table 61: Global Zinc Oxide Industry Revenue Million Forecast, by Country 2019 & 2032
- Table 62: Global Zinc Oxide Industry Volume K Tons Forecast, by Country 2019 & 2032
- Table 63: China Zinc Oxide Industry Revenue (Million) Forecast, by Application 2019 & 2032
- Table 64: China Zinc Oxide Industry Volume (K Tons) Forecast, by Application 2019 & 2032
- Table 65: India Zinc Oxide Industry Revenue (Million) Forecast, by Application 2019 & 2032
- Table 66: India Zinc Oxide Industry Volume (K Tons) Forecast, by Application 2019 & 2032
- Table 67: Japan Zinc Oxide Industry Revenue (Million) Forecast, by Application 2019 & 2032
- Table 68: Japan Zinc Oxide Industry Volume (K Tons) Forecast, by Application 2019 & 2032
- Table 69: South Korea Zinc Oxide Industry Revenue (Million) Forecast, by Application 2019 & 2032
- Table 70: South Korea Zinc Oxide Industry Volume (K Tons) Forecast, by Application 2019 & 2032
- Table 71: Rest of Asia Pacific Zinc Oxide Industry Revenue (Million) Forecast, by Application 2019 & 2032
- Table 72: Rest of Asia Pacific Zinc Oxide Industry Volume (K Tons) Forecast, by Application 2019 & 2032
- Table 73: Global Zinc Oxide Industry Revenue Million Forecast, by Process 2019 & 2032
- Table 74: Global Zinc Oxide Industry Volume K Tons Forecast, by Process 2019 & 2032
- Table 75: Global Zinc Oxide Industry Revenue Million Forecast, by Application 2019 & 2032
- Table 76: Global Zinc Oxide Industry Volume K Tons Forecast, by Application 2019 & 2032
- Table 77: Global Zinc Oxide Industry Revenue Million Forecast, by Country 2019 & 2032
- Table 78: Global Zinc Oxide Industry Volume K Tons Forecast, by Country 2019 & 2032
- Table 79: United States Zinc Oxide Industry Revenue (Million) Forecast, by Application 2019 & 2032
- Table 80: United States Zinc Oxide Industry Volume (K Tons) Forecast, by Application 2019 & 2032
- Table 81: Canada Zinc Oxide Industry Revenue (Million) Forecast, by Application 2019 & 2032
- Table 82: Canada Zinc Oxide Industry Volume (K Tons) Forecast, by Application 2019 & 2032
- Table 83: Mexico Zinc Oxide Industry Revenue (Million) Forecast, by Application 2019 & 2032
- Table 84: Mexico Zinc Oxide Industry Volume (K Tons) Forecast, by Application 2019 & 2032
- Table 85: Global Zinc Oxide Industry Revenue Million Forecast, by Process 2019 & 2032
- Table 86: Global Zinc Oxide Industry Volume K Tons Forecast, by Process 2019 & 2032
- Table 87: Global Zinc Oxide Industry Revenue Million Forecast, by Application 2019 & 2032
- Table 88: Global Zinc Oxide Industry Volume K Tons Forecast, by Application 2019 & 2032
- Table 89: Global Zinc Oxide Industry Revenue Million Forecast, by Country 2019 & 2032
- Table 90: Global Zinc Oxide Industry Volume K Tons Forecast, by Country 2019 & 2032
- Table 91: Germany Zinc Oxide Industry Revenue (Million) Forecast, by Application 2019 & 2032
- Table 92: Germany Zinc Oxide Industry Volume (K Tons) Forecast, by Application 2019 & 2032
- Table 93: United Kingdom Zinc Oxide Industry Revenue (Million) Forecast, by Application 2019 & 2032
- Table 94: United Kingdom Zinc Oxide Industry Volume (K Tons) Forecast, by Application 2019 & 2032
- Table 95: France Zinc Oxide Industry Revenue (Million) Forecast, by Application 2019 & 2032
- Table 96: France Zinc Oxide Industry Volume (K Tons) Forecast, by Application 2019 & 2032
- Table 97: Italy Zinc Oxide Industry Revenue (Million) Forecast, by Application 2019 & 2032
- Table 98: Italy Zinc Oxide Industry Volume (K Tons) Forecast, by Application 2019 & 2032
- Table 99: Rest of Europe Zinc Oxide Industry Revenue (Million) Forecast, by Application 2019 & 2032
- Table 100: Rest of Europe Zinc Oxide Industry Volume (K Tons) Forecast, by Application 2019 & 2032
- Table 101: Global Zinc Oxide Industry Revenue Million Forecast, by Process 2019 & 2032
- Table 102: Global Zinc Oxide Industry Volume K Tons Forecast, by Process 2019 & 2032
- Table 103: Global Zinc Oxide Industry Revenue Million Forecast, by Application 2019 & 2032
- Table 104: Global Zinc Oxide Industry Volume K Tons Forecast, by Application 2019 & 2032
- Table 105: Global Zinc Oxide Industry Revenue Million Forecast, by Country 2019 & 2032
- Table 106: Global Zinc Oxide Industry Volume K Tons Forecast, by Country 2019 & 2032
- Table 107: Brazil Zinc Oxide Industry Revenue (Million) Forecast, by Application 2019 & 2032
- Table 108: Brazil Zinc Oxide Industry Volume (K Tons) Forecast, by Application 2019 & 2032
- Table 109: Argentina Zinc Oxide Industry Revenue (Million) Forecast, by Application 2019 & 2032
- Table 110: Argentina Zinc Oxide Industry Volume (K Tons) Forecast, by Application 2019 & 2032
- Table 111: Rest of South America Zinc Oxide Industry Revenue (Million) Forecast, by Application 2019 & 2032
- Table 112: Rest of South America Zinc Oxide Industry Volume (K Tons) Forecast, by Application 2019 & 2032
- Table 113: Global Zinc Oxide Industry Revenue Million Forecast, by Process 2019 & 2032
- Table 114: Global Zinc Oxide Industry Volume K Tons Forecast, by Process 2019 & 2032
- Table 115: Global Zinc Oxide Industry Revenue Million Forecast, by Application 2019 & 2032
- Table 116: Global Zinc Oxide Industry Volume K Tons Forecast, by Application 2019 & 2032
- Table 117: Global Zinc Oxide Industry Revenue Million Forecast, by Country 2019 & 2032
- Table 118: Global Zinc Oxide Industry Volume K Tons Forecast, by Country 2019 & 2032
- Table 119: Saudi Arabia Zinc Oxide Industry Revenue (Million) Forecast, by Application 2019 & 2032
- Table 120: Saudi Arabia Zinc Oxide Industry Volume (K Tons) Forecast, by Application 2019 & 2032
- Table 121: South Africa Zinc Oxide Industry Revenue (Million) Forecast, by Application 2019 & 2032
- Table 122: South Africa Zinc Oxide Industry Volume (K Tons) Forecast, by Application 2019 & 2032
- Table 123: Rest of Middle East and Africa Zinc Oxide Industry Revenue (Million) Forecast, by Application 2019 & 2032
- Table 124: Rest of Middle East and Africa Zinc Oxide Industry Volume (K Tons) Forecast, by Application 2019 & 2032
Frequently Asked Questions
1. What is the projected Compound Annual Growth Rate (CAGR) of the Zinc Oxide Industry?
The projected CAGR is approximately > 4.00%.
2. Which companies are prominent players in the Zinc Oxide Industry?
Key companies in the market include Pan-Continental Chemical, Hanil, HAKUSUI TECH, EverZinc, Zinc-Co-India, Rubamin, Weifang Longda Zinc Industry Co Ltd, Suraj Udyog, Hindustan Zinc Limited, Zochem Inc *List Not Exhaustive, Zinc Nacional SA, Silox SA, Akrochem Corporation, ZM SILESIA SA.
3. What are the main segments of the Zinc Oxide Industry?
The market segments include Process, Application.
4. Can you provide details about the market size?
The market size is estimated to be USD 5510 Million as of 2022.
5. What are some drivers contributing to market growth?
Growing Demand from the Rubber and Tire Industry; Other Drivers.
6. What are the notable trends driving market growth?
The Rubber and Tire Industry Dominate the Market.
7. Are there any restraints impacting market growth?
Fluctuation in Raw Material Prices; Other Restraints.
8. Can you provide examples of recent developments in the market?
June 2022: Aterian Investment Partners merged U.S. Zinc and EverZinc, two of the world's largest producers of zinc chemical products, to form the world's leading zinc chemistry company.
9. What pricing options are available for accessing the report?
Pricing options include single-user, multi-user, and enterprise licenses priced at USD 4750, USD 5250, and USD 8750 respectively.
10. Is the market size provided in terms of value or volume?
The market size is provided in terms of value, measured in Million and volume, measured in K Tons.
11. Are there any specific market keywords associated with the report?
Yes, the market keyword associated with the report is "Zinc Oxide Industry," which aids in identifying and referencing the specific market segment covered.
12. How do I determine which pricing option suits my needs best?
The pricing options vary based on user requirements and access needs. Individual users may opt for single-user licenses, while businesses requiring broader access may choose multi-user or enterprise licenses for cost-effective access to the report.
13. Are there any additional resources or data provided in the Zinc Oxide Industry report?
While the report offers comprehensive insights, it's advisable to review the specific contents or supplementary materials provided to ascertain if additional resources or data are available.
14. How can I stay updated on further developments or reports in the Zinc Oxide Industry?
To stay informed about further developments, trends, and reports in the Zinc Oxide Industry, consider subscribing to industry newsletters, following relevant companies and organizations, or regularly checking reputable industry news sources and publications.
Methodology
Step 1 - Identification of Relevant Samples Size from Population Database


Step 2 - Approaches for Defining Global Market Size (Value, Volume* & Price*)

Note*: In applicable scenarios
Step 3 - Data Sources
Primary Research
- Web Analytics
- Survey Reports
- Research Institute
- Latest Research Reports
- Opinion Leaders
Secondary Research
- Annual Reports
- White Paper
- Latest Press Release
- Industry Association
- Paid Database
- Investor Presentations

Step 4 - Data Triangulation
Involves using different sources of information in order to increase the validity of a study
These sources are likely to be stakeholders in a program - participants, other researchers, program staff, other community members, and so on.
Then we put all data in single framework & apply various statistical tools to find out the dynamic on the market.
During the analysis stage, feedback from the stakeholder groups would be compared to determine areas of agreement as well as areas of divergence
