

Key Insights
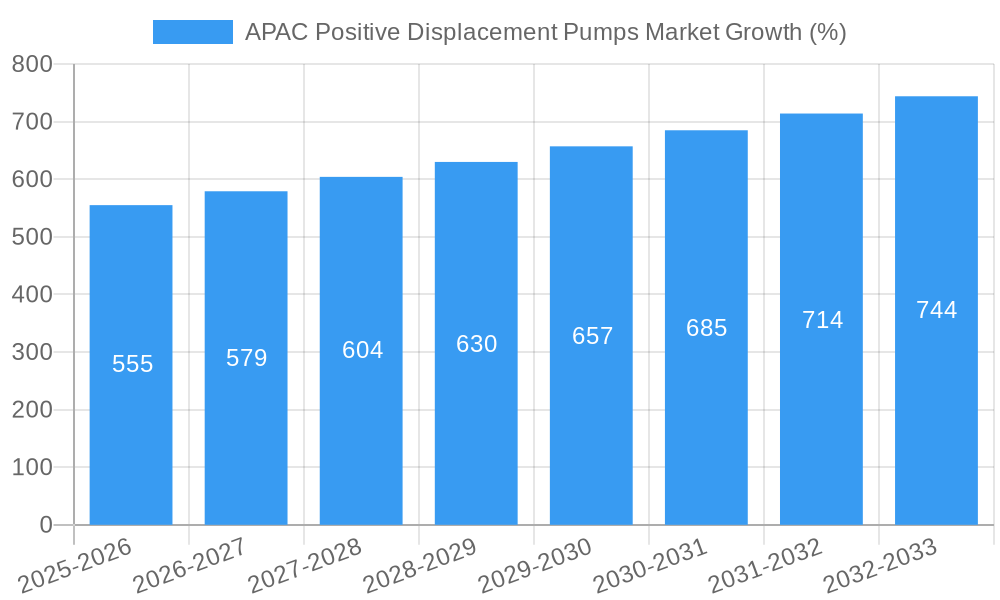
The Asia-Pacific (APAC) positive displacement pumps market is experiencing robust growth, driven by the expanding oil & gas, chemical, and food & beverage sectors in the region. A CAGR of 3.67% from 2019-2024 indicates a steady upward trajectory, projected to continue into the forecast period (2025-2033). Key growth drivers include increasing industrialization, rising infrastructure development (particularly in countries like India and China), and a growing demand for efficient and reliable fluid handling solutions across various industries. The market is segmented by pump type (diaphragm, piston, gear, lobe, progressive cavity, screw, vane, peristaltic), end-user industry (oil & gas, chemicals, food & beverage, waste & wastewater, pharmaceutical, power), and geography (China, Japan, India, South Korea, and the Rest of Asia Pacific). China and India, given their rapid economic expansion and significant industrial activity, are expected to dominate the regional market share. While the market faces challenges such as fluctuating raw material prices and stringent environmental regulations, technological advancements in pump design, offering enhanced energy efficiency and durability, are mitigating these restraints. The adoption of smart pumps with advanced monitoring capabilities is also contributing to the market's expansion.
The dominance of major players like The Weir Group PLC, Xylem Inc., and KSB SE & Co KGaA reflects the competitive landscape. However, the emergence of smaller, specialized players offering niche solutions, particularly in sustainable and environmentally friendly pump technologies, is creating a dynamic and competitive market environment. Growth in the pharmaceutical and wastewater treatment segments is anticipated to be particularly strong due to increasing healthcare spending and rising concerns about water pollution management. The forecast period will likely witness further consolidation through mergers and acquisitions, as larger companies seek to expand their market share and product portfolios. Specific regional growth within APAC will depend on individual country-specific economic factors, government policies promoting industrial growth, and infrastructure investments in water management and industrial processes. Overall, the APAC positive displacement pumps market presents a significant growth opportunity for established and emerging players alike.

APAC Positive Displacement Pumps Market Report: 2019-2033
This comprehensive report provides a detailed analysis of the Asia-Pacific (APAC) Positive Displacement Pumps market, offering invaluable insights for industry stakeholders, investors, and strategic decision-makers. Covering the period from 2019 to 2033, with a base year of 2025, this report meticulously examines market dynamics, key segments, leading players, and future growth prospects. The market is segmented by type (Diaphragm, Piston, Gear, Lobe, Progressive Cavity, Screw, Vane, Peristaltic), end-user industry (Oil & Gas, Chemicals, Food & Beverage, Waste & Wastewater, Pharmaceutical, Power, Other End-user Industries), and country (China, Japan, India, South Korea, Rest of Asia Pacific). The report’s findings are based on rigorous research and analysis, incorporating real-world data and expert perspectives.
APAC Positive Displacement Pumps Market Concentration & Dynamics
The APAC positive displacement pumps market exhibits a moderately concentrated landscape, with several multinational corporations and regional players vying for market share. Market concentration is measured by the Herfindahl-Hirschman Index (HHI) at xx, indicating a moderately concentrated market structure. The market is witnessing increasing consolidation through mergers and acquisitions (M&A) activities, particularly among larger players seeking to expand their product portfolios and geographic reach. Over the historical period (2019-2024), approximately xx M&A deals were recorded in the APAC region, with an average deal value of xx Million.
- Innovation Ecosystems: Significant investments in R&D are driving innovations in pump designs, materials, and control systems, leading to higher efficiency, durability, and performance.
- Regulatory Frameworks: Stringent environmental regulations and safety standards are influencing the adoption of energy-efficient and environmentally friendly pumps.
- Substitute Products: The market faces competition from centrifugal pumps and other fluid handling technologies, though positive displacement pumps maintain their dominance in specific niche applications.
- End-User Trends: Growing demand from key end-user industries like Oil & Gas, Chemicals, and Water & Wastewater is driving market growth.
- M&A Activities: Consolidation in the market continues to shape the competitive landscape, as larger companies acquire smaller players to expand their capabilities and market share.
APAC Positive Displacement Pumps Market Industry Insights & Trends
The APAC positive displacement pumps market is projected to witness robust growth during the forecast period (2025-2033), with a Compound Annual Growth Rate (CAGR) of xx%. The market size is estimated at xx Million in 2025 and is expected to reach xx Million by 2033. This growth is fueled by several factors, including increasing industrialization, infrastructure development, and the rising demand for efficient fluid handling solutions across diverse industries. Technological advancements, such as the incorporation of smart sensors and advanced control systems, are enhancing the performance and efficiency of positive displacement pumps, driving further market expansion. Changing consumer behavior, particularly a focus on sustainability and energy efficiency, is also influencing the adoption of advanced pump technologies. Furthermore, government initiatives promoting industrial automation and digitalization are contributing to the growth of the market.
Key Markets & Segments Leading APAC Positive Displacement Pumps Market
Dominant Regions/Segments: China holds the largest market share in the APAC region, followed by Japan and India. Within the product type segment, the demand for progressive cavity and diaphragm pumps is substantial due to their versatile applications and suitability for a wide range of fluids. The Oil & Gas and Chemical industries dominate the end-user sector.
- Drivers for China's Dominance:
- Rapid industrialization and economic growth
- Significant investments in infrastructure projects
- Growing demand across various end-user industries
- Drivers for Japan's Market:
- Advanced manufacturing sector
- High technological capabilities
- Focus on efficiency and precision
- Drivers for India's Market:
- Expanding industrial base
- Government initiatives supporting infrastructure development
- Increasing demand for water management solutions
The detailed dominance analysis reveals a strong correlation between economic growth, industrial development, and the demand for advanced fluid handling solutions in the region. Countries with robust manufacturing sectors and substantial investments in infrastructure demonstrate a higher adoption rate of positive displacement pumps.
APAC Positive Displacement Pumps Market Product Developments
Recent years have witnessed significant advancements in positive displacement pump technology. Innovations include the incorporation of smart sensors for real-time monitoring, advanced control systems for optimized performance, and the use of high-performance materials for enhanced durability and efficiency. These advancements are enabling pumps to handle increasingly challenging applications, including those involving highly viscous or corrosive fluids. The development of smaller, more energy-efficient models is also gaining traction, aligning with sustainability goals. Companies are focusing on developing customized pump solutions to address the specific needs of diverse end-user industries, providing a competitive edge. The launch of the NETZSCH PERIPRO peristaltic pump in February 2022 exemplifies this trend towards product diversification and enhanced functionality.
Challenges in the APAP Positive Displacement Pumps Market
The APAC positive displacement pumps market faces several challenges. Supply chain disruptions, particularly concerning raw materials and components, can impact production and lead to price volatility. Intense competition, both from established players and emerging manufacturers, necessitates continuous innovation and cost optimization. Stricter environmental regulations and safety standards necessitate significant investments in compliance and new technology adoption. These factors collectively can impose significant cost pressure on businesses.
Forces Driving APAC Positive Displacement Pumps Market Growth
Several factors are driving the growth of the APAC positive displacement pumps market. Firstly, robust economic growth in several APAC countries fuels investments in industrial infrastructure and expansion. Secondly, technological advancements lead to improved efficiency, reliability, and versatility of pumps. Thirdly, government initiatives and incentives focusing on industrial automation and energy efficiency further boost market demand. Finally, the rising demand for advanced fluid handling solutions across key end-user industries fuels strong market growth.
Long-Term Growth Catalysts in the APAC Positive Displacement Pumps Market
Long-term growth is expected to be driven by several factors, including ongoing technological advancements leading to improved pump performance and efficiency. Strategic partnerships and collaborations between pump manufacturers and end-users will also propel growth. Expansion into new and emerging markets within the APAC region will contribute significantly to long-term growth.
Emerging Opportunities in APAC Positive Displacement Pumps Market
Emerging opportunities lie in several areas. The growing demand for energy-efficient and eco-friendly pumps presents a substantial opportunity for manufacturers. Developing customized pump solutions to address the unique needs of various industries offers further market expansion prospects. Moreover, tapping into the potential of emerging markets and expanding into new applications will unlock significant growth opportunities.
Leading Players in the APAC Positive Displacement Pumps Market Sector
- The Weir Group PLC
- Xylem Inc
- KSB SE & Co KGaA
- SPX Flow Inc
- NETZSCH Holding
- TSURUMI MANUFACTURING CO LTD
- Sulzer AG
- Pentair PLC
- Atlas Copco
- GRUNDFOS
Key Milestones in APAC Positive Displacement Pumps Market Industry
- February 2022: NETZSCH Pumps and Systems launched the PERIPRO peristaltic pump, expanding its product portfolio and strengthening its position in the chemical, industrial, and food processing sectors. This launch signifies a focus on product diversification and market expansion.
Strategic Outlook for APAC Positive Displacement Pumps Market
The APAC positive displacement pumps market is poised for significant growth in the coming years, driven by technological innovation, robust economic growth, and increasing industrialization. Strategic opportunities exist for companies to focus on developing energy-efficient and sustainable pump technologies, expanding their product portfolios to cater to diverse applications, and forging strategic partnerships to secure market share and drive long-term growth. Focusing on emerging markets within the APAC region and adapting to evolving consumer preferences will be critical for sustained success in this dynamic market.
APAC Positive Displacement Pumps Market Segmentation
-
1. Type
- 1.1. Diaphragm
- 1.2. Piston
- 1.3. Gear
- 1.4. Lobe
- 1.5. Progressive Cavity
- 1.6. Screw
- 1.7. Vane
- 1.8. Peristaltic
-
2. End-user Industry
- 2.1. Oil & Gas
- 2.2. Chemicals
- 2.3. Food & Beverage
- 2.4. Waste & Wastewater
- 2.5. Pharmaceutical
- 2.6. Power
- 2.7. Other End-user Industries
APAC Positive Displacement Pumps Market Segmentation By Geography
-
1. North America
- 1.1. United States
- 1.2. Canada
- 1.3. Mexico
-
2. South America
- 2.1. Brazil
- 2.2. Argentina
- 2.3. Rest of South America
-
3. Europe
- 3.1. United Kingdom
- 3.2. Germany
- 3.3. France
- 3.4. Italy
- 3.5. Spain
- 3.6. Russia
- 3.7. Benelux
- 3.8. Nordics
- 3.9. Rest of Europe
-
4. Middle East & Africa
- 4.1. Turkey
- 4.2. Israel
- 4.3. GCC
- 4.4. North Africa
- 4.5. South Africa
- 4.6. Rest of Middle East & Africa
-
5. Asia Pacific
- 5.1. China
- 5.2. India
- 5.3. Japan
- 5.4. South Korea
- 5.5. ASEAN
- 5.6. Oceania
- 5.7. Rest of Asia Pacific

APAC Positive Displacement Pumps Market REPORT HIGHLIGHTS
| Aspects | Details |
|---|---|
| Study Period | 2019-2033 |
| Base Year | 2024 |
| Estimated Year | 2025 |
| Forecast Period | 2025-2033 |
| Historical Period | 2019-2024 |
| Growth Rate | CAGR of 3.67% from 2019-2033 |
| Segmentation |
|
Table of Contents
- 1. Introduction
- 1.1. Research Scope
- 1.2. Market Segmentation
- 1.3. Research Methodology
- 1.4. Definitions and Assumptions
- 2. Executive Summary
- 2.1. Introduction
- 3. Market Dynamics
- 3.1. Introduction
- 3.2. Market Drivers
- 3.2.1. Increased Focus on Wastewater Management
- 3.3. Market Restrains
- 3.3.1. Environmental and Safe Use Concerns
- 3.4. Market Trends
- 3.4.1. Waste and Wastewater Industry is Expected to Register Significant Growth
- 4. Market Factor Analysis
- 4.1. Porters Five Forces
- 4.2. Supply/Value Chain
- 4.3. PESTEL analysis
- 4.4. Market Entropy
- 4.5. Patent/Trademark Analysis
- 5. Global APAC Positive Displacement Pumps Market Analysis, Insights and Forecast, 2019-2031
- 5.1. Market Analysis, Insights and Forecast - by Type
- 5.1.1. Diaphragm
- 5.1.2. Piston
- 5.1.3. Gear
- 5.1.4. Lobe
- 5.1.5. Progressive Cavity
- 5.1.6. Screw
- 5.1.7. Vane
- 5.1.8. Peristaltic
- 5.2. Market Analysis, Insights and Forecast - by End-user Industry
- 5.2.1. Oil & Gas
- 5.2.2. Chemicals
- 5.2.3. Food & Beverage
- 5.2.4. Waste & Wastewater
- 5.2.5. Pharmaceutical
- 5.2.6. Power
- 5.2.7. Other End-user Industries
- 5.3. Market Analysis, Insights and Forecast - by Region
- 5.3.1. North America
- 5.3.2. South America
- 5.3.3. Europe
- 5.3.4. Middle East & Africa
- 5.3.5. Asia Pacific
- 5.1. Market Analysis, Insights and Forecast - by Type
- 6. North America APAC Positive Displacement Pumps Market Analysis, Insights and Forecast, 2019-2031
- 6.1. Market Analysis, Insights and Forecast - by Type
- 6.1.1. Diaphragm
- 6.1.2. Piston
- 6.1.3. Gear
- 6.1.4. Lobe
- 6.1.5. Progressive Cavity
- 6.1.6. Screw
- 6.1.7. Vane
- 6.1.8. Peristaltic
- 6.2. Market Analysis, Insights and Forecast - by End-user Industry
- 6.2.1. Oil & Gas
- 6.2.2. Chemicals
- 6.2.3. Food & Beverage
- 6.2.4. Waste & Wastewater
- 6.2.5. Pharmaceutical
- 6.2.6. Power
- 6.2.7. Other End-user Industries
- 6.1. Market Analysis, Insights and Forecast - by Type
- 7. South America APAC Positive Displacement Pumps Market Analysis, Insights and Forecast, 2019-2031
- 7.1. Market Analysis, Insights and Forecast - by Type
- 7.1.1. Diaphragm
- 7.1.2. Piston
- 7.1.3. Gear
- 7.1.4. Lobe
- 7.1.5. Progressive Cavity
- 7.1.6. Screw
- 7.1.7. Vane
- 7.1.8. Peristaltic
- 7.2. Market Analysis, Insights and Forecast - by End-user Industry
- 7.2.1. Oil & Gas
- 7.2.2. Chemicals
- 7.2.3. Food & Beverage
- 7.2.4. Waste & Wastewater
- 7.2.5. Pharmaceutical
- 7.2.6. Power
- 7.2.7. Other End-user Industries
- 7.1. Market Analysis, Insights and Forecast - by Type
- 8. Europe APAC Positive Displacement Pumps Market Analysis, Insights and Forecast, 2019-2031
- 8.1. Market Analysis, Insights and Forecast - by Type
- 8.1.1. Diaphragm
- 8.1.2. Piston
- 8.1.3. Gear
- 8.1.4. Lobe
- 8.1.5. Progressive Cavity
- 8.1.6. Screw
- 8.1.7. Vane
- 8.1.8. Peristaltic
- 8.2. Market Analysis, Insights and Forecast - by End-user Industry
- 8.2.1. Oil & Gas
- 8.2.2. Chemicals
- 8.2.3. Food & Beverage
- 8.2.4. Waste & Wastewater
- 8.2.5. Pharmaceutical
- 8.2.6. Power
- 8.2.7. Other End-user Industries
- 8.1. Market Analysis, Insights and Forecast - by Type
- 9. Middle East & Africa APAC Positive Displacement Pumps Market Analysis, Insights and Forecast, 2019-2031
- 9.1. Market Analysis, Insights and Forecast - by Type
- 9.1.1. Diaphragm
- 9.1.2. Piston
- 9.1.3. Gear
- 9.1.4. Lobe
- 9.1.5. Progressive Cavity
- 9.1.6. Screw
- 9.1.7. Vane
- 9.1.8. Peristaltic
- 9.2. Market Analysis, Insights and Forecast - by End-user Industry
- 9.2.1. Oil & Gas
- 9.2.2. Chemicals
- 9.2.3. Food & Beverage
- 9.2.4. Waste & Wastewater
- 9.2.5. Pharmaceutical
- 9.2.6. Power
- 9.2.7. Other End-user Industries
- 9.1. Market Analysis, Insights and Forecast - by Type
- 10. Asia Pacific APAC Positive Displacement Pumps Market Analysis, Insights and Forecast, 2019-2031
- 10.1. Market Analysis, Insights and Forecast - by Type
- 10.1.1. Diaphragm
- 10.1.2. Piston
- 10.1.3. Gear
- 10.1.4. Lobe
- 10.1.5. Progressive Cavity
- 10.1.6. Screw
- 10.1.7. Vane
- 10.1.8. Peristaltic
- 10.2. Market Analysis, Insights and Forecast - by End-user Industry
- 10.2.1. Oil & Gas
- 10.2.2. Chemicals
- 10.2.3. Food & Beverage
- 10.2.4. Waste & Wastewater
- 10.2.5. Pharmaceutical
- 10.2.6. Power
- 10.2.7. Other End-user Industries
- 10.1. Market Analysis, Insights and Forecast - by Type
- 11. Brazil APAC Positive Displacement Pumps Market Analysis, Insights and Forecast, 2019-2031
- 11.1. Market Analysis, Insights and Forecast - By Country/Sub-region
- 11.1.1.
- 12. Colombia APAC Positive Displacement Pumps Market Analysis, Insights and Forecast, 2019-2031
- 12.1. Market Analysis, Insights and Forecast - By Country/Sub-region
- 12.1.1.
- 13. Mexico APAC Positive Displacement Pumps Market Analysis, Insights and Forecast, 2019-2031
- 13.1. Market Analysis, Insights and Forecast - By Country/Sub-region
- 13.1.1.
- 14. Competitive Analysis
- 14.1. Global Market Share Analysis 2024
- 14.2. Company Profiles
- 14.2.1 The Weir Group PLC
- 14.2.1.1. Overview
- 14.2.1.2. Products
- 14.2.1.3. SWOT Analysis
- 14.2.1.4. Recent Developments
- 14.2.1.5. Financials (Based on Availability)
- 14.2.2 Xylem Inc
- 14.2.2.1. Overview
- 14.2.2.2. Products
- 14.2.2.3. SWOT Analysis
- 14.2.2.4. Recent Developments
- 14.2.2.5. Financials (Based on Availability)
- 14.2.3 KSB SE & Co KGaA
- 14.2.3.1. Overview
- 14.2.3.2. Products
- 14.2.3.3. SWOT Analysis
- 14.2.3.4. Recent Developments
- 14.2.3.5. Financials (Based on Availability)
- 14.2.4 SPX Flow Inc
- 14.2.4.1. Overview
- 14.2.4.2. Products
- 14.2.4.3. SWOT Analysis
- 14.2.4.4. Recent Developments
- 14.2.4.5. Financials (Based on Availability)
- 14.2.5 NETZSCH Holding
- 14.2.5.1. Overview
- 14.2.5.2. Products
- 14.2.5.3. SWOT Analysis
- 14.2.5.4. Recent Developments
- 14.2.5.5. Financials (Based on Availability)
- 14.2.6 TSURUMI MANUFACTURING CO LTD
- 14.2.6.1. Overview
- 14.2.6.2. Products
- 14.2.6.3. SWOT Analysis
- 14.2.6.4. Recent Developments
- 14.2.6.5. Financials (Based on Availability)
- 14.2.7 Sulzer AG
- 14.2.7.1. Overview
- 14.2.7.2. Products
- 14.2.7.3. SWOT Analysis
- 14.2.7.4. Recent Developments
- 14.2.7.5. Financials (Based on Availability)
- 14.2.8 Pentair PLC
- 14.2.8.1. Overview
- 14.2.8.2. Products
- 14.2.8.3. SWOT Analysis
- 14.2.8.4. Recent Developments
- 14.2.8.5. Financials (Based on Availability)
- 14.2.9 Atlas Copco
- 14.2.9.1. Overview
- 14.2.9.2. Products
- 14.2.9.3. SWOT Analysis
- 14.2.9.4. Recent Developments
- 14.2.9.5. Financials (Based on Availability)
- 14.2.10 GRUNDFOS
- 14.2.10.1. Overview
- 14.2.10.2. Products
- 14.2.10.3. SWOT Analysis
- 14.2.10.4. Recent Developments
- 14.2.10.5. Financials (Based on Availability)
- 14.2.1 The Weir Group PLC
List of Figures
- Figure 1: Global APAC Positive Displacement Pumps Market Revenue Breakdown (Million, %) by Region 2024 & 2032
- Figure 2: Global APAC Positive Displacement Pumps Market Volume Breakdown (K Unit, %) by Region 2024 & 2032
- Figure 3: Brazil APAC Positive Displacement Pumps Market Revenue (Million), by Country 2024 & 2032
- Figure 4: Brazil APAC Positive Displacement Pumps Market Volume (K Unit), by Country 2024 & 2032
- Figure 5: Brazil APAC Positive Displacement Pumps Market Revenue Share (%), by Country 2024 & 2032
- Figure 6: Brazil APAC Positive Displacement Pumps Market Volume Share (%), by Country 2024 & 2032
- Figure 7: Colombia APAC Positive Displacement Pumps Market Revenue (Million), by Country 2024 & 2032
- Figure 8: Colombia APAC Positive Displacement Pumps Market Volume (K Unit), by Country 2024 & 2032
- Figure 9: Colombia APAC Positive Displacement Pumps Market Revenue Share (%), by Country 2024 & 2032
- Figure 10: Colombia APAC Positive Displacement Pumps Market Volume Share (%), by Country 2024 & 2032
- Figure 11: Mexico APAC Positive Displacement Pumps Market Revenue (Million), by Country 2024 & 2032
- Figure 12: Mexico APAC Positive Displacement Pumps Market Volume (K Unit), by Country 2024 & 2032
- Figure 13: Mexico APAC Positive Displacement Pumps Market Revenue Share (%), by Country 2024 & 2032
- Figure 14: Mexico APAC Positive Displacement Pumps Market Volume Share (%), by Country 2024 & 2032
- Figure 15: North America APAC Positive Displacement Pumps Market Revenue (Million), by Type 2024 & 2032
- Figure 16: North America APAC Positive Displacement Pumps Market Volume (K Unit), by Type 2024 & 2032
- Figure 17: North America APAC Positive Displacement Pumps Market Revenue Share (%), by Type 2024 & 2032
- Figure 18: North America APAC Positive Displacement Pumps Market Volume Share (%), by Type 2024 & 2032
- Figure 19: North America APAC Positive Displacement Pumps Market Revenue (Million), by End-user Industry 2024 & 2032
- Figure 20: North America APAC Positive Displacement Pumps Market Volume (K Unit), by End-user Industry 2024 & 2032
- Figure 21: North America APAC Positive Displacement Pumps Market Revenue Share (%), by End-user Industry 2024 & 2032
- Figure 22: North America APAC Positive Displacement Pumps Market Volume Share (%), by End-user Industry 2024 & 2032
- Figure 23: North America APAC Positive Displacement Pumps Market Revenue (Million), by Country 2024 & 2032
- Figure 24: North America APAC Positive Displacement Pumps Market Volume (K Unit), by Country 2024 & 2032
- Figure 25: North America APAC Positive Displacement Pumps Market Revenue Share (%), by Country 2024 & 2032
- Figure 26: North America APAC Positive Displacement Pumps Market Volume Share (%), by Country 2024 & 2032
- Figure 27: South America APAC Positive Displacement Pumps Market Revenue (Million), by Type 2024 & 2032
- Figure 28: South America APAC Positive Displacement Pumps Market Volume (K Unit), by Type 2024 & 2032
- Figure 29: South America APAC Positive Displacement Pumps Market Revenue Share (%), by Type 2024 & 2032
- Figure 30: South America APAC Positive Displacement Pumps Market Volume Share (%), by Type 2024 & 2032
- Figure 31: South America APAC Positive Displacement Pumps Market Revenue (Million), by End-user Industry 2024 & 2032
- Figure 32: South America APAC Positive Displacement Pumps Market Volume (K Unit), by End-user Industry 2024 & 2032
- Figure 33: South America APAC Positive Displacement Pumps Market Revenue Share (%), by End-user Industry 2024 & 2032
- Figure 34: South America APAC Positive Displacement Pumps Market Volume Share (%), by End-user Industry 2024 & 2032
- Figure 35: South America APAC Positive Displacement Pumps Market Revenue (Million), by Country 2024 & 2032
- Figure 36: South America APAC Positive Displacement Pumps Market Volume (K Unit), by Country 2024 & 2032
- Figure 37: South America APAC Positive Displacement Pumps Market Revenue Share (%), by Country 2024 & 2032
- Figure 38: South America APAC Positive Displacement Pumps Market Volume Share (%), by Country 2024 & 2032
- Figure 39: Europe APAC Positive Displacement Pumps Market Revenue (Million), by Type 2024 & 2032
- Figure 40: Europe APAC Positive Displacement Pumps Market Volume (K Unit), by Type 2024 & 2032
- Figure 41: Europe APAC Positive Displacement Pumps Market Revenue Share (%), by Type 2024 & 2032
- Figure 42: Europe APAC Positive Displacement Pumps Market Volume Share (%), by Type 2024 & 2032
- Figure 43: Europe APAC Positive Displacement Pumps Market Revenue (Million), by End-user Industry 2024 & 2032
- Figure 44: Europe APAC Positive Displacement Pumps Market Volume (K Unit), by End-user Industry 2024 & 2032
- Figure 45: Europe APAC Positive Displacement Pumps Market Revenue Share (%), by End-user Industry 2024 & 2032
- Figure 46: Europe APAC Positive Displacement Pumps Market Volume Share (%), by End-user Industry 2024 & 2032
- Figure 47: Europe APAC Positive Displacement Pumps Market Revenue (Million), by Country 2024 & 2032
- Figure 48: Europe APAC Positive Displacement Pumps Market Volume (K Unit), by Country 2024 & 2032
- Figure 49: Europe APAC Positive Displacement Pumps Market Revenue Share (%), by Country 2024 & 2032
- Figure 50: Europe APAC Positive Displacement Pumps Market Volume Share (%), by Country 2024 & 2032
- Figure 51: Middle East & Africa APAC Positive Displacement Pumps Market Revenue (Million), by Type 2024 & 2032
- Figure 52: Middle East & Africa APAC Positive Displacement Pumps Market Volume (K Unit), by Type 2024 & 2032
- Figure 53: Middle East & Africa APAC Positive Displacement Pumps Market Revenue Share (%), by Type 2024 & 2032
- Figure 54: Middle East & Africa APAC Positive Displacement Pumps Market Volume Share (%), by Type 2024 & 2032
- Figure 55: Middle East & Africa APAC Positive Displacement Pumps Market Revenue (Million), by End-user Industry 2024 & 2032
- Figure 56: Middle East & Africa APAC Positive Displacement Pumps Market Volume (K Unit), by End-user Industry 2024 & 2032
- Figure 57: Middle East & Africa APAC Positive Displacement Pumps Market Revenue Share (%), by End-user Industry 2024 & 2032
- Figure 58: Middle East & Africa APAC Positive Displacement Pumps Market Volume Share (%), by End-user Industry 2024 & 2032
- Figure 59: Middle East & Africa APAC Positive Displacement Pumps Market Revenue (Million), by Country 2024 & 2032
- Figure 60: Middle East & Africa APAC Positive Displacement Pumps Market Volume (K Unit), by Country 2024 & 2032
- Figure 61: Middle East & Africa APAC Positive Displacement Pumps Market Revenue Share (%), by Country 2024 & 2032
- Figure 62: Middle East & Africa APAC Positive Displacement Pumps Market Volume Share (%), by Country 2024 & 2032
- Figure 63: Asia Pacific APAC Positive Displacement Pumps Market Revenue (Million), by Type 2024 & 2032
- Figure 64: Asia Pacific APAC Positive Displacement Pumps Market Volume (K Unit), by Type 2024 & 2032
- Figure 65: Asia Pacific APAC Positive Displacement Pumps Market Revenue Share (%), by Type 2024 & 2032
- Figure 66: Asia Pacific APAC Positive Displacement Pumps Market Volume Share (%), by Type 2024 & 2032
- Figure 67: Asia Pacific APAC Positive Displacement Pumps Market Revenue (Million), by End-user Industry 2024 & 2032
- Figure 68: Asia Pacific APAC Positive Displacement Pumps Market Volume (K Unit), by End-user Industry 2024 & 2032
- Figure 69: Asia Pacific APAC Positive Displacement Pumps Market Revenue Share (%), by End-user Industry 2024 & 2032
- Figure 70: Asia Pacific APAC Positive Displacement Pumps Market Volume Share (%), by End-user Industry 2024 & 2032
- Figure 71: Asia Pacific APAC Positive Displacement Pumps Market Revenue (Million), by Country 2024 & 2032
- Figure 72: Asia Pacific APAC Positive Displacement Pumps Market Volume (K Unit), by Country 2024 & 2032
- Figure 73: Asia Pacific APAC Positive Displacement Pumps Market Revenue Share (%), by Country 2024 & 2032
- Figure 74: Asia Pacific APAC Positive Displacement Pumps Market Volume Share (%), by Country 2024 & 2032
List of Tables
- Table 1: Global APAC Positive Displacement Pumps Market Revenue Million Forecast, by Region 2019 & 2032
- Table 2: Global APAC Positive Displacement Pumps Market Volume K Unit Forecast, by Region 2019 & 2032
- Table 3: Global APAC Positive Displacement Pumps Market Revenue Million Forecast, by Type 2019 & 2032
- Table 4: Global APAC Positive Displacement Pumps Market Volume K Unit Forecast, by Type 2019 & 2032
- Table 5: Global APAC Positive Displacement Pumps Market Revenue Million Forecast, by End-user Industry 2019 & 2032
- Table 6: Global APAC Positive Displacement Pumps Market Volume K Unit Forecast, by End-user Industry 2019 & 2032
- Table 7: Global APAC Positive Displacement Pumps Market Revenue Million Forecast, by Region 2019 & 2032
- Table 8: Global APAC Positive Displacement Pumps Market Volume K Unit Forecast, by Region 2019 & 2032
- Table 9: Global APAC Positive Displacement Pumps Market Revenue Million Forecast, by Country 2019 & 2032
- Table 10: Global APAC Positive Displacement Pumps Market Volume K Unit Forecast, by Country 2019 & 2032
- Table 11: APAC Positive Displacement Pumps Market Revenue (Million) Forecast, by Application 2019 & 2032
- Table 12: APAC Positive Displacement Pumps Market Volume (K Unit) Forecast, by Application 2019 & 2032
- Table 13: Global APAC Positive Displacement Pumps Market Revenue Million Forecast, by Country 2019 & 2032
- Table 14: Global APAC Positive Displacement Pumps Market Volume K Unit Forecast, by Country 2019 & 2032
- Table 15: APAC Positive Displacement Pumps Market Revenue (Million) Forecast, by Application 2019 & 2032
- Table 16: APAC Positive Displacement Pumps Market Volume (K Unit) Forecast, by Application 2019 & 2032
- Table 17: Global APAC Positive Displacement Pumps Market Revenue Million Forecast, by Country 2019 & 2032
- Table 18: Global APAC Positive Displacement Pumps Market Volume K Unit Forecast, by Country 2019 & 2032
- Table 19: APAC Positive Displacement Pumps Market Revenue (Million) Forecast, by Application 2019 & 2032
- Table 20: APAC Positive Displacement Pumps Market Volume (K Unit) Forecast, by Application 2019 & 2032
- Table 21: Global APAC Positive Displacement Pumps Market Revenue Million Forecast, by Type 2019 & 2032
- Table 22: Global APAC Positive Displacement Pumps Market Volume K Unit Forecast, by Type 2019 & 2032
- Table 23: Global APAC Positive Displacement Pumps Market Revenue Million Forecast, by End-user Industry 2019 & 2032
- Table 24: Global APAC Positive Displacement Pumps Market Volume K Unit Forecast, by End-user Industry 2019 & 2032
- Table 25: Global APAC Positive Displacement Pumps Market Revenue Million Forecast, by Country 2019 & 2032
- Table 26: Global APAC Positive Displacement Pumps Market Volume K Unit Forecast, by Country 2019 & 2032
- Table 27: United States APAC Positive Displacement Pumps Market Revenue (Million) Forecast, by Application 2019 & 2032
- Table 28: United States APAC Positive Displacement Pumps Market Volume (K Unit) Forecast, by Application 2019 & 2032
- Table 29: Canada APAC Positive Displacement Pumps Market Revenue (Million) Forecast, by Application 2019 & 2032
- Table 30: Canada APAC Positive Displacement Pumps Market Volume (K Unit) Forecast, by Application 2019 & 2032
- Table 31: Mexico APAC Positive Displacement Pumps Market Revenue (Million) Forecast, by Application 2019 & 2032
- Table 32: Mexico APAC Positive Displacement Pumps Market Volume (K Unit) Forecast, by Application 2019 & 2032
- Table 33: Global APAC Positive Displacement Pumps Market Revenue Million Forecast, by Type 2019 & 2032
- Table 34: Global APAC Positive Displacement Pumps Market Volume K Unit Forecast, by Type 2019 & 2032
- Table 35: Global APAC Positive Displacement Pumps Market Revenue Million Forecast, by End-user Industry 2019 & 2032
- Table 36: Global APAC Positive Displacement Pumps Market Volume K Unit Forecast, by End-user Industry 2019 & 2032
- Table 37: Global APAC Positive Displacement Pumps Market Revenue Million Forecast, by Country 2019 & 2032
- Table 38: Global APAC Positive Displacement Pumps Market Volume K Unit Forecast, by Country 2019 & 2032
- Table 39: Brazil APAC Positive Displacement Pumps Market Revenue (Million) Forecast, by Application 2019 & 2032
- Table 40: Brazil APAC Positive Displacement Pumps Market Volume (K Unit) Forecast, by Application 2019 & 2032
- Table 41: Argentina APAC Positive Displacement Pumps Market Revenue (Million) Forecast, by Application 2019 & 2032
- Table 42: Argentina APAC Positive Displacement Pumps Market Volume (K Unit) Forecast, by Application 2019 & 2032
- Table 43: Rest of South America APAC Positive Displacement Pumps Market Revenue (Million) Forecast, by Application 2019 & 2032
- Table 44: Rest of South America APAC Positive Displacement Pumps Market Volume (K Unit) Forecast, by Application 2019 & 2032
- Table 45: Global APAC Positive Displacement Pumps Market Revenue Million Forecast, by Type 2019 & 2032
- Table 46: Global APAC Positive Displacement Pumps Market Volume K Unit Forecast, by Type 2019 & 2032
- Table 47: Global APAC Positive Displacement Pumps Market Revenue Million Forecast, by End-user Industry 2019 & 2032
- Table 48: Global APAC Positive Displacement Pumps Market Volume K Unit Forecast, by End-user Industry 2019 & 2032
- Table 49: Global APAC Positive Displacement Pumps Market Revenue Million Forecast, by Country 2019 & 2032
- Table 50: Global APAC Positive Displacement Pumps Market Volume K Unit Forecast, by Country 2019 & 2032
- Table 51: United Kingdom APAC Positive Displacement Pumps Market Revenue (Million) Forecast, by Application 2019 & 2032
- Table 52: United Kingdom APAC Positive Displacement Pumps Market Volume (K Unit) Forecast, by Application 2019 & 2032
- Table 53: Germany APAC Positive Displacement Pumps Market Revenue (Million) Forecast, by Application 2019 & 2032
- Table 54: Germany APAC Positive Displacement Pumps Market Volume (K Unit) Forecast, by Application 2019 & 2032
- Table 55: France APAC Positive Displacement Pumps Market Revenue (Million) Forecast, by Application 2019 & 2032
- Table 56: France APAC Positive Displacement Pumps Market Volume (K Unit) Forecast, by Application 2019 & 2032
- Table 57: Italy APAC Positive Displacement Pumps Market Revenue (Million) Forecast, by Application 2019 & 2032
- Table 58: Italy APAC Positive Displacement Pumps Market Volume (K Unit) Forecast, by Application 2019 & 2032
- Table 59: Spain APAC Positive Displacement Pumps Market Revenue (Million) Forecast, by Application 2019 & 2032
- Table 60: Spain APAC Positive Displacement Pumps Market Volume (K Unit) Forecast, by Application 2019 & 2032
- Table 61: Russia APAC Positive Displacement Pumps Market Revenue (Million) Forecast, by Application 2019 & 2032
- Table 62: Russia APAC Positive Displacement Pumps Market Volume (K Unit) Forecast, by Application 2019 & 2032
- Table 63: Benelux APAC Positive Displacement Pumps Market Revenue (Million) Forecast, by Application 2019 & 2032
- Table 64: Benelux APAC Positive Displacement Pumps Market Volume (K Unit) Forecast, by Application 2019 & 2032
- Table 65: Nordics APAC Positive Displacement Pumps Market Revenue (Million) Forecast, by Application 2019 & 2032
- Table 66: Nordics APAC Positive Displacement Pumps Market Volume (K Unit) Forecast, by Application 2019 & 2032
- Table 67: Rest of Europe APAC Positive Displacement Pumps Market Revenue (Million) Forecast, by Application 2019 & 2032
- Table 68: Rest of Europe APAC Positive Displacement Pumps Market Volume (K Unit) Forecast, by Application 2019 & 2032
- Table 69: Global APAC Positive Displacement Pumps Market Revenue Million Forecast, by Type 2019 & 2032
- Table 70: Global APAC Positive Displacement Pumps Market Volume K Unit Forecast, by Type 2019 & 2032
- Table 71: Global APAC Positive Displacement Pumps Market Revenue Million Forecast, by End-user Industry 2019 & 2032
- Table 72: Global APAC Positive Displacement Pumps Market Volume K Unit Forecast, by End-user Industry 2019 & 2032
- Table 73: Global APAC Positive Displacement Pumps Market Revenue Million Forecast, by Country 2019 & 2032
- Table 74: Global APAC Positive Displacement Pumps Market Volume K Unit Forecast, by Country 2019 & 2032
- Table 75: Turkey APAC Positive Displacement Pumps Market Revenue (Million) Forecast, by Application 2019 & 2032
- Table 76: Turkey APAC Positive Displacement Pumps Market Volume (K Unit) Forecast, by Application 2019 & 2032
- Table 77: Israel APAC Positive Displacement Pumps Market Revenue (Million) Forecast, by Application 2019 & 2032
- Table 78: Israel APAC Positive Displacement Pumps Market Volume (K Unit) Forecast, by Application 2019 & 2032
- Table 79: GCC APAC Positive Displacement Pumps Market Revenue (Million) Forecast, by Application 2019 & 2032
- Table 80: GCC APAC Positive Displacement Pumps Market Volume (K Unit) Forecast, by Application 2019 & 2032
- Table 81: North Africa APAC Positive Displacement Pumps Market Revenue (Million) Forecast, by Application 2019 & 2032
- Table 82: North Africa APAC Positive Displacement Pumps Market Volume (K Unit) Forecast, by Application 2019 & 2032
- Table 83: South Africa APAC Positive Displacement Pumps Market Revenue (Million) Forecast, by Application 2019 & 2032
- Table 84: South Africa APAC Positive Displacement Pumps Market Volume (K Unit) Forecast, by Application 2019 & 2032
- Table 85: Rest of Middle East & Africa APAC Positive Displacement Pumps Market Revenue (Million) Forecast, by Application 2019 & 2032
- Table 86: Rest of Middle East & Africa APAC Positive Displacement Pumps Market Volume (K Unit) Forecast, by Application 2019 & 2032
- Table 87: Global APAC Positive Displacement Pumps Market Revenue Million Forecast, by Type 2019 & 2032
- Table 88: Global APAC Positive Displacement Pumps Market Volume K Unit Forecast, by Type 2019 & 2032
- Table 89: Global APAC Positive Displacement Pumps Market Revenue Million Forecast, by End-user Industry 2019 & 2032
- Table 90: Global APAC Positive Displacement Pumps Market Volume K Unit Forecast, by End-user Industry 2019 & 2032
- Table 91: Global APAC Positive Displacement Pumps Market Revenue Million Forecast, by Country 2019 & 2032
- Table 92: Global APAC Positive Displacement Pumps Market Volume K Unit Forecast, by Country 2019 & 2032
- Table 93: China APAC Positive Displacement Pumps Market Revenue (Million) Forecast, by Application 2019 & 2032
- Table 94: China APAC Positive Displacement Pumps Market Volume (K Unit) Forecast, by Application 2019 & 2032
- Table 95: India APAC Positive Displacement Pumps Market Revenue (Million) Forecast, by Application 2019 & 2032
- Table 96: India APAC Positive Displacement Pumps Market Volume (K Unit) Forecast, by Application 2019 & 2032
- Table 97: Japan APAC Positive Displacement Pumps Market Revenue (Million) Forecast, by Application 2019 & 2032
- Table 98: Japan APAC Positive Displacement Pumps Market Volume (K Unit) Forecast, by Application 2019 & 2032
- Table 99: South Korea APAC Positive Displacement Pumps Market Revenue (Million) Forecast, by Application 2019 & 2032
- Table 100: South Korea APAC Positive Displacement Pumps Market Volume (K Unit) Forecast, by Application 2019 & 2032
- Table 101: ASEAN APAC Positive Displacement Pumps Market Revenue (Million) Forecast, by Application 2019 & 2032
- Table 102: ASEAN APAC Positive Displacement Pumps Market Volume (K Unit) Forecast, by Application 2019 & 2032
- Table 103: Oceania APAC Positive Displacement Pumps Market Revenue (Million) Forecast, by Application 2019 & 2032
- Table 104: Oceania APAC Positive Displacement Pumps Market Volume (K Unit) Forecast, by Application 2019 & 2032
- Table 105: Rest of Asia Pacific APAC Positive Displacement Pumps Market Revenue (Million) Forecast, by Application 2019 & 2032
- Table 106: Rest of Asia Pacific APAC Positive Displacement Pumps Market Volume (K Unit) Forecast, by Application 2019 & 2032
Frequently Asked Questions
1. What is the projected Compound Annual Growth Rate (CAGR) of the APAC Positive Displacement Pumps Market?
The projected CAGR is approximately 3.67%.
2. Which companies are prominent players in the APAC Positive Displacement Pumps Market?
Key companies in the market include The Weir Group PLC, Xylem Inc, KSB SE & Co KGaA, SPX Flow Inc, NETZSCH Holding, TSURUMI MANUFACTURING CO LTD , Sulzer AG, Pentair PLC, Atlas Copco, GRUNDFOS.
3. What are the main segments of the APAC Positive Displacement Pumps Market?
The market segments include Type, End-user Industry.
4. Can you provide details about the market size?
The market size is estimated to be USD XX Million as of 2022.
5. What are some drivers contributing to market growth?
Increased Focus on Wastewater Management.
6. What are the notable trends driving market growth?
Waste and Wastewater Industry is Expected to Register Significant Growth.
7. Are there any restraints impacting market growth?
Environmental and Safe Use Concerns.
8. Can you provide examples of recent developments in the market?
February 2022 - NETZSCH Pumps and Systems announced the expansion of its product portfolio with the launch of the PERIPRO peristaltic pump. The pump model is available in chemical, industrial, and food versions. Moreover, the newly launched product complements the company's well-known technologies of NEMO progressing cavity pumps, NOTOS multi screw pumps, and TORNADO rotary lobe pumps.
9. What pricing options are available for accessing the report?
Pricing options include single-user, multi-user, and enterprise licenses priced at USD 4750, USD 4950, and USD 6800 respectively.
10. Is the market size provided in terms of value or volume?
The market size is provided in terms of value, measured in Million and volume, measured in K Unit.
11. Are there any specific market keywords associated with the report?
Yes, the market keyword associated with the report is "APAC Positive Displacement Pumps Market," which aids in identifying and referencing the specific market segment covered.
12. How do I determine which pricing option suits my needs best?
The pricing options vary based on user requirements and access needs. Individual users may opt for single-user licenses, while businesses requiring broader access may choose multi-user or enterprise licenses for cost-effective access to the report.
13. Are there any additional resources or data provided in the APAC Positive Displacement Pumps Market report?
While the report offers comprehensive insights, it's advisable to review the specific contents or supplementary materials provided to ascertain if additional resources or data are available.
14. How can I stay updated on further developments or reports in the APAC Positive Displacement Pumps Market?
To stay informed about further developments, trends, and reports in the APAC Positive Displacement Pumps Market, consider subscribing to industry newsletters, following relevant companies and organizations, or regularly checking reputable industry news sources and publications.
Methodology
Step 1 - Identification of Relevant Samples Size from Population Database


Step 2 - Approaches for Defining Global Market Size (Value, Volume* & Price*)

Note*: In applicable scenarios
Step 3 - Data Sources
Primary Research
- Web Analytics
- Survey Reports
- Research Institute
- Latest Research Reports
- Opinion Leaders
Secondary Research
- Annual Reports
- White Paper
- Latest Press Release
- Industry Association
- Paid Database
- Investor Presentations

Step 4 - Data Triangulation
Involves using different sources of information in order to increase the validity of a study
These sources are likely to be stakeholders in a program - participants, other researchers, program staff, other community members, and so on.
Then we put all data in single framework & apply various statistical tools to find out the dynamic on the market.
During the analysis stage, feedback from the stakeholder groups would be compared to determine areas of agreement as well as areas of divergence
