

Key Insights
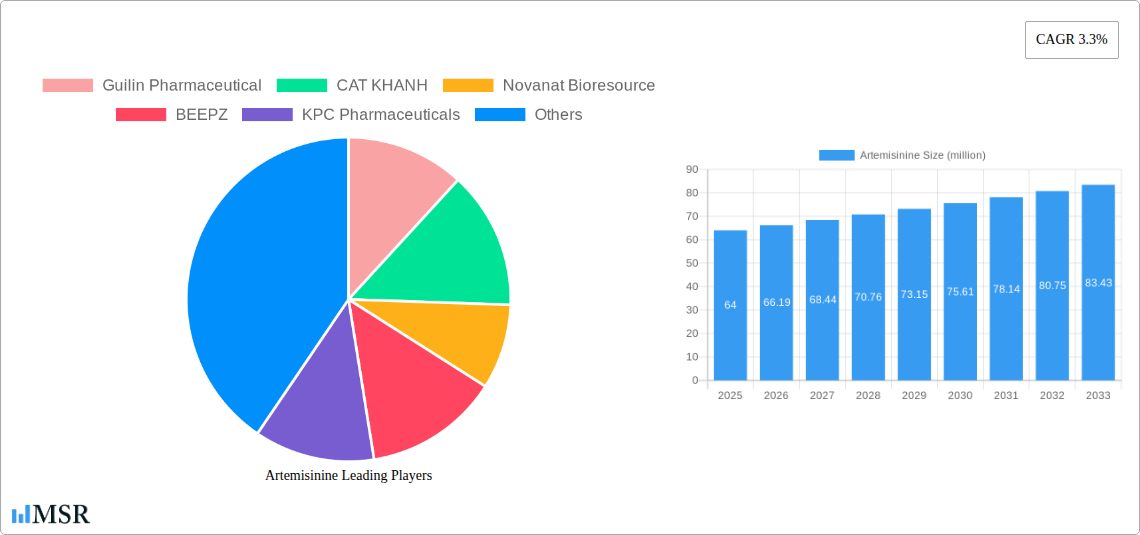
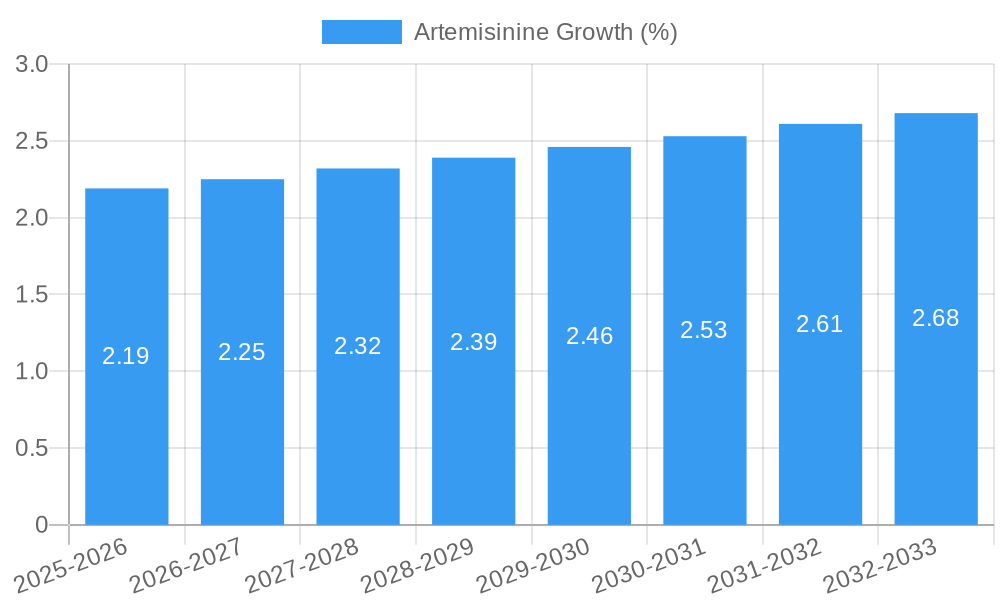
The artemisinin market, valued at $64 million in 2025, exhibits a promising growth trajectory with a projected Compound Annual Growth Rate (CAGR) of 3.3% from 2025 to 2033. This steady expansion is driven by the increasing prevalence of malaria and other parasitic diseases, particularly in developing regions, coupled with a growing awareness of artemisinin's efficacy as a frontline treatment. Furthermore, ongoing research and development efforts focused on improving artemisinin-based combination therapies (ACTs) and exploring novel drug delivery systems contribute significantly to market growth. Key players like Sanofi and Guilin Pharmaceutical are actively involved in expanding production capacity and developing innovative formulations to cater to the rising global demand. However, the market faces challenges such as the emergence of artemisinin resistance in malaria parasites, necessitating continuous innovation and the development of new treatment strategies to maintain efficacy. This necessitates a collaborative effort between pharmaceutical companies, research institutions, and public health organizations to mitigate the risk of resistance and ensure the continued availability of effective artemisinin-based therapies.
The competitive landscape is characterized by a mix of established pharmaceutical giants and smaller, specialized companies. While larger players benefit from extensive distribution networks and resources, smaller companies often focus on niche markets and innovative formulations. Geographical variations in market penetration exist, with regions experiencing high malaria prevalence driving greater demand. The forecast period of 2025-2033 anticipates a steady increase in market size, contingent upon successful efforts in managing artemisinin resistance and ongoing efforts to expand access to affordable and effective treatment in affected regions. Future market growth will be significantly influenced by the success of novel drug delivery systems and combination therapies that aim to overcome limitations of existing artemisinin-based treatments.
Artemisinine Market Report: A Comprehensive Analysis (2019-2033)
This comprehensive report provides an in-depth analysis of the global artemisinin market, offering invaluable insights for industry stakeholders, investors, and researchers. Covering the period 2019-2033, with a base year of 2025 and a forecast period of 2025-2033, this report meticulously examines market dynamics, growth drivers, challenges, and emerging opportunities within the artemisinin sector. The report leverages data from the historical period (2019-2024) to project future trends accurately, incorporating millions in all market value figures.
Artemisinine Market Concentration & Dynamics
This section assesses the competitive landscape of the artemisinin market, analyzing market concentration, innovation, regulatory aspects, substitute products, end-user trends, and mergers & acquisitions (M&A) activity. The global artemisinin market, valued at $xx million in 2024, is expected to reach $xx million by 2033, exhibiting a CAGR of xx%.
Market Concentration: The market exhibits a moderately concentrated structure with key players holding significant market share. Guilin Pharmaceutical and Sanofi are estimated to hold approximately xx% and xx% of the market share respectively, in 2025. Smaller players like Novanat Bioresource and KPC Pharmaceuticals contribute to the remaining market share.
Innovation Ecosystem: The artemisinin market witnesses continuous innovation focused on improving drug delivery systems and developing artemisinin-based combination therapies (ACTs) to combat drug resistance.
Regulatory Frameworks: Stringent regulatory approvals and guidelines from bodies like the WHO significantly impact market dynamics. Compliance requirements drive production costs and influence market entry.
Substitute Products: The availability of alternative antimalarial drugs creates competitive pressure, impacting the market share of artemisinin-based medications.
End-User Trends: Increasing prevalence of malaria in endemic regions and rising healthcare expenditure drive market demand for artemisinin-based therapies.
M&A Activity: The past five years have witnessed xx M&A deals, indicating consolidation within the artemisinin sector. These activities have primarily focused on strengthening supply chains and expanding geographical reach.
Artemisinine Industry Insights & Trends
This section delves into the key factors shaping the artemisinin market's trajectory. The market's growth is fueled by several factors, including a rising prevalence of malaria, increasing government initiatives to combat malaria, and technological advancements leading to improved artemisinin-based therapies. The global market size is projected to increase from $xx million in 2025 to $xx million by 2033, driven by a xx% CAGR.
The emergence of artemisinin resistance necessitates continuous research and development efforts, pushing the industry toward innovative drug delivery systems and new drug combinations. Shifting consumer preferences toward more effective and convenient treatment options also impact market dynamics. The rise of counterfeit drugs poses a significant challenge, impacting market stability and patient safety.
Key Markets & Segments Leading Artemisinine
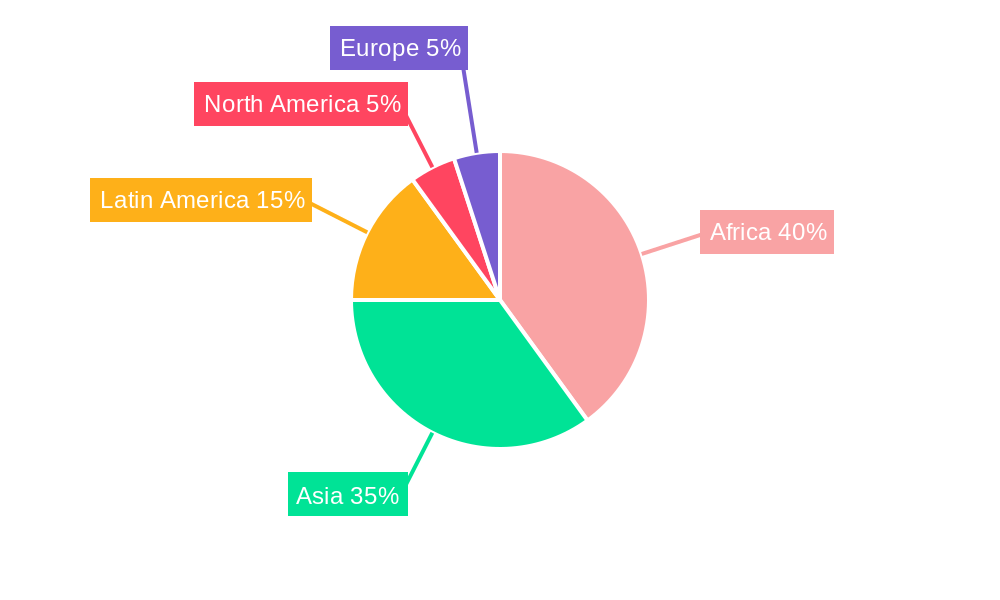
This section identifies the dominant regions and segments within the artemisinin market. Africa remains the leading market due to the high prevalence of malaria.
- Drivers of Market Dominance in Africa:
- High malaria prevalence rates.
- Increasing government spending on healthcare.
- Expanding healthcare infrastructure.
- Growing awareness about malaria prevention and treatment.
Detailed analysis shows that the African market accounts for xx% of the global artemisinin market, driven by high disease burden, government initiatives (e.g., malaria eradication programs), and increasing healthcare investments. While other regions contribute significantly, the substantial demand in Africa ensures its continued dominance. The Asia-Pacific region is also a key market due to its large population and high disease burden, followed by South America, and others.
Artemisinine Product Developments
Recent years have seen significant advancements in artemisinin-based therapies, focusing on improved formulations, enhanced efficacy, and reduced side effects. This includes the development of artemisinin-based combination therapies (ACTs), nano-formulations for improved drug delivery, and sustained-release preparations for longer efficacy. These innovations aim to improve patient compliance and address the challenge of artemisinin resistance.
Challenges in the Artemisinine Market
The artemisinin market faces several challenges including the rising incidence of artemisinin resistance, supply chain disruptions, and the complexities of regulatory approvals. These factors contribute to production costs, limit market access, and restrain market growth. The impact of these challenges is estimated to represent a xx% reduction in potential market growth over the forecast period.
Forces Driving Artemisinine Growth
Several factors contribute to the long-term growth of the artemisinin market. These include technological advancements leading to improved drug efficacy and safety, increased investment in research and development, growing government initiatives to combat malaria, and expanding healthcare infrastructure in endemic regions. Furthermore, collaborations between pharmaceutical companies and research institutions are accelerating the development of innovative artemisinin-based therapies.
Long-Term Growth Catalysts in Artemisinin
Long-term growth for artemisinin is driven by continuous innovation in drug delivery systems, the development of new artemisinin derivatives, and the expansion of partnerships between pharmaceutical companies and healthcare organizations in endemic regions. Increased investment in research and development, particularly in addressing artemisinin resistance, will further contribute to sustained market expansion.
Emerging Opportunities in Artemisinine
Emerging opportunities lie in the development of novel artemisinin-based combination therapies (ACTs), personalized medicine approaches, and improved diagnostic tools. Expanding into new markets with high malaria prevalence, and leveraging digital technologies for improved supply chain management, represent significant growth avenues. The development of novel drug delivery systems to enhance efficacy and reduce side effects also presents a substantial opportunity.
Leading Players in the Artemisinine Sector
- Guilin Pharmaceutical
- CAT KHANH
- Novanat Bioresource
- BEEPZ
- KPC Pharmaceuticals
- BIONEXX
- Guangxi xiancaotang
- Sanofi
- Natural Bio-engineering
- Kerui nanhai
Key Milestones in Artemisinine Industry
- 2020: Successful completion of Phase III clinical trials for a new artemisinin derivative by [Company Name, if available].
- 2021: Launch of a new artemisinin-based combination therapy (ACT) by Sanofi.
- 2022: Regulatory approval granted for a novel artemisinin formulation in [Country, if available].
- 2023: A major M&A deal involving [Company Names, if available].
- 2024: Significant investment in R&D by [Company Name, if available] focusing on Artemisinin resistance.
Strategic Outlook for Artemisinine Market
The artemisinin market holds significant future potential, driven by continuous innovation, expanding healthcare infrastructure, and a growing focus on global health initiatives. Strategic opportunities include investing in R&D to develop next-generation artemisinin-based therapies, expanding into new markets, and strengthening partnerships to improve access to affordable and effective antimalarial treatments. The focus on addressing artemisinin resistance and optimizing drug delivery systems will be key factors shaping future market dynamics and growth.
Artemisinine Segmentation
-
1. Application
- 1.1. Injections
- 1.2. Tablets
- 1.3. Others
-
2. Types
- 2.1. Extraction from Artemisia annua
- 2.2. Semisynthetic Artemisinine
Artemisinine Segmentation By Geography
-
1. North America
- 1.1. United States
- 1.2. Canada
- 1.3. Mexico
-
2. South America
- 2.1. Brazil
- 2.2. Argentina
- 2.3. Rest of South America
-
3. Europe
- 3.1. United Kingdom
- 3.2. Germany
- 3.3. France
- 3.4. Italy
- 3.5. Spain
- 3.6. Russia
- 3.7. Benelux
- 3.8. Nordics
- 3.9. Rest of Europe
-
4. Middle East & Africa
- 4.1. Turkey
- 4.2. Israel
- 4.3. GCC
- 4.4. North Africa
- 4.5. South Africa
- 4.6. Rest of Middle East & Africa
-
5. Asia Pacific
- 5.1. China
- 5.2. India
- 5.3. Japan
- 5.4. South Korea
- 5.5. ASEAN
- 5.6. Oceania
- 5.7. Rest of Asia Pacific
Artemisinine REPORT HIGHLIGHTS
| Aspects | Details |
|---|---|
| Study Period | 2019-2033 |
| Base Year | 2024 |
| Estimated Year | 2025 |
| Forecast Period | 2025-2033 |
| Historical Period | 2019-2024 |
| Growth Rate | CAGR of 3.3% from 2019-2033 |
| Segmentation |
|
Table of Contents
- 1. Introduction
- 1.1. Research Scope
- 1.2. Market Segmentation
- 1.3. Research Methodology
- 1.4. Definitions and Assumptions
- 2. Executive Summary
- 2.1. Introduction
- 3. Market Dynamics
- 3.1. Introduction
- 3.2. Market Drivers
- 3.3. Market Restrains
- 3.4. Market Trends
- 4. Market Factor Analysis
- 4.1. Porters Five Forces
- 4.2. Supply/Value Chain
- 4.3. PESTEL analysis
- 4.4. Market Entropy
- 4.5. Patent/Trademark Analysis
- 5. Global Artemisinine Analysis, Insights and Forecast, 2019-2031
- 5.1. Market Analysis, Insights and Forecast - by Application
- 5.1.1. Injections
- 5.1.2. Tablets
- 5.1.3. Others
- 5.2. Market Analysis, Insights and Forecast - by Types
- 5.2.1. Extraction from Artemisia annua
- 5.2.2. Semisynthetic Artemisinine
- 5.3. Market Analysis, Insights and Forecast - by Region
- 5.3.1. North America
- 5.3.2. South America
- 5.3.3. Europe
- 5.3.4. Middle East & Africa
- 5.3.5. Asia Pacific
- 5.1. Market Analysis, Insights and Forecast - by Application
- 6. North America Artemisinine Analysis, Insights and Forecast, 2019-2031
- 6.1. Market Analysis, Insights and Forecast - by Application
- 6.1.1. Injections
- 6.1.2. Tablets
- 6.1.3. Others
- 6.2. Market Analysis, Insights and Forecast - by Types
- 6.2.1. Extraction from Artemisia annua
- 6.2.2. Semisynthetic Artemisinine
- 6.1. Market Analysis, Insights and Forecast - by Application
- 7. South America Artemisinine Analysis, Insights and Forecast, 2019-2031
- 7.1. Market Analysis, Insights and Forecast - by Application
- 7.1.1. Injections
- 7.1.2. Tablets
- 7.1.3. Others
- 7.2. Market Analysis, Insights and Forecast - by Types
- 7.2.1. Extraction from Artemisia annua
- 7.2.2. Semisynthetic Artemisinine
- 7.1. Market Analysis, Insights and Forecast - by Application
- 8. Europe Artemisinine Analysis, Insights and Forecast, 2019-2031
- 8.1. Market Analysis, Insights and Forecast - by Application
- 8.1.1. Injections
- 8.1.2. Tablets
- 8.1.3. Others
- 8.2. Market Analysis, Insights and Forecast - by Types
- 8.2.1. Extraction from Artemisia annua
- 8.2.2. Semisynthetic Artemisinine
- 8.1. Market Analysis, Insights and Forecast - by Application
- 9. Middle East & Africa Artemisinine Analysis, Insights and Forecast, 2019-2031
- 9.1. Market Analysis, Insights and Forecast - by Application
- 9.1.1. Injections
- 9.1.2. Tablets
- 9.1.3. Others
- 9.2. Market Analysis, Insights and Forecast - by Types
- 9.2.1. Extraction from Artemisia annua
- 9.2.2. Semisynthetic Artemisinine
- 9.1. Market Analysis, Insights and Forecast - by Application
- 10. Asia Pacific Artemisinine Analysis, Insights and Forecast, 2019-2031
- 10.1. Market Analysis, Insights and Forecast - by Application
- 10.1.1. Injections
- 10.1.2. Tablets
- 10.1.3. Others
- 10.2. Market Analysis, Insights and Forecast - by Types
- 10.2.1. Extraction from Artemisia annua
- 10.2.2. Semisynthetic Artemisinine
- 10.1. Market Analysis, Insights and Forecast - by Application
- 11. Competitive Analysis
- 11.1. Global Market Share Analysis 2024
- 11.2. Company Profiles
- 11.2.1 Guilin Pharmaceutical
- 11.2.1.1. Overview
- 11.2.1.2. Products
- 11.2.1.3. SWOT Analysis
- 11.2.1.4. Recent Developments
- 11.2.1.5. Financials (Based on Availability)
- 11.2.2 CAT KHANH
- 11.2.2.1. Overview
- 11.2.2.2. Products
- 11.2.2.3. SWOT Analysis
- 11.2.2.4. Recent Developments
- 11.2.2.5. Financials (Based on Availability)
- 11.2.3 Novanat Bioresource
- 11.2.3.1. Overview
- 11.2.3.2. Products
- 11.2.3.3. SWOT Analysis
- 11.2.3.4. Recent Developments
- 11.2.3.5. Financials (Based on Availability)
- 11.2.4 BEEPZ
- 11.2.4.1. Overview
- 11.2.4.2. Products
- 11.2.4.3. SWOT Analysis
- 11.2.4.4. Recent Developments
- 11.2.4.5. Financials (Based on Availability)
- 11.2.5 KPC Pharmaceuticals
- 11.2.5.1. Overview
- 11.2.5.2. Products
- 11.2.5.3. SWOT Analysis
- 11.2.5.4. Recent Developments
- 11.2.5.5. Financials (Based on Availability)
- 11.2.6 BIONEXX
- 11.2.6.1. Overview
- 11.2.6.2. Products
- 11.2.6.3. SWOT Analysis
- 11.2.6.4. Recent Developments
- 11.2.6.5. Financials (Based on Availability)
- 11.2.7 Guangxi xiancaotang
- 11.2.7.1. Overview
- 11.2.7.2. Products
- 11.2.7.3. SWOT Analysis
- 11.2.7.4. Recent Developments
- 11.2.7.5. Financials (Based on Availability)
- 11.2.8 Sanofi
- 11.2.8.1. Overview
- 11.2.8.2. Products
- 11.2.8.3. SWOT Analysis
- 11.2.8.4. Recent Developments
- 11.2.8.5. Financials (Based on Availability)
- 11.2.9 Natural Bio-engineering
- 11.2.9.1. Overview
- 11.2.9.2. Products
- 11.2.9.3. SWOT Analysis
- 11.2.9.4. Recent Developments
- 11.2.9.5. Financials (Based on Availability)
- 11.2.10 Kerui nanhai
- 11.2.10.1. Overview
- 11.2.10.2. Products
- 11.2.10.3. SWOT Analysis
- 11.2.10.4. Recent Developments
- 11.2.10.5. Financials (Based on Availability)
- 11.2.1 Guilin Pharmaceutical
List of Figures
- Figure 1: Global Artemisinine Revenue Breakdown (million, %) by Region 2024 & 2032
- Figure 2: North America Artemisinine Revenue (million), by Application 2024 & 2032
- Figure 3: North America Artemisinine Revenue Share (%), by Application 2024 & 2032
- Figure 4: North America Artemisinine Revenue (million), by Types 2024 & 2032
- Figure 5: North America Artemisinine Revenue Share (%), by Types 2024 & 2032
- Figure 6: North America Artemisinine Revenue (million), by Country 2024 & 2032
- Figure 7: North America Artemisinine Revenue Share (%), by Country 2024 & 2032
- Figure 8: South America Artemisinine Revenue (million), by Application 2024 & 2032
- Figure 9: South America Artemisinine Revenue Share (%), by Application 2024 & 2032
- Figure 10: South America Artemisinine Revenue (million), by Types 2024 & 2032
- Figure 11: South America Artemisinine Revenue Share (%), by Types 2024 & 2032
- Figure 12: South America Artemisinine Revenue (million), by Country 2024 & 2032
- Figure 13: South America Artemisinine Revenue Share (%), by Country 2024 & 2032
- Figure 14: Europe Artemisinine Revenue (million), by Application 2024 & 2032
- Figure 15: Europe Artemisinine Revenue Share (%), by Application 2024 & 2032
- Figure 16: Europe Artemisinine Revenue (million), by Types 2024 & 2032
- Figure 17: Europe Artemisinine Revenue Share (%), by Types 2024 & 2032
- Figure 18: Europe Artemisinine Revenue (million), by Country 2024 & 2032
- Figure 19: Europe Artemisinine Revenue Share (%), by Country 2024 & 2032
- Figure 20: Middle East & Africa Artemisinine Revenue (million), by Application 2024 & 2032
- Figure 21: Middle East & Africa Artemisinine Revenue Share (%), by Application 2024 & 2032
- Figure 22: Middle East & Africa Artemisinine Revenue (million), by Types 2024 & 2032
- Figure 23: Middle East & Africa Artemisinine Revenue Share (%), by Types 2024 & 2032
- Figure 24: Middle East & Africa Artemisinine Revenue (million), by Country 2024 & 2032
- Figure 25: Middle East & Africa Artemisinine Revenue Share (%), by Country 2024 & 2032
- Figure 26: Asia Pacific Artemisinine Revenue (million), by Application 2024 & 2032
- Figure 27: Asia Pacific Artemisinine Revenue Share (%), by Application 2024 & 2032
- Figure 28: Asia Pacific Artemisinine Revenue (million), by Types 2024 & 2032
- Figure 29: Asia Pacific Artemisinine Revenue Share (%), by Types 2024 & 2032
- Figure 30: Asia Pacific Artemisinine Revenue (million), by Country 2024 & 2032
- Figure 31: Asia Pacific Artemisinine Revenue Share (%), by Country 2024 & 2032
List of Tables
- Table 1: Global Artemisinine Revenue million Forecast, by Region 2019 & 2032
- Table 2: Global Artemisinine Revenue million Forecast, by Application 2019 & 2032
- Table 3: Global Artemisinine Revenue million Forecast, by Types 2019 & 2032
- Table 4: Global Artemisinine Revenue million Forecast, by Region 2019 & 2032
- Table 5: Global Artemisinine Revenue million Forecast, by Application 2019 & 2032
- Table 6: Global Artemisinine Revenue million Forecast, by Types 2019 & 2032
- Table 7: Global Artemisinine Revenue million Forecast, by Country 2019 & 2032
- Table 8: United States Artemisinine Revenue (million) Forecast, by Application 2019 & 2032
- Table 9: Canada Artemisinine Revenue (million) Forecast, by Application 2019 & 2032
- Table 10: Mexico Artemisinine Revenue (million) Forecast, by Application 2019 & 2032
- Table 11: Global Artemisinine Revenue million Forecast, by Application 2019 & 2032
- Table 12: Global Artemisinine Revenue million Forecast, by Types 2019 & 2032
- Table 13: Global Artemisinine Revenue million Forecast, by Country 2019 & 2032
- Table 14: Brazil Artemisinine Revenue (million) Forecast, by Application 2019 & 2032
- Table 15: Argentina Artemisinine Revenue (million) Forecast, by Application 2019 & 2032
- Table 16: Rest of South America Artemisinine Revenue (million) Forecast, by Application 2019 & 2032
- Table 17: Global Artemisinine Revenue million Forecast, by Application 2019 & 2032
- Table 18: Global Artemisinine Revenue million Forecast, by Types 2019 & 2032
- Table 19: Global Artemisinine Revenue million Forecast, by Country 2019 & 2032
- Table 20: United Kingdom Artemisinine Revenue (million) Forecast, by Application 2019 & 2032
- Table 21: Germany Artemisinine Revenue (million) Forecast, by Application 2019 & 2032
- Table 22: France Artemisinine Revenue (million) Forecast, by Application 2019 & 2032
- Table 23: Italy Artemisinine Revenue (million) Forecast, by Application 2019 & 2032
- Table 24: Spain Artemisinine Revenue (million) Forecast, by Application 2019 & 2032
- Table 25: Russia Artemisinine Revenue (million) Forecast, by Application 2019 & 2032
- Table 26: Benelux Artemisinine Revenue (million) Forecast, by Application 2019 & 2032
- Table 27: Nordics Artemisinine Revenue (million) Forecast, by Application 2019 & 2032
- Table 28: Rest of Europe Artemisinine Revenue (million) Forecast, by Application 2019 & 2032
- Table 29: Global Artemisinine Revenue million Forecast, by Application 2019 & 2032
- Table 30: Global Artemisinine Revenue million Forecast, by Types 2019 & 2032
- Table 31: Global Artemisinine Revenue million Forecast, by Country 2019 & 2032
- Table 32: Turkey Artemisinine Revenue (million) Forecast, by Application 2019 & 2032
- Table 33: Israel Artemisinine Revenue (million) Forecast, by Application 2019 & 2032
- Table 34: GCC Artemisinine Revenue (million) Forecast, by Application 2019 & 2032
- Table 35: North Africa Artemisinine Revenue (million) Forecast, by Application 2019 & 2032
- Table 36: South Africa Artemisinine Revenue (million) Forecast, by Application 2019 & 2032
- Table 37: Rest of Middle East & Africa Artemisinine Revenue (million) Forecast, by Application 2019 & 2032
- Table 38: Global Artemisinine Revenue million Forecast, by Application 2019 & 2032
- Table 39: Global Artemisinine Revenue million Forecast, by Types 2019 & 2032
- Table 40: Global Artemisinine Revenue million Forecast, by Country 2019 & 2032
- Table 41: China Artemisinine Revenue (million) Forecast, by Application 2019 & 2032
- Table 42: India Artemisinine Revenue (million) Forecast, by Application 2019 & 2032
- Table 43: Japan Artemisinine Revenue (million) Forecast, by Application 2019 & 2032
- Table 44: South Korea Artemisinine Revenue (million) Forecast, by Application 2019 & 2032
- Table 45: ASEAN Artemisinine Revenue (million) Forecast, by Application 2019 & 2032
- Table 46: Oceania Artemisinine Revenue (million) Forecast, by Application 2019 & 2032
- Table 47: Rest of Asia Pacific Artemisinine Revenue (million) Forecast, by Application 2019 & 2032
Frequently Asked Questions
1. What is the projected Compound Annual Growth Rate (CAGR) of the Artemisinine?
The projected CAGR is approximately 3.3%.
2. Which companies are prominent players in the Artemisinine?
Key companies in the market include Guilin Pharmaceutical, CAT KHANH, Novanat Bioresource, BEEPZ, KPC Pharmaceuticals, BIONEXX, Guangxi xiancaotang, Sanofi, Natural Bio-engineering, Kerui nanhai.
3. What are the main segments of the Artemisinine?
The market segments include Application, Types.
4. Can you provide details about the market size?
The market size is estimated to be USD 64 million as of 2022.
5. What are some drivers contributing to market growth?
N/A
6. What are the notable trends driving market growth?
N/A
7. Are there any restraints impacting market growth?
N/A
8. Can you provide examples of recent developments in the market?
N/A
9. What pricing options are available for accessing the report?
Pricing options include single-user, multi-user, and enterprise licenses priced at USD 2900.00, USD 4350.00, and USD 5800.00 respectively.
10. Is the market size provided in terms of value or volume?
The market size is provided in terms of value, measured in million.
11. Are there any specific market keywords associated with the report?
Yes, the market keyword associated with the report is "Artemisinine," which aids in identifying and referencing the specific market segment covered.
12. How do I determine which pricing option suits my needs best?
The pricing options vary based on user requirements and access needs. Individual users may opt for single-user licenses, while businesses requiring broader access may choose multi-user or enterprise licenses for cost-effective access to the report.
13. Are there any additional resources or data provided in the Artemisinine report?
While the report offers comprehensive insights, it's advisable to review the specific contents or supplementary materials provided to ascertain if additional resources or data are available.
14. How can I stay updated on further developments or reports in the Artemisinine?
To stay informed about further developments, trends, and reports in the Artemisinine, consider subscribing to industry newsletters, following relevant companies and organizations, or regularly checking reputable industry news sources and publications.
Methodology
Step 1 - Identification of Relevant Samples Size from Population Database


Step 2 - Approaches for Defining Global Market Size (Value, Volume* & Price*)

Note*: In applicable scenarios
Step 3 - Data Sources
Primary Research
- Web Analytics
- Survey Reports
- Research Institute
- Latest Research Reports
- Opinion Leaders
Secondary Research
- Annual Reports
- White Paper
- Latest Press Release
- Industry Association
- Paid Database
- Investor Presentations

Step 4 - Data Triangulation
Involves using different sources of information in order to increase the validity of a study
These sources are likely to be stakeholders in a program - participants, other researchers, program staff, other community members, and so on.
Then we put all data in single framework & apply various statistical tools to find out the dynamic on the market.
During the analysis stage, feedback from the stakeholder groups would be compared to determine areas of agreement as well as areas of divergence
