

Key Insights
The Medical Image Exchange Systems (MIES) market is experiencing robust growth, projected to reach a substantial size driven by several key factors. The market's Compound Annual Growth Rate (CAGR) of 6.96% from 2019 to 2024 indicates a consistent upward trajectory. This expansion is fueled by the increasing adoption of digital imaging technologies in healthcare, the rising prevalence of chronic diseases requiring frequent imaging, and the growing need for efficient and secure image sharing across healthcare systems. The shift towards value-based care models, emphasizing improved patient outcomes and reduced costs, further incentivizes the use of MIES to streamline workflows and enhance diagnostic accuracy. Hospitals and diagnostic centers are leading adopters, followed by ambulatory surgery centers, driving demand for both Vendor Neutral Archive (VNA) and Picture Archiving and Communication Systems (PACS) solutions. Technological advancements like cloud-based PACS and AI-powered image analysis are further accelerating market penetration. While data security and interoperability challenges remain potential restraints, the overall market outlook remains positive, with significant growth expected through 2033.
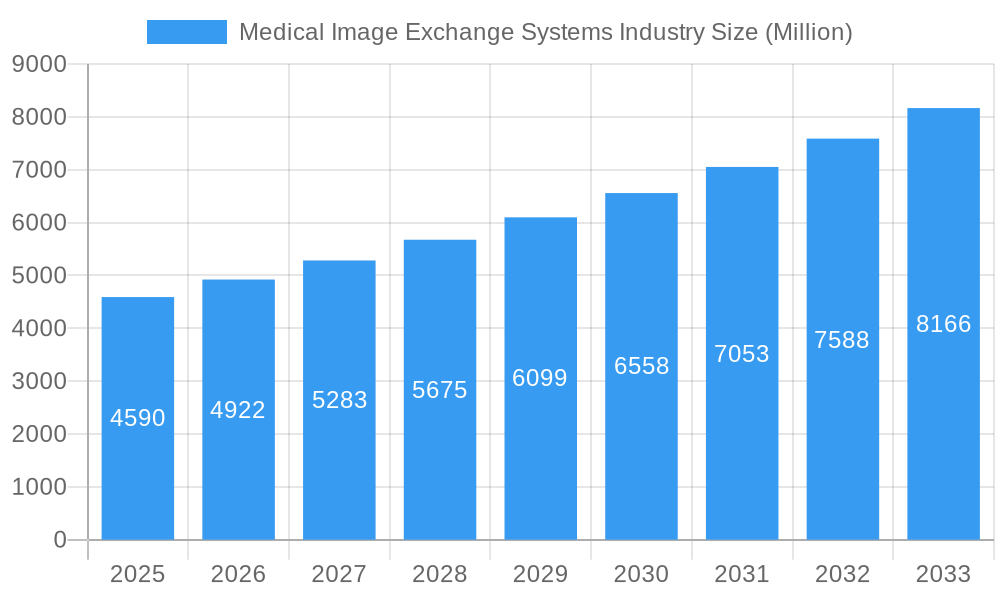
Medical Image Exchange Systems Industry Market Size (In Billion)
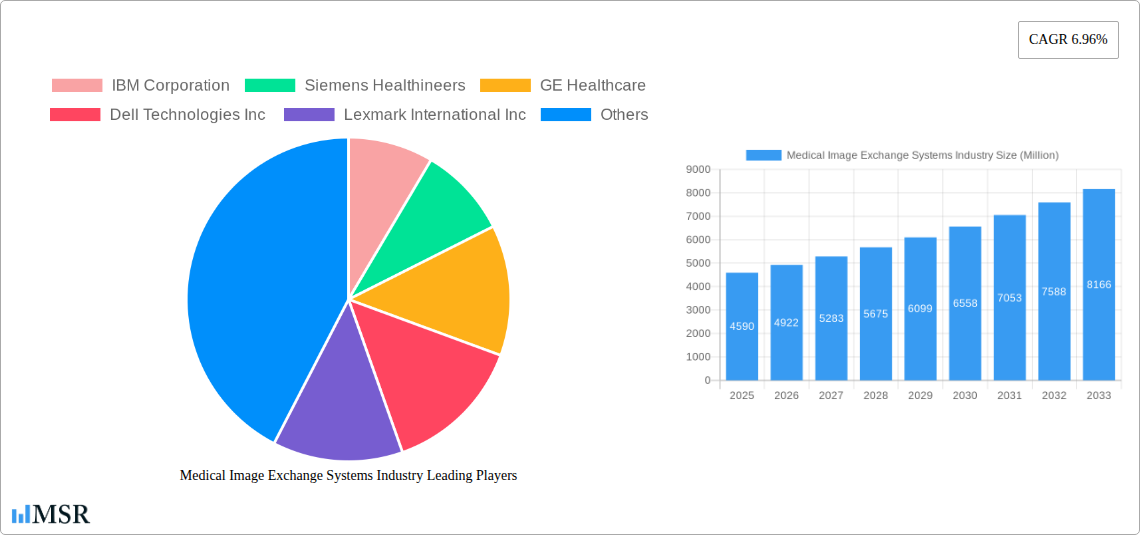
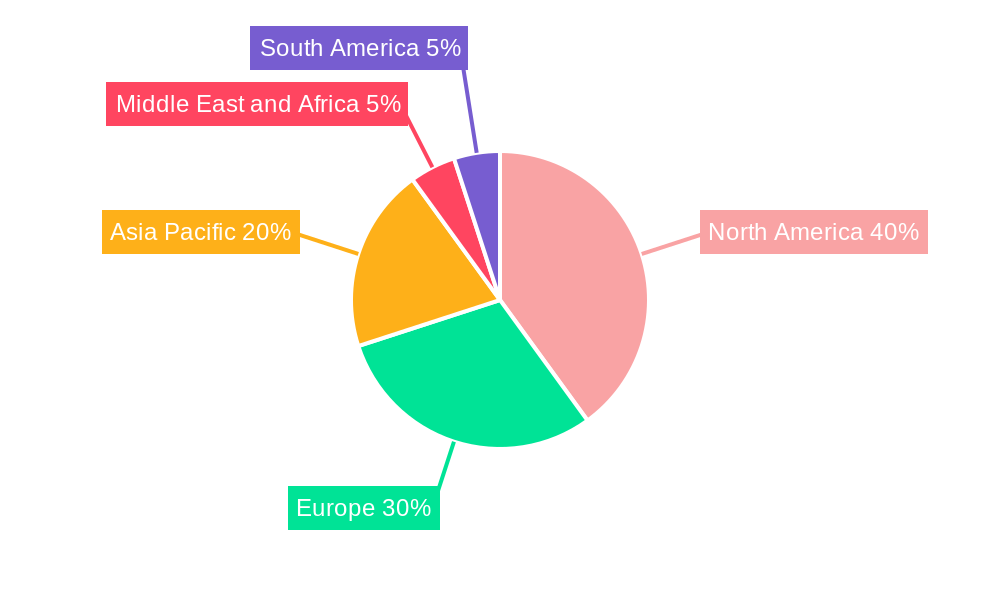
Market segmentation reveals a strong preference for VNA and PACS systems. However, the "other systems" segment likely encompasses emerging technologies and specialized solutions which will likely contribute to the overall growth. Geographic analysis indicates strong market presence in North America and Europe, driven by established healthcare infrastructure and higher adoption rates of advanced technologies. However, Asia-Pacific is expected to show significant growth potential in the coming years due to rising healthcare expenditure and technological advancements within the region. Major players like IBM, Siemens Healthineers, GE Healthcare, and others are strategically investing in research and development, product innovation, and acquisitions to consolidate their market positions. The competitive landscape is expected to remain dynamic, with further industry consolidation and the emergence of niche players anticipated.
Medical Image Exchange Systems Industry Company Market Share
Medical Image Exchange Systems Industry: A Comprehensive Market Report (2019-2033)
This comprehensive report provides an in-depth analysis of the Medical Image Exchange Systems industry, offering invaluable insights for stakeholders, investors, and industry professionals. The report covers market dynamics, key segments, leading players, technological advancements, and future growth prospects, leveraging data from the historical period (2019-2024), base year (2025), and forecast period (2025-2033). The global market is projected to reach xx Million by 2033, exhibiting a CAGR of xx% during the forecast period.
Medical Image Exchange Systems Industry Market Concentration & Dynamics
The Medical Image Exchange Systems market is moderately concentrated, with several major players holding significant market share. IBM Corporation, Siemens Healthineers, and GE Healthcare are among the dominant players, collectively commanding an estimated xx% of the market in 2025. However, the market also features a number of smaller, specialized companies offering niche solutions.
The industry's innovation ecosystem is highly dynamic, driven by advancements in cloud computing, artificial intelligence (AI), and big data analytics. Regulatory frameworks, such as HIPAA in the US and GDPR in Europe, significantly impact market operations and data security protocols. Substitute products, including legacy systems and manual processes, still exist but face increasing pressure from the efficiency and scalability of modern image exchange systems.
End-user trends show a strong preference for vendor-neutral archives (VNAs) and cloud-based solutions to enhance interoperability and reduce IT infrastructure costs. Mergers and acquisitions (M&A) activity has been moderate in recent years, with an estimated xx M&A deals occurring between 2019 and 2024, primarily focused on expanding product portfolios and geographic reach.
Medical Image Exchange Systems Industry Industry Insights & Trends
The Medical Image Exchange Systems market is experiencing robust growth, driven by the increasing volume of medical images generated globally, the rising adoption of telehealth, and the growing demand for efficient and secure image sharing across healthcare networks. The market size was valued at xx Million in 2025 and is projected to reach xx Million by 2033. This growth is fueled by technological advancements, such as AI-powered image analysis and cloud-based storage solutions, which enhance diagnostic accuracy, streamline workflows, and reduce costs.
Evolving consumer behavior, characterized by increased patient empowerment and demand for personalized healthcare, further drives the adoption of image exchange systems that facilitate seamless data sharing among healthcare providers and patients. Technological disruptions, such as the widespread adoption of 5G and the expanding use of edge computing, are transforming the landscape, enabling faster image transmission and real-time analysis. The market faces challenges from cybersecurity threats and the need for robust data protection measures, requiring continuous investment in security technologies.
Key Markets & Segments Leading Medical Image Exchange Systems Industry
The North American market currently dominates the Medical Image Exchange Systems industry, driven by strong technological advancements, robust healthcare infrastructure, and high healthcare spending. However, Asia-Pacific is projected to witness the fastest growth during the forecast period, fueled by increasing healthcare investment, rising disposable incomes, and the expanding adoption of advanced imaging technologies.
Dominant End-Users:
- Hospitals: Largest segment, driven by high image volumes and need for efficient workflow management.
- Diagnostic Centers: Significant growth due to the increasing demand for specialized diagnostic services.
- Ambulatory Surgery Centers: Growing adoption due to the rise in outpatient procedures.
Dominant Systems:
- Vendor Neutral Archive (VNA): Rapid growth due to enhanced interoperability and scalability.
- Picture Archiving and Communications System (PACS): Continues to be a key segment, although VNAs are gaining market share.
- Other Systems: Includes specialized solutions for specific imaging modalities and workflows.
Market drivers in these segments include: economic growth, increasing government funding for healthcare infrastructure, growing adoption of advanced imaging technologies, stringent regulatory requirements for data security and interoperability, and a rising awareness about the importance of timely and accurate diagnosis.
Medical Image Exchange Systems Industry Product Developments
Recent product innovations focus on AI-powered image analysis, cloud-based platforms, and improved interoperability features. These advancements enhance diagnostic accuracy, streamline workflows, and improve access to patient data across healthcare systems. For example, the introduction of cloud-enabled enterprise imaging informatics and analytics solutions represents a significant leap forward in data management and analysis capabilities. Competitive edges are gained through superior image quality, advanced analytics, robust security features, and user-friendly interfaces.
Challenges in the Medical Image Exchange Systems Industry Market
The Medical Image Exchange Systems market faces several challenges, including regulatory hurdles related to data privacy and security (estimated to impact market growth by xx% by 2030), the complexity of integrating systems across different healthcare organizations, supply chain disruptions affecting the availability of components (estimated to cause a xx Million loss in revenue annually), and intense competition from established players and emerging startups. These factors can hinder market growth and adoption.
Forces Driving Medical Image Exchange Systems Industry Growth
Key growth drivers include technological advancements (AI, cloud computing), increasing government investments in healthcare infrastructure, the growing adoption of telehealth, rising healthcare expenditure globally, and the expanding demand for improved healthcare efficiency and quality of care. For instance, government initiatives promoting electronic health records (EHR) interoperability are directly fueling demand for image exchange systems.
Long-Term Growth Catalysts in the Medical Image Exchange Systems Industry
Long-term growth will be driven by continued innovation in AI-powered image analysis, the expansion of cloud-based solutions, strategic partnerships between technology providers and healthcare organizations, and the exploration of new markets in developing economies. The integration of advanced analytics and predictive modeling will further enhance the value proposition of these systems.
Emerging Opportunities in Medical Image Exchange Systems Industry
Emerging opportunities lie in the development of specialized solutions for specific imaging modalities, the integration of wearables and IoT devices for remote patient monitoring, the growing demand for personalized medicine, and the expansion into untapped markets in emerging economies. The incorporation of blockchain technology for enhanced data security is another promising area.
Leading Players in the Medical Image Exchange Systems Industry Sector
- IBM Corporation
- Siemens Healthineers
- GE Healthcare
- Dell Technologies Inc
- Lexmark International Inc
- BridgeHead Software
- Koninklijke Philips NV
- Carestream Health Inc (Onex Corporation)
- McKesson Corporation
- Novarad Corporation
- Agfa-Gevaert Group
- Fujifilm Holdings Corporation
Key Milestones in Medical Image Exchange Systems Industry Industry
- March 2022: Intelerad Medical Systems launched its new Enterprise Imaging and Informatics Suite, significantly enhancing vendor-neutral data integration and accessibility. This launch accelerated the market shift towards vendor-neutral solutions.
- March 2022: Philips introduced cloud-enabled enterprise imaging informatics and analytics solutions (Philips Health Suite Interoperability), furthering the adoption of cloud-based platforms for image management and analysis. This move solidified the growing trend of cloud-based solutions.
Strategic Outlook for Medical Image Exchange Systems Industry Market
The future of the Medical Image Exchange Systems market is bright, driven by continued technological innovation, increasing healthcare spending, and the rising demand for efficient and secure image management. Strategic opportunities exist for companies focused on developing AI-powered solutions, expanding into emerging markets, and fostering strategic partnerships to broaden market reach and enhance product offerings. The market's long-term growth potential is significant, promising substantial returns for innovative players.
Medical Image Exchange Systems Industry Segmentation
-
1. System
- 1.1. Vendor Neutral Archive
- 1.2. Picture Archiving and Communications System (PACS)
- 1.3. Other Systems
-
2. End-User
- 2.1. Hospitals
- 2.2. Diagnostic Centers
- 2.3. Ambulatory Surgery Centers
Medical Image Exchange Systems Industry Segmentation By Geography
-
1. North America
- 1.1. United States
- 1.2. Canada
- 1.3. Mexico
-
2. Europe
- 2.1. Germany
- 2.2. United Kingdom
- 2.3. France
- 2.4. Italy
- 2.5. Spain
- 2.6. Rest of Europe
-
3. Asia Pacific
- 3.1. China
- 3.2. Japan
- 3.3. India
- 3.4. Australia
- 3.5. South Korea
- 3.6. Rest of Asia Pacific
-
4. Middle East and Africa
- 4.1. GCC
- 4.2. South Africa
- 4.3. Rest of Middle East and Africa
-
5. South America
- 5.1. Brazil
- 5.2. Argentina
- 5.3. Rest of South America
Medical Image Exchange Systems Industry Regional Market Share
Geographic Coverage of Medical Image Exchange Systems Industry
Medical Image Exchange Systems Industry REPORT HIGHLIGHTS
| Aspects | Details |
|---|---|
| Study Period | 2020-2034 |
| Base Year | 2025 |
| Estimated Year | 2026 |
| Forecast Period | 2026-2034 |
| Historical Period | 2020-2025 |
| Growth Rate | CAGR of 6.96% from 2020-2034 |
| Segmentation |
|
Table of Contents
- 1. Introduction
- 1.1. Research Scope
- 1.2. Market Segmentation
- 1.3. Research Objective
- 1.4. Definitions and Assumptions
- 2. Executive Summary
- 2.1. Market Snapshot
- 3. Market Dynamics
- 3.1. Market Drivers
- 3.2. Market Restrains
- 3.3. Market Trends
- 3.4. Market Opportunities
- 4. Market Factor Analysis
- 4.1. Porters Five Forces
- 4.1.1. Bargaining Power of Suppliers
- 4.1.2. Bargaining Power of Buyers
- 4.1.3. Threat of New Entrants
- 4.1.4. Threat of Substitutes
- 4.1.5. Competitive Rivalry
- 4.2. PESTEL analysis
- 4.3. BCG Analysis
- 4.3.1. Stars (High Growth, High Market Share)
- 4.3.2. Cash Cows (Low Growth, High Market Share)
- 4.3.3. Question Mark (High Growth, Low Market Share)
- 4.3.4. Dogs (Low Growth, Low Market Share)
- 4.4. Ansoff Matrix Analysis
- 4.5. Supply Chain Analysis
- 4.6. Regulatory Landscape
- 4.7. Current Market Potential and Opportunity Assessment (TAM–SAM–SOM Framework)
- 4.8. MSR Analyst Note
- 4.1. Porters Five Forces
- 5. Market Analysis, Insights and Forecast 2021-2033
- 5.1. Market Analysis, Insights and Forecast - by System
- 5.1.1. Vendor Neutral Archive
- 5.1.2. Picture Archiving and Communications System (PACS)
- 5.1.3. Other Systems
- 5.2. Market Analysis, Insights and Forecast - by End-User
- 5.2.1. Hospitals
- 5.2.2. Diagnostic Centers
- 5.2.3. Ambulatory Surgery Centers
- 5.3. Market Analysis, Insights and Forecast - by Region
- 5.3.1. North America
- 5.3.2. Europe
- 5.3.3. Asia Pacific
- 5.3.4. Middle East and Africa
- 5.3.5. South America
- 5.1. Market Analysis, Insights and Forecast - by System
- 6. Global Medical Image Exchange Systems Industry Analysis, Insights and Forecast, 2021-2033
- 6.1. Market Analysis, Insights and Forecast - by System
- 6.1.1. Vendor Neutral Archive
- 6.1.2. Picture Archiving and Communications System (PACS)
- 6.1.3. Other Systems
- 6.2. Market Analysis, Insights and Forecast - by End-User
- 6.2.1. Hospitals
- 6.2.2. Diagnostic Centers
- 6.2.3. Ambulatory Surgery Centers
- 6.1. Market Analysis, Insights and Forecast - by System
- 7. North America Medical Image Exchange Systems Industry Analysis, Insights and Forecast, 2020-2032
- 7.1. Market Analysis, Insights and Forecast - by System
- 7.1.1. Vendor Neutral Archive
- 7.1.2. Picture Archiving and Communications System (PACS)
- 7.1.3. Other Systems
- 7.2. Market Analysis, Insights and Forecast - by End-User
- 7.2.1. Hospitals
- 7.2.2. Diagnostic Centers
- 7.2.3. Ambulatory Surgery Centers
- 7.1. Market Analysis, Insights and Forecast - by System
- 8. Europe Medical Image Exchange Systems Industry Analysis, Insights and Forecast, 2020-2032
- 8.1. Market Analysis, Insights and Forecast - by System
- 8.1.1. Vendor Neutral Archive
- 8.1.2. Picture Archiving and Communications System (PACS)
- 8.1.3. Other Systems
- 8.2. Market Analysis, Insights and Forecast - by End-User
- 8.2.1. Hospitals
- 8.2.2. Diagnostic Centers
- 8.2.3. Ambulatory Surgery Centers
- 8.1. Market Analysis, Insights and Forecast - by System
- 9. Asia Pacific Medical Image Exchange Systems Industry Analysis, Insights and Forecast, 2020-2032
- 9.1. Market Analysis, Insights and Forecast - by System
- 9.1.1. Vendor Neutral Archive
- 9.1.2. Picture Archiving and Communications System (PACS)
- 9.1.3. Other Systems
- 9.2. Market Analysis, Insights and Forecast - by End-User
- 9.2.1. Hospitals
- 9.2.2. Diagnostic Centers
- 9.2.3. Ambulatory Surgery Centers
- 9.1. Market Analysis, Insights and Forecast - by System
- 10. Middle East and Africa Medical Image Exchange Systems Industry Analysis, Insights and Forecast, 2020-2032
- 10.1. Market Analysis, Insights and Forecast - by System
- 10.1.1. Vendor Neutral Archive
- 10.1.2. Picture Archiving and Communications System (PACS)
- 10.1.3. Other Systems
- 10.2. Market Analysis, Insights and Forecast - by End-User
- 10.2.1. Hospitals
- 10.2.2. Diagnostic Centers
- 10.2.3. Ambulatory Surgery Centers
- 10.1. Market Analysis, Insights and Forecast - by System
- 11. South America Medical Image Exchange Systems Industry Analysis, Insights and Forecast, 2020-2032
- 11.1. Market Analysis, Insights and Forecast - by System
- 11.1.1. Vendor Neutral Archive
- 11.1.2. Picture Archiving and Communications System (PACS)
- 11.1.3. Other Systems
- 11.2. Market Analysis, Insights and Forecast - by End-User
- 11.2.1. Hospitals
- 11.2.2. Diagnostic Centers
- 11.2.3. Ambulatory Surgery Centers
- 11.1. Market Analysis, Insights and Forecast - by System
- 12. Competitive Analysis
- 12.1. Company Profiles
- 12.1.1 IBM Corporation
- 12.1.1.1. Company Overview
- 12.1.1.2. Products
- 12.1.1.3. Company Financials
- 12.1.1.4. SWOT Analysis
- 12.1.2 Siemens Healthineers
- 12.1.2.1. Company Overview
- 12.1.2.2. Products
- 12.1.2.3. Company Financials
- 12.1.2.4. SWOT Analysis
- 12.1.3 GE Healthcare
- 12.1.3.1. Company Overview
- 12.1.3.2. Products
- 12.1.3.3. Company Financials
- 12.1.3.4. SWOT Analysis
- 12.1.4 Dell Technologies Inc
- 12.1.4.1. Company Overview
- 12.1.4.2. Products
- 12.1.4.3. Company Financials
- 12.1.4.4. SWOT Analysis
- 12.1.5 Lexmark International Inc
- 12.1.5.1. Company Overview
- 12.1.5.2. Products
- 12.1.5.3. Company Financials
- 12.1.5.4. SWOT Analysis
- 12.1.6 BridgeHead Software
- 12.1.6.1. Company Overview
- 12.1.6.2. Products
- 12.1.6.3. Company Financials
- 12.1.6.4. SWOT Analysis
- 12.1.7 Koninklijke Philips NV
- 12.1.7.1. Company Overview
- 12.1.7.2. Products
- 12.1.7.3. Company Financials
- 12.1.7.4. SWOT Analysis
- 12.1.8 Carestream Health Inc (Onex Corporation)
- 12.1.8.1. Company Overview
- 12.1.8.2. Products
- 12.1.8.3. Company Financials
- 12.1.8.4. SWOT Analysis
- 12.1.9 McKesson Corporation
- 12.1.9.1. Company Overview
- 12.1.9.2. Products
- 12.1.9.3. Company Financials
- 12.1.9.4. SWOT Analysis
- 12.1.10 Novarad Corporation
- 12.1.10.1. Company Overview
- 12.1.10.2. Products
- 12.1.10.3. Company Financials
- 12.1.10.4. SWOT Analysis
- 12.1.11 Agfa-Gevaert Group
- 12.1.11.1. Company Overview
- 12.1.11.2. Products
- 12.1.11.3. Company Financials
- 12.1.11.4. SWOT Analysis
- 12.1.12 Fujifilm Holdings Corporation
- 12.1.12.1. Company Overview
- 12.1.12.2. Products
- 12.1.12.3. Company Financials
- 12.1.12.4. SWOT Analysis
- 12.1.1 IBM Corporation
- 12.2. Market Entropy
- 12.2.1 Company's Key Areas Served
- 12.2.2 Recent Developments
- 12.3. Company Market Share Analysis 2025
- 12.3.1 Top 5 Companies Market Share Analysis
- 12.3.2 Top 3 Companies Market Share Analysis
- 12.4. List of Potential Customers
- 13. Research Methodology
List of Figures
- Figure 1: Global Medical Image Exchange Systems Industry Revenue Breakdown (Million, %) by Region 2025 & 2033
- Figure 2: Global Medical Image Exchange Systems Industry Volume Breakdown (K Unit, %) by Region 2025 & 2033
- Figure 3: North America Medical Image Exchange Systems Industry Revenue (Million), by System 2025 & 2033
- Figure 4: North America Medical Image Exchange Systems Industry Volume (K Unit), by System 2025 & 2033
- Figure 5: North America Medical Image Exchange Systems Industry Revenue Share (%), by System 2025 & 2033
- Figure 6: North America Medical Image Exchange Systems Industry Volume Share (%), by System 2025 & 2033
- Figure 7: North America Medical Image Exchange Systems Industry Revenue (Million), by End-User 2025 & 2033
- Figure 8: North America Medical Image Exchange Systems Industry Volume (K Unit), by End-User 2025 & 2033
- Figure 9: North America Medical Image Exchange Systems Industry Revenue Share (%), by End-User 2025 & 2033
- Figure 10: North America Medical Image Exchange Systems Industry Volume Share (%), by End-User 2025 & 2033
- Figure 11: North America Medical Image Exchange Systems Industry Revenue (Million), by Country 2025 & 2033
- Figure 12: North America Medical Image Exchange Systems Industry Volume (K Unit), by Country 2025 & 2033
- Figure 13: North America Medical Image Exchange Systems Industry Revenue Share (%), by Country 2025 & 2033
- Figure 14: North America Medical Image Exchange Systems Industry Volume Share (%), by Country 2025 & 2033
- Figure 15: Europe Medical Image Exchange Systems Industry Revenue (Million), by System 2025 & 2033
- Figure 16: Europe Medical Image Exchange Systems Industry Volume (K Unit), by System 2025 & 2033
- Figure 17: Europe Medical Image Exchange Systems Industry Revenue Share (%), by System 2025 & 2033
- Figure 18: Europe Medical Image Exchange Systems Industry Volume Share (%), by System 2025 & 2033
- Figure 19: Europe Medical Image Exchange Systems Industry Revenue (Million), by End-User 2025 & 2033
- Figure 20: Europe Medical Image Exchange Systems Industry Volume (K Unit), by End-User 2025 & 2033
- Figure 21: Europe Medical Image Exchange Systems Industry Revenue Share (%), by End-User 2025 & 2033
- Figure 22: Europe Medical Image Exchange Systems Industry Volume Share (%), by End-User 2025 & 2033
- Figure 23: Europe Medical Image Exchange Systems Industry Revenue (Million), by Country 2025 & 2033
- Figure 24: Europe Medical Image Exchange Systems Industry Volume (K Unit), by Country 2025 & 2033
- Figure 25: Europe Medical Image Exchange Systems Industry Revenue Share (%), by Country 2025 & 2033
- Figure 26: Europe Medical Image Exchange Systems Industry Volume Share (%), by Country 2025 & 2033
- Figure 27: Asia Pacific Medical Image Exchange Systems Industry Revenue (Million), by System 2025 & 2033
- Figure 28: Asia Pacific Medical Image Exchange Systems Industry Volume (K Unit), by System 2025 & 2033
- Figure 29: Asia Pacific Medical Image Exchange Systems Industry Revenue Share (%), by System 2025 & 2033
- Figure 30: Asia Pacific Medical Image Exchange Systems Industry Volume Share (%), by System 2025 & 2033
- Figure 31: Asia Pacific Medical Image Exchange Systems Industry Revenue (Million), by End-User 2025 & 2033
- Figure 32: Asia Pacific Medical Image Exchange Systems Industry Volume (K Unit), by End-User 2025 & 2033
- Figure 33: Asia Pacific Medical Image Exchange Systems Industry Revenue Share (%), by End-User 2025 & 2033
- Figure 34: Asia Pacific Medical Image Exchange Systems Industry Volume Share (%), by End-User 2025 & 2033
- Figure 35: Asia Pacific Medical Image Exchange Systems Industry Revenue (Million), by Country 2025 & 2033
- Figure 36: Asia Pacific Medical Image Exchange Systems Industry Volume (K Unit), by Country 2025 & 2033
- Figure 37: Asia Pacific Medical Image Exchange Systems Industry Revenue Share (%), by Country 2025 & 2033
- Figure 38: Asia Pacific Medical Image Exchange Systems Industry Volume Share (%), by Country 2025 & 2033
- Figure 39: Middle East and Africa Medical Image Exchange Systems Industry Revenue (Million), by System 2025 & 2033
- Figure 40: Middle East and Africa Medical Image Exchange Systems Industry Volume (K Unit), by System 2025 & 2033
- Figure 41: Middle East and Africa Medical Image Exchange Systems Industry Revenue Share (%), by System 2025 & 2033
- Figure 42: Middle East and Africa Medical Image Exchange Systems Industry Volume Share (%), by System 2025 & 2033
- Figure 43: Middle East and Africa Medical Image Exchange Systems Industry Revenue (Million), by End-User 2025 & 2033
- Figure 44: Middle East and Africa Medical Image Exchange Systems Industry Volume (K Unit), by End-User 2025 & 2033
- Figure 45: Middle East and Africa Medical Image Exchange Systems Industry Revenue Share (%), by End-User 2025 & 2033
- Figure 46: Middle East and Africa Medical Image Exchange Systems Industry Volume Share (%), by End-User 2025 & 2033
- Figure 47: Middle East and Africa Medical Image Exchange Systems Industry Revenue (Million), by Country 2025 & 2033
- Figure 48: Middle East and Africa Medical Image Exchange Systems Industry Volume (K Unit), by Country 2025 & 2033
- Figure 49: Middle East and Africa Medical Image Exchange Systems Industry Revenue Share (%), by Country 2025 & 2033
- Figure 50: Middle East and Africa Medical Image Exchange Systems Industry Volume Share (%), by Country 2025 & 2033
- Figure 51: South America Medical Image Exchange Systems Industry Revenue (Million), by System 2025 & 2033
- Figure 52: South America Medical Image Exchange Systems Industry Volume (K Unit), by System 2025 & 2033
- Figure 53: South America Medical Image Exchange Systems Industry Revenue Share (%), by System 2025 & 2033
- Figure 54: South America Medical Image Exchange Systems Industry Volume Share (%), by System 2025 & 2033
- Figure 55: South America Medical Image Exchange Systems Industry Revenue (Million), by End-User 2025 & 2033
- Figure 56: South America Medical Image Exchange Systems Industry Volume (K Unit), by End-User 2025 & 2033
- Figure 57: South America Medical Image Exchange Systems Industry Revenue Share (%), by End-User 2025 & 2033
- Figure 58: South America Medical Image Exchange Systems Industry Volume Share (%), by End-User 2025 & 2033
- Figure 59: South America Medical Image Exchange Systems Industry Revenue (Million), by Country 2025 & 2033
- Figure 60: South America Medical Image Exchange Systems Industry Volume (K Unit), by Country 2025 & 2033
- Figure 61: South America Medical Image Exchange Systems Industry Revenue Share (%), by Country 2025 & 2033
- Figure 62: South America Medical Image Exchange Systems Industry Volume Share (%), by Country 2025 & 2033
List of Tables
- Table 1: Global Medical Image Exchange Systems Industry Revenue Million Forecast, by System 2020 & 2033
- Table 2: Global Medical Image Exchange Systems Industry Volume K Unit Forecast, by System 2020 & 2033
- Table 3: Global Medical Image Exchange Systems Industry Revenue Million Forecast, by End-User 2020 & 2033
- Table 4: Global Medical Image Exchange Systems Industry Volume K Unit Forecast, by End-User 2020 & 2033
- Table 5: Global Medical Image Exchange Systems Industry Revenue Million Forecast, by Region 2020 & 2033
- Table 6: Global Medical Image Exchange Systems Industry Volume K Unit Forecast, by Region 2020 & 2033
- Table 7: Global Medical Image Exchange Systems Industry Revenue Million Forecast, by System 2020 & 2033
- Table 8: Global Medical Image Exchange Systems Industry Volume K Unit Forecast, by System 2020 & 2033
- Table 9: Global Medical Image Exchange Systems Industry Revenue Million Forecast, by End-User 2020 & 2033
- Table 10: Global Medical Image Exchange Systems Industry Volume K Unit Forecast, by End-User 2020 & 2033
- Table 11: Global Medical Image Exchange Systems Industry Revenue Million Forecast, by Country 2020 & 2033
- Table 12: Global Medical Image Exchange Systems Industry Volume K Unit Forecast, by Country 2020 & 2033
- Table 13: United States Medical Image Exchange Systems Industry Revenue (Million) Forecast, by Application 2020 & 2033
- Table 14: United States Medical Image Exchange Systems Industry Volume (K Unit) Forecast, by Application 2020 & 2033
- Table 15: Canada Medical Image Exchange Systems Industry Revenue (Million) Forecast, by Application 2020 & 2033
- Table 16: Canada Medical Image Exchange Systems Industry Volume (K Unit) Forecast, by Application 2020 & 2033
- Table 17: Mexico Medical Image Exchange Systems Industry Revenue (Million) Forecast, by Application 2020 & 2033
- Table 18: Mexico Medical Image Exchange Systems Industry Volume (K Unit) Forecast, by Application 2020 & 2033
- Table 19: Global Medical Image Exchange Systems Industry Revenue Million Forecast, by System 2020 & 2033
- Table 20: Global Medical Image Exchange Systems Industry Volume K Unit Forecast, by System 2020 & 2033
- Table 21: Global Medical Image Exchange Systems Industry Revenue Million Forecast, by End-User 2020 & 2033
- Table 22: Global Medical Image Exchange Systems Industry Volume K Unit Forecast, by End-User 2020 & 2033
- Table 23: Global Medical Image Exchange Systems Industry Revenue Million Forecast, by Country 2020 & 2033
- Table 24: Global Medical Image Exchange Systems Industry Volume K Unit Forecast, by Country 2020 & 2033
- Table 25: Germany Medical Image Exchange Systems Industry Revenue (Million) Forecast, by Application 2020 & 2033
- Table 26: Germany Medical Image Exchange Systems Industry Volume (K Unit) Forecast, by Application 2020 & 2033
- Table 27: United Kingdom Medical Image Exchange Systems Industry Revenue (Million) Forecast, by Application 2020 & 2033
- Table 28: United Kingdom Medical Image Exchange Systems Industry Volume (K Unit) Forecast, by Application 2020 & 2033
- Table 29: France Medical Image Exchange Systems Industry Revenue (Million) Forecast, by Application 2020 & 2033
- Table 30: France Medical Image Exchange Systems Industry Volume (K Unit) Forecast, by Application 2020 & 2033
- Table 31: Italy Medical Image Exchange Systems Industry Revenue (Million) Forecast, by Application 2020 & 2033
- Table 32: Italy Medical Image Exchange Systems Industry Volume (K Unit) Forecast, by Application 2020 & 2033
- Table 33: Spain Medical Image Exchange Systems Industry Revenue (Million) Forecast, by Application 2020 & 2033
- Table 34: Spain Medical Image Exchange Systems Industry Volume (K Unit) Forecast, by Application 2020 & 2033
- Table 35: Rest of Europe Medical Image Exchange Systems Industry Revenue (Million) Forecast, by Application 2020 & 2033
- Table 36: Rest of Europe Medical Image Exchange Systems Industry Volume (K Unit) Forecast, by Application 2020 & 2033
- Table 37: Global Medical Image Exchange Systems Industry Revenue Million Forecast, by System 2020 & 2033
- Table 38: Global Medical Image Exchange Systems Industry Volume K Unit Forecast, by System 2020 & 2033
- Table 39: Global Medical Image Exchange Systems Industry Revenue Million Forecast, by End-User 2020 & 2033
- Table 40: Global Medical Image Exchange Systems Industry Volume K Unit Forecast, by End-User 2020 & 2033
- Table 41: Global Medical Image Exchange Systems Industry Revenue Million Forecast, by Country 2020 & 2033
- Table 42: Global Medical Image Exchange Systems Industry Volume K Unit Forecast, by Country 2020 & 2033
- Table 43: China Medical Image Exchange Systems Industry Revenue (Million) Forecast, by Application 2020 & 2033
- Table 44: China Medical Image Exchange Systems Industry Volume (K Unit) Forecast, by Application 2020 & 2033
- Table 45: Japan Medical Image Exchange Systems Industry Revenue (Million) Forecast, by Application 2020 & 2033
- Table 46: Japan Medical Image Exchange Systems Industry Volume (K Unit) Forecast, by Application 2020 & 2033
- Table 47: India Medical Image Exchange Systems Industry Revenue (Million) Forecast, by Application 2020 & 2033
- Table 48: India Medical Image Exchange Systems Industry Volume (K Unit) Forecast, by Application 2020 & 2033
- Table 49: Australia Medical Image Exchange Systems Industry Revenue (Million) Forecast, by Application 2020 & 2033
- Table 50: Australia Medical Image Exchange Systems Industry Volume (K Unit) Forecast, by Application 2020 & 2033
- Table 51: South Korea Medical Image Exchange Systems Industry Revenue (Million) Forecast, by Application 2020 & 2033
- Table 52: South Korea Medical Image Exchange Systems Industry Volume (K Unit) Forecast, by Application 2020 & 2033
- Table 53: Rest of Asia Pacific Medical Image Exchange Systems Industry Revenue (Million) Forecast, by Application 2020 & 2033
- Table 54: Rest of Asia Pacific Medical Image Exchange Systems Industry Volume (K Unit) Forecast, by Application 2020 & 2033
- Table 55: Global Medical Image Exchange Systems Industry Revenue Million Forecast, by System 2020 & 2033
- Table 56: Global Medical Image Exchange Systems Industry Volume K Unit Forecast, by System 2020 & 2033
- Table 57: Global Medical Image Exchange Systems Industry Revenue Million Forecast, by End-User 2020 & 2033
- Table 58: Global Medical Image Exchange Systems Industry Volume K Unit Forecast, by End-User 2020 & 2033
- Table 59: Global Medical Image Exchange Systems Industry Revenue Million Forecast, by Country 2020 & 2033
- Table 60: Global Medical Image Exchange Systems Industry Volume K Unit Forecast, by Country 2020 & 2033
- Table 61: GCC Medical Image Exchange Systems Industry Revenue (Million) Forecast, by Application 2020 & 2033
- Table 62: GCC Medical Image Exchange Systems Industry Volume (K Unit) Forecast, by Application 2020 & 2033
- Table 63: South Africa Medical Image Exchange Systems Industry Revenue (Million) Forecast, by Application 2020 & 2033
- Table 64: South Africa Medical Image Exchange Systems Industry Volume (K Unit) Forecast, by Application 2020 & 2033
- Table 65: Rest of Middle East and Africa Medical Image Exchange Systems Industry Revenue (Million) Forecast, by Application 2020 & 2033
- Table 66: Rest of Middle East and Africa Medical Image Exchange Systems Industry Volume (K Unit) Forecast, by Application 2020 & 2033
- Table 67: Global Medical Image Exchange Systems Industry Revenue Million Forecast, by System 2020 & 2033
- Table 68: Global Medical Image Exchange Systems Industry Volume K Unit Forecast, by System 2020 & 2033
- Table 69: Global Medical Image Exchange Systems Industry Revenue Million Forecast, by End-User 2020 & 2033
- Table 70: Global Medical Image Exchange Systems Industry Volume K Unit Forecast, by End-User 2020 & 2033
- Table 71: Global Medical Image Exchange Systems Industry Revenue Million Forecast, by Country 2020 & 2033
- Table 72: Global Medical Image Exchange Systems Industry Volume K Unit Forecast, by Country 2020 & 2033
- Table 73: Brazil Medical Image Exchange Systems Industry Revenue (Million) Forecast, by Application 2020 & 2033
- Table 74: Brazil Medical Image Exchange Systems Industry Volume (K Unit) Forecast, by Application 2020 & 2033
- Table 75: Argentina Medical Image Exchange Systems Industry Revenue (Million) Forecast, by Application 2020 & 2033
- Table 76: Argentina Medical Image Exchange Systems Industry Volume (K Unit) Forecast, by Application 2020 & 2033
- Table 77: Rest of South America Medical Image Exchange Systems Industry Revenue (Million) Forecast, by Application 2020 & 2033
- Table 78: Rest of South America Medical Image Exchange Systems Industry Volume (K Unit) Forecast, by Application 2020 & 2033
Frequently Asked Questions
1. What is the projected Compound Annual Growth Rate (CAGR) of the Medical Image Exchange Systems Industry?
The projected CAGR is approximately 6.96%.
2. Which companies are prominent players in the Medical Image Exchange Systems Industry?
Key companies in the market include IBM Corporation, Siemens Healthineers, GE Healthcare, Dell Technologies Inc , Lexmark International Inc, BridgeHead Software, Koninklijke Philips NV, Carestream Health Inc (Onex Corporation), McKesson Corporation, Novarad Corporation, Agfa-Gevaert Group, Fujifilm Holdings Corporation.
3. What are the main segments of the Medical Image Exchange Systems Industry?
The market segments include System, End-User.
4. Can you provide details about the market size?
The market size is estimated to be USD 4.59 Million as of 2022.
5. What are some drivers contributing to market growth?
Technological Innovations in the Diagnostic Imaging and Image Management; Rising Prevalence of Chronic Diseases; Emergence of Big Data in Healthcare.
6. What are the notable trends driving market growth?
Picture Archiving and Communications Systems (PACS) is Expected to Record Notable CAGR in the Market During the Forecast Period.
7. Are there any restraints impacting market growth?
Cost Associated With Implementation of Medical Imaging Management Solutions; Decrease In the Supply of SPECT and PET Systems due to the Shortage of Radioisotopes.
8. Can you provide examples of recent developments in the market?
March 2022: Intelerad Medical Systems launched its new Enterprise Imaging and Informatics Suite at the 2022 HIMSS Global Health Conference & Exhibition. Intelerad's suite empowers hospitals and health systems to break down siloed data and create a seamless, vendor-neutral information hub, integrating vital patient data across the entire healthcare ecosystem.
9. What pricing options are available for accessing the report?
Pricing options include single-user, multi-user, and enterprise licenses priced at USD 4750, USD 5250, and USD 8750 respectively.
10. Is the market size provided in terms of value or volume?
The market size is provided in terms of value, measured in Million and volume, measured in K Unit.
11. Are there any specific market keywords associated with the report?
Yes, the market keyword associated with the report is "Medical Image Exchange Systems Industry," which aids in identifying and referencing the specific market segment covered.
12. How do I determine which pricing option suits my needs best?
The pricing options vary based on user requirements and access needs. Individual users may opt for single-user licenses, while businesses requiring broader access may choose multi-user or enterprise licenses for cost-effective access to the report.
13. Are there any additional resources or data provided in the Medical Image Exchange Systems Industry report?
While the report offers comprehensive insights, it's advisable to review the specific contents or supplementary materials provided to ascertain if additional resources or data are available.
14. How can I stay updated on further developments or reports in the Medical Image Exchange Systems Industry?
To stay informed about further developments, trends, and reports in the Medical Image Exchange Systems Industry, consider subscribing to industry newsletters, following relevant companies and organizations, or regularly checking reputable industry news sources and publications.
Methodology
Step 1 - Identification of Relevant Samples Size from Population Database


Step 2 - Approaches for Defining Global Market Size (Value, Volume* & Price*)

Note*: In applicable scenarios
Step 3 - Data Sources
Primary Research
- Web Analytics
- Survey Reports
- Research Institute
- Latest Research Reports
- Opinion Leaders
Secondary Research
- Annual Reports
- White Paper
- Latest Press Release
- Industry Association
- Paid Database
- Investor Presentations

Step 4 - Data Triangulation
Involves using different sources of information in order to increase the validity of a study
These sources are likely to be stakeholders in a program - participants, other researchers, program staff, other community members, and so on.
Then we put all data in single framework & apply various statistical tools to find out the dynamic on the market.
During the analysis stage, feedback from the stakeholder groups would be compared to determine areas of agreement as well as areas of divergence