

Key Insights
The global Anemia Treatment Market is poised for significant expansion, projected to reach a market size of $12.31 billion by 2025, with an anticipated Compound Annual Growth Rate (CAGR) of 7.12% through the forecast period. This robust growth is primarily fueled by an increasing prevalence of anemia across various patient populations, including those with chronic kidney disease (CKD), iron deficiency, and sickle cell anemia. Advancements in therapeutic drug development, particularly in erythropoiesis-stimulating agents (ESAs) and novel iron therapies, are crucial drivers, offering improved efficacy and patient compliance. Furthermore, a rising awareness among healthcare professionals and patients regarding the early diagnosis and effective management of anemia contributes to market penetration. The expanding healthcare infrastructure, especially in emerging economies, coupled with increasing healthcare expenditure, is also a significant factor bolstering market growth.
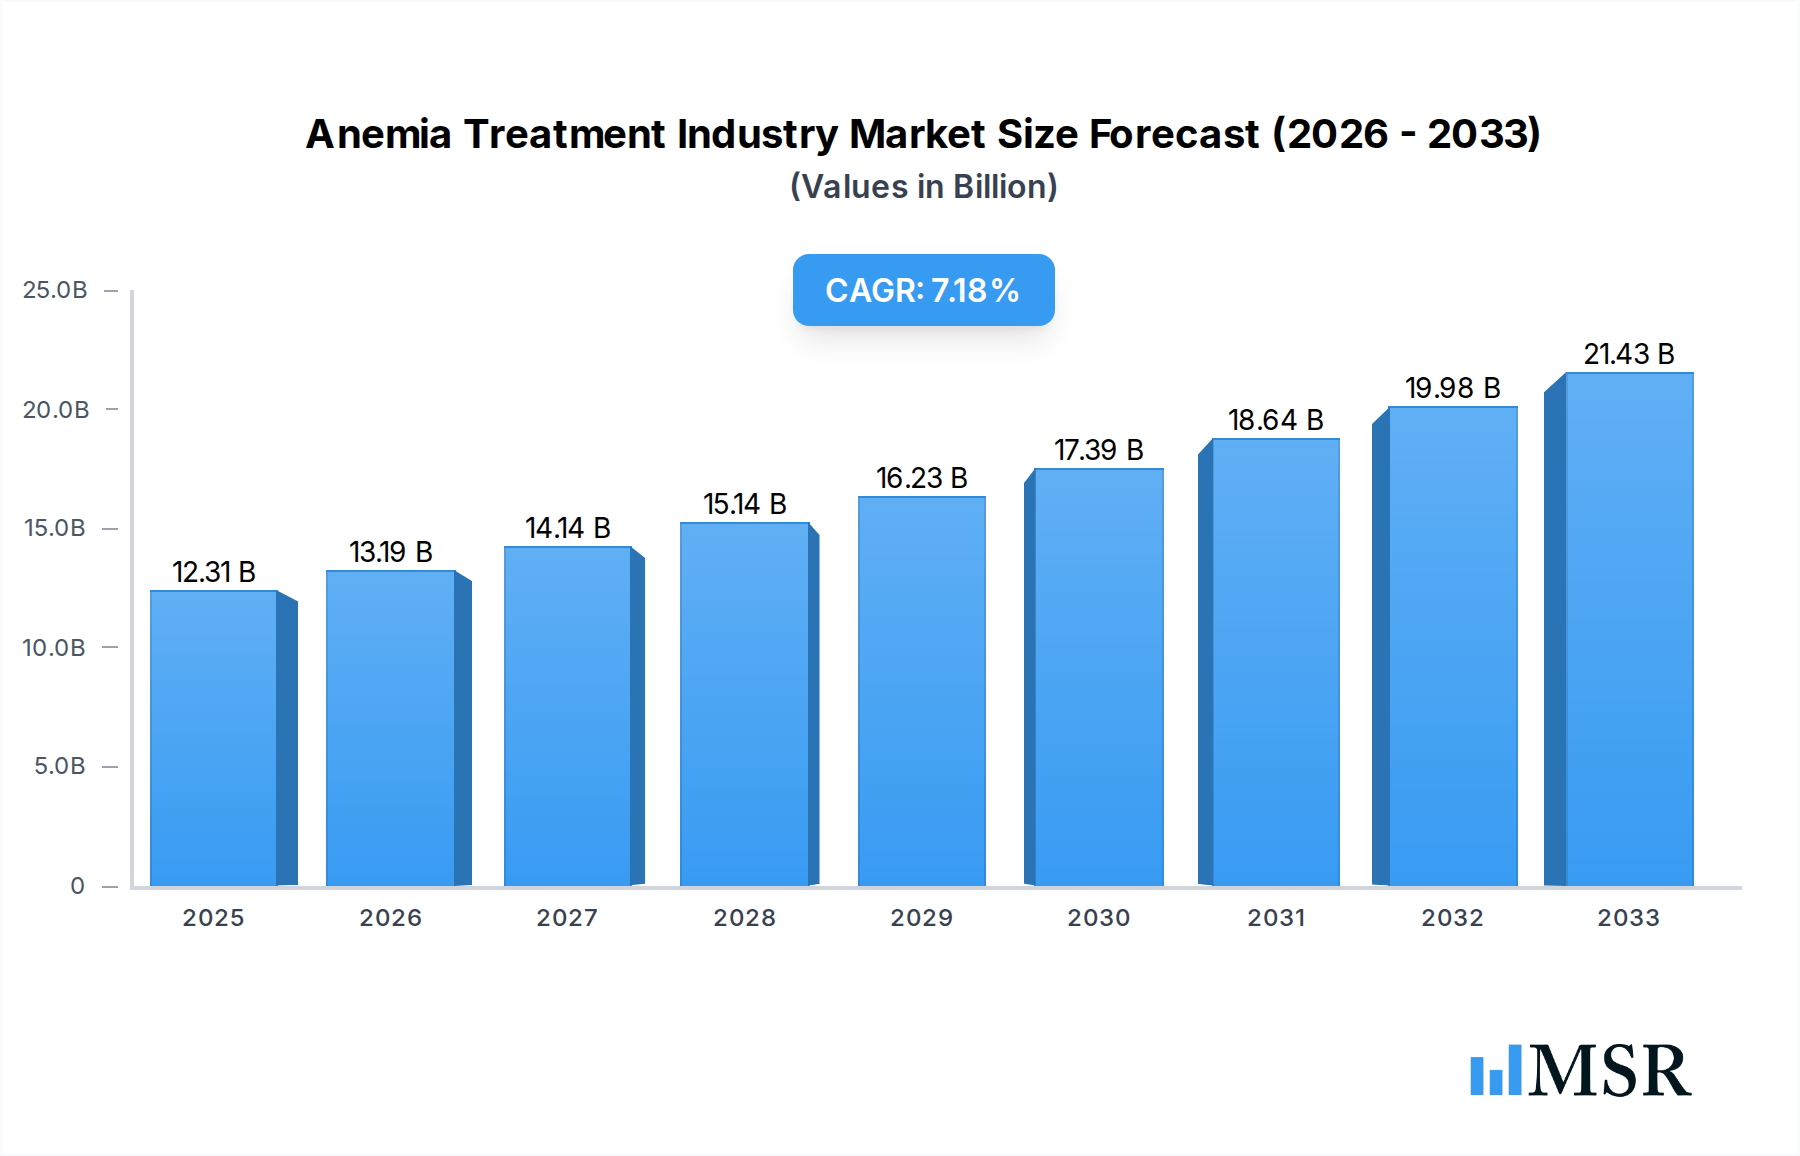
Anemia Treatment Industry Market Size (In Billion)
The Anemia Treatment market is characterized by a dynamic landscape shaped by evolving treatment paradigms and a robust pipeline of innovative therapies. Key segments within the market include treatments for Iron Deficiency Anemia, CKD-related Anemia, Sickle Cell Anemia, and Aplastic Anemia. While the increasing incidence of chronic diseases like CKD is a major growth driver, potential restraints could stem from the high cost of newer therapies and the stringent regulatory approval processes for novel drugs. The market is also witnessing strategic collaborations and mergers & acquisitions among leading pharmaceutical companies such as Sanofi, Takeda, Pfizer, and AbbVie, aiming to expand their product portfolios and geographical reach. North America currently dominates the market due to advanced healthcare systems and high diagnosis rates, but the Asia Pacific region is expected to witness substantial growth driven by a large patient pool and improving access to healthcare.

Anemia Treatment Industry Company Market Share
Dive deep into the burgeoning anemia treatment market with this meticulously researched industry report. Spanning 2019 to 2033, with a robust base year of 2025, this report offers unparalleled insights into the global anemia therapeutics market, driven by an escalating prevalence of iron deficiency anemia, CKD anemia, and sickle cell anemia. Forecasts anticipate a significant market expansion, with the anemia drug market size projected to reach hundreds of billions by 2033, fueled by advancements in anemia diagnosis and treatment strategies. This analysis is essential for pharmaceutical companies, biotech firms, healthcare providers, and investors seeking to capitalize on the anemia management sector.
Anemia Treatment Industry Market Concentration & Dynamics
The anemia treatment industry exhibits a moderate concentration, characterized by a blend of established pharmaceutical giants and emerging biotech innovators. The innovation ecosystem is vibrant, with significant R&D investment in novel anemia therapies, particularly for complex conditions like sickle cell anemia and aplastic anemia. Regulatory frameworks governing anemia drug approval are becoming more streamlined, especially for orphan indications. While oral iron supplements remain a cornerstone for iron deficiency anemia, the development of more effective injectable iron therapies and ESA (Erythropoiesis-Stimulating Agent) alternatives signifies evolving end-user trends. The presence of substitute products and generics necessitates continuous innovation to maintain market share. M&A activities are a critical aspect of market dynamics, with tens of billion in deal values, as larger players seek to acquire promising technologies and expand their anemia drug portfolios. For instance, Pfizer Inc (Global Blood Therapeutics Inc) acquisition highlights this trend. The market share distribution sees key players vying for dominance, with a notable push towards specialized anemia treatments.
Anemia Treatment Industry Industry Insights & Trends
The anemia treatment market is poised for substantial growth, with the global market size projected to exceed hundreds of billions by 2033. This expansion is underpinned by a compelling Compound Annual Growth Rate (CAGR) of XX% during the forecast period of 2025–2033. Key growth drivers include the increasing incidence of chronic diseases leading to secondary anemias, such as CKD (Chronic Kidney Disease) Anemia, and a growing awareness and diagnosis rate of iron deficiency anemia. Technological disruptions in drug delivery systems, including advanced intravenous iron formulations and novel gene therapies for genetic anemias, are reshaping treatment paradigms. Evolving consumer behaviors are also influencing the market, with a greater demand for convenient and effective anemia management solutions. The global anemia therapeutics market is witnessing a surge in R&D for sickle cell anemia treatments, driven by significant unmet needs and recent therapeutic breakthroughs. The anemia diagnosis market is also expanding, with improved diagnostic tools leading to earlier and more accurate identification of anemia types, further boosting demand for effective treatments. The cost of anemia treatment is a significant factor, but innovations are driving both efficacy and cost-effectiveness in the long run. The anemia management sector is a dynamic space, with constant evolution in therapeutic approaches. The historical market from 2019–2024 has laid the groundwork for this accelerated growth.
Key Markets & Segments Leading Anemia Treatment Industry
The anemia treatment market is dominated by several key segments and geographical regions.
- Dominant Disease Segment: Iron Deficiency Anemia
- Drivers: High global prevalence, accessibility of iron supplements, and increasing diagnosis rates.
- Analysis: Iron deficiency anemia remains the most prevalent form of anemia, driving significant demand for oral and intravenous iron therapies. The market for iron deficiency anemia treatment is vast, fueled by nutritional deficiencies and blood loss.
- Growing Segment: CKD (Chronic Kidney Disease) Anemia
- Drivers: Rising rates of chronic kidney disease globally, necessitating interventions with erythropoiesis-stimulating agents (ESAs) and novel therapies.
- Analysis: The increasing prevalence of CKD (Chronic Kidney Disease) Anemia is a significant growth catalyst. Akebia Therapeutics Inc is a key player in this space.
- Emerging Segment: Sickle Cell Anemia
- Drivers: Breakthrough gene therapies and targeted drug development, coupled with increased research funding and patient advocacy.
- Analysis: Sickle cell anemia treatment is a rapidly evolving area with the advent of transformative therapies. Pfizer Inc (Global Blood Therapeutics Inc)’s contributions highlight this potential. Bluebird Bio Inc is also a prominent innovator.
- Significant Segment: Aplastic Anemia
- Drivers: Advancements in bone marrow transplantation and immunosuppressive therapies.
- Analysis: While rarer, aplastic anemia treatment demands specialized interventions, driving a niche but critical market segment.
- Geographical Dominance: North America and Europe
- Drivers: Robust healthcare infrastructure, high disposable income, early adoption of advanced medical technologies, and strong R&D investment.
- Analysis: These regions lead in the adoption of novel anemia treatments due to advanced healthcare systems and significant pharmaceutical presence. The anemia drug market in these regions is characterized by high R&D spending and a strong regulatory environment for drug approvals.
- Emerging Markets: Asia-Pacific
- Drivers: Increasing prevalence of anemia due to malnutrition and chronic diseases, improving healthcare access, and growing R&D investments.
- Analysis: The Asia-Pacific anemia treatment market is poised for substantial growth driven by its large population and the increasing focus on public health initiatives.
Anemia Treatment Industry Product Developments
The anemia treatment landscape is continuously shaped by pioneering product developments. Innovations focus on enhancing efficacy, safety, and patient convenience. Advanced intravenous iron preparations, such as Ferinject from CSL Vifor and Fresenius Kabi, have revolutionized iron deficiency anemia management by enabling rapid and effective iron delivery. Furthermore, the development of novel biologics for rare anemias, exemplified by Sanofi's Enjaymo for hemolytic anemia, signifies a move towards targeted and personalized anemia therapeutics. Pieris Pharmaceuticals Inc is actively involved in developing novel therapeutic approaches for various anemias. These advancements are crucial for expanding the anemia treatment options and addressing the unmet needs across different anemia types.
Challenges in the Anemia Treatment Industry Market
The anemia treatment market faces several hurdles. Regulatory hurdles can slow down the approval process for new anemia drugs, particularly for novel mechanisms of action. Supply chain issues for essential raw materials and finished products can impact market accessibility. Competitive pressures from generic drugs and alternative therapies require continuous innovation and cost-effective solutions. The high cost of some advanced anemia treatments can also limit patient access.
Forces Driving Anemia Treatment Industry Growth
Multiple forces are propelling the growth of the anemia treatment market.
- Technological Advancements: Breakthroughs in drug discovery, gene therapy, and drug delivery systems are creating more effective and targeted anemia treatments.
- Increasing Disease Prevalence: The rising incidence of chronic diseases like kidney disease and cancer, which often lead to anemia, is a major driver.
- Growing Awareness and Diagnosis: Improved diagnostic tools and increased health awareness are leading to earlier and more accurate identification of anemia.
- Favorable Regulatory Environments: Streamlined approval pathways for certain anemia therapies can accelerate market entry.
Challenges in the Anemia Treatment Industry Market
Long-term growth catalysts for the anemia treatment industry are deeply rooted in ongoing innovation and market expansion. Continued research into the underlying mechanisms of various anemias will unlock new therapeutic targets. Strategic partnerships between pharmaceutical giants like Takeda Pharmaceutical Company Limited and smaller biotech firms can accelerate the development and commercialization of promising anemia therapies. Expanding access to existing and novel treatments in emerging markets, such as the Asia-Pacific anemia treatment market, represents a significant opportunity for sustained growth. The focus on addressing rare anemias with specialized orphan drugs also presents a long-term growth avenue.
Emerging Opportunities in Anemia Treatment Industry
The anemia treatment industry is rife with emerging opportunities.
- Personalized Medicine: Tailoring treatments based on individual patient genetics and anemia type.
- Digital Health Solutions: Leveraging AI and data analytics for improved diagnosis, patient monitoring, and adherence to treatment.
- Combination Therapies: Developing synergistic treatments that combine different therapeutic modalities for enhanced efficacy.
- Focus on Preventive Anemia Strategies: Shifting towards early intervention and prevention of anemia in at-risk populations.
Leading Players in the Anemia Treatment Industry Sector
- Covis Pharma GmbH (AMAG Pharmaceuticals Inc)
- Sanofi
- Pieris Pharmaceuticals Inc
- Akebia Therapeutics Inc
- Takeda Pharmaceutical Company Limited
- Pharmacosmos A/S
- GSK plc
- Bluebird Bio Inc
- AbbVie Inc (Allergan Plc)
- Pfizer Inc (Global Blood Therapeutics Inc)
Key Milestones in Anemia Treatment Industry Industry
- November 2022: Sanofi received approval from the European Commission (EC) for Enjaymo (sutimlimab) for the treatment of hemolytic anemia in adult patients with cold agglutinin disease (CAD), a rare, serious, and chronic autoimmune hemolytic anemia, where the body's immune system mistakenly attacks healthy red blood cells and causes their rupture, known as hemolysis. This milestone significantly expands treatment options for a rare autoimmune anemia.
- November 2022: CSL Vifor and Fresenius Kabi received approval from China's National NMPA for its Ferinject (ferric carboxymaltose), a preparation for intravenous iron therapy for the treatment of iron deficiency in adult patients for whom oral iron preparations are ineffective, oral iron preparations cannot be used or for whom there is a clinical need to deliver iron rapidly. This approval enhances access to essential intravenous iron therapy in a major global market.
Strategic Outlook for Anemia Treatment Industry Market
The anemia treatment market is on an upward trajectory, driven by relentless innovation and a growing understanding of anemia's multifaceted nature. Strategic investments in R&D for novel therapies, particularly for sickle cell anemia and CKD anemia, will be crucial. Partnerships and collaborations will accelerate the translation of scientific discoveries into market-ready solutions. Expanding geographic reach into underserved markets and leveraging digital health technologies for improved patient outcomes will be key growth accelerators. The market is poised for significant expansion, offering substantial opportunities for stakeholders committed to addressing the global burden of anemia.
Anemia Treatment Industry Segmentation
-
1. Type of Disease
- 1.1. Iron Deficiency Anemia
- 1.2. CKD (Chronic Kidney Disease) Anemia
- 1.3. Sickle Cell Anemia
- 1.4. Aplastic Anemia
- 1.5. Other Diseases
Anemia Treatment Industry Segmentation By Geography
-
1. North America
- 1.1. United States
- 1.2. Canada
- 1.3. Mexico
-
2. Europe
- 2.1. Germany
- 2.2. United Kingdom
- 2.3. France
- 2.4. Italy
- 2.5. Spain
- 2.6. Rest of Europe
-
3. Asia Pacific
- 3.1. China
- 3.2. Japan
- 3.3. India
- 3.4. Australia
- 3.5. South Korea
- 3.6. Rest of Asia Pacific
-
4. Middle East and Africa
- 4.1. GCC
- 4.2. South Africa
- 4.3. Rest of Middle East and Africa
-
5. South America
- 5.1. Brazil
- 5.2. Argentina
- 5.3. Rest of South America

Anemia Treatment Industry Regional Market Share
Geographic Coverage of Anemia Treatment Industry
Anemia Treatment Industry REPORT HIGHLIGHTS
| Aspects | Details |
|---|---|
| Study Period | 2020-2034 |
| Base Year | 2025 |
| Estimated Year | 2026 |
| Forecast Period | 2026-2034 |
| Historical Period | 2020-2025 |
| Growth Rate | CAGR of 7.12% from 2020-2034 |
| Segmentation |
|
Table of Contents
- 1. Introduction
- 1.1. Research Scope
- 1.2. Market Segmentation
- 1.3. Research Objective
- 1.4. Definitions and Assumptions
- 2. Executive Summary
- 2.1. Market Snapshot
- 3. Market Dynamics
- 3.1. Market Drivers
- 3.2. Market Restrains
- 3.3. Market Trends
- 3.4. Market Opportunities
- 4. Market Factor Analysis
- 4.1. Porters Five Forces
- 4.1.1. Bargaining Power of Suppliers
- 4.1.2. Bargaining Power of Buyers
- 4.1.3. Threat of New Entrants
- 4.1.4. Threat of Substitutes
- 4.1.5. Competitive Rivalry
- 4.2. PESTEL analysis
- 4.3. BCG Analysis
- 4.3.1. Stars (High Growth, High Market Share)
- 4.3.2. Cash Cows (Low Growth, High Market Share)
- 4.3.3. Question Mark (High Growth, Low Market Share)
- 4.3.4. Dogs (Low Growth, Low Market Share)
- 4.4. Ansoff Matrix Analysis
- 4.5. Supply Chain Analysis
- 4.6. Regulatory Landscape
- 4.7. Current Market Potential and Opportunity Assessment (TAM–SAM–SOM Framework)
- 4.8. MSR Analyst Note
- 4.1. Porters Five Forces
- 5. Market Analysis, Insights and Forecast 2021-2033
- 5.1. Market Analysis, Insights and Forecast - by Type of Disease
- 5.1.1. Iron Deficiency Anemia
- 5.1.2. CKD (Chronic Kidney Disease) Anemia
- 5.1.3. Sickle Cell Anemia
- 5.1.4. Aplastic Anemia
- 5.1.5. Other Diseases
- 5.2. Market Analysis, Insights and Forecast - by Region
- 5.2.1. North America
- 5.2.2. Europe
- 5.2.3. Asia Pacific
- 5.2.4. Middle East and Africa
- 5.2.5. South America
- 5.1. Market Analysis, Insights and Forecast - by Type of Disease
- 6. Global Anemia Treatment Industry Analysis, Insights and Forecast, 2021-2033
- 6.1. Market Analysis, Insights and Forecast - by Type of Disease
- 6.1.1. Iron Deficiency Anemia
- 6.1.2. CKD (Chronic Kidney Disease) Anemia
- 6.1.3. Sickle Cell Anemia
- 6.1.4. Aplastic Anemia
- 6.1.5. Other Diseases
- 6.1. Market Analysis, Insights and Forecast - by Type of Disease
- 7. North America Anemia Treatment Industry Analysis, Insights and Forecast, 2020-2032
- 7.1. Market Analysis, Insights and Forecast - by Type of Disease
- 7.1.1. Iron Deficiency Anemia
- 7.1.2. CKD (Chronic Kidney Disease) Anemia
- 7.1.3. Sickle Cell Anemia
- 7.1.4. Aplastic Anemia
- 7.1.5. Other Diseases
- 7.1. Market Analysis, Insights and Forecast - by Type of Disease
- 8. Europe Anemia Treatment Industry Analysis, Insights and Forecast, 2020-2032
- 8.1. Market Analysis, Insights and Forecast - by Type of Disease
- 8.1.1. Iron Deficiency Anemia
- 8.1.2. CKD (Chronic Kidney Disease) Anemia
- 8.1.3. Sickle Cell Anemia
- 8.1.4. Aplastic Anemia
- 8.1.5. Other Diseases
- 8.1. Market Analysis, Insights and Forecast - by Type of Disease
- 9. Asia Pacific Anemia Treatment Industry Analysis, Insights and Forecast, 2020-2032
- 9.1. Market Analysis, Insights and Forecast - by Type of Disease
- 9.1.1. Iron Deficiency Anemia
- 9.1.2. CKD (Chronic Kidney Disease) Anemia
- 9.1.3. Sickle Cell Anemia
- 9.1.4. Aplastic Anemia
- 9.1.5. Other Diseases
- 9.1. Market Analysis, Insights and Forecast - by Type of Disease
- 10. Middle East and Africa Anemia Treatment Industry Analysis, Insights and Forecast, 2020-2032
- 10.1. Market Analysis, Insights and Forecast - by Type of Disease
- 10.1.1. Iron Deficiency Anemia
- 10.1.2. CKD (Chronic Kidney Disease) Anemia
- 10.1.3. Sickle Cell Anemia
- 10.1.4. Aplastic Anemia
- 10.1.5. Other Diseases
- 10.1. Market Analysis, Insights and Forecast - by Type of Disease
- 11. South America Anemia Treatment Industry Analysis, Insights and Forecast, 2020-2032
- 11.1. Market Analysis, Insights and Forecast - by Type of Disease
- 11.1.1. Iron Deficiency Anemia
- 11.1.2. CKD (Chronic Kidney Disease) Anemia
- 11.1.3. Sickle Cell Anemia
- 11.1.4. Aplastic Anemia
- 11.1.5. Other Diseases
- 11.1. Market Analysis, Insights and Forecast - by Type of Disease
- 12. Competitive Analysis
- 12.1. Company Profiles
- 12.1.1 Covis Pharma GmbH (AMAG Pharmaceuticals Inc )
- 12.1.1.1. Company Overview
- 12.1.1.2. Products
- 12.1.1.3. Company Financials
- 12.1.1.4. SWOT Analysis
- 12.1.2 Sanofi
- 12.1.2.1. Company Overview
- 12.1.2.2. Products
- 12.1.2.3. Company Financials
- 12.1.2.4. SWOT Analysis
- 12.1.3 Pieris Pharmaceuticals Inc
- 12.1.3.1. Company Overview
- 12.1.3.2. Products
- 12.1.3.3. Company Financials
- 12.1.3.4. SWOT Analysis
- 12.1.4 Akebia Therapeutics Inc
- 12.1.4.1. Company Overview
- 12.1.4.2. Products
- 12.1.4.3. Company Financials
- 12.1.4.4. SWOT Analysis
- 12.1.5 Takeda Pharmaceutical Company Limited
- 12.1.5.1. Company Overview
- 12.1.5.2. Products
- 12.1.5.3. Company Financials
- 12.1.5.4. SWOT Analysis
- 12.1.6 Pharmacosmos A/S
- 12.1.6.1. Company Overview
- 12.1.6.2. Products
- 12.1.6.3. Company Financials
- 12.1.6.4. SWOT Analysis
- 12.1.7 GSK plc
- 12.1.7.1. Company Overview
- 12.1.7.2. Products
- 12.1.7.3. Company Financials
- 12.1.7.4. SWOT Analysis
- 12.1.8 Bluebird Bio Inc
- 12.1.8.1. Company Overview
- 12.1.8.2. Products
- 12.1.8.3. Company Financials
- 12.1.8.4. SWOT Analysis
- 12.1.9 AbbVie Inc (Allergan Plc)
- 12.1.9.1. Company Overview
- 12.1.9.2. Products
- 12.1.9.3. Company Financials
- 12.1.9.4. SWOT Analysis
- 12.1.10 Pfizer Inc (Global Blood Therapeutics Inc )
- 12.1.10.1. Company Overview
- 12.1.10.2. Products
- 12.1.10.3. Company Financials
- 12.1.10.4. SWOT Analysis
- 12.1.1 Covis Pharma GmbH (AMAG Pharmaceuticals Inc )
- 12.2. Market Entropy
- 12.2.1 Company's Key Areas Served
- 12.2.2 Recent Developments
- 12.3. Company Market Share Analysis 2025
- 12.3.1 Top 5 Companies Market Share Analysis
- 12.3.2 Top 3 Companies Market Share Analysis
- 12.4. List of Potential Customers
- 13. Research Methodology
List of Figures
- Figure 1: Global Anemia Treatment Industry Revenue Breakdown (billion, %) by Region 2025 & 2033
- Figure 2: Global Anemia Treatment Industry Volume Breakdown (K Unit, %) by Region 2025 & 2033
- Figure 3: North America Anemia Treatment Industry Revenue (billion), by Type of Disease 2025 & 2033
- Figure 4: North America Anemia Treatment Industry Volume (K Unit), by Type of Disease 2025 & 2033
- Figure 5: North America Anemia Treatment Industry Revenue Share (%), by Type of Disease 2025 & 2033
- Figure 6: North America Anemia Treatment Industry Volume Share (%), by Type of Disease 2025 & 2033
- Figure 7: North America Anemia Treatment Industry Revenue (billion), by Country 2025 & 2033
- Figure 8: North America Anemia Treatment Industry Volume (K Unit), by Country 2025 & 2033
- Figure 9: North America Anemia Treatment Industry Revenue Share (%), by Country 2025 & 2033
- Figure 10: North America Anemia Treatment Industry Volume Share (%), by Country 2025 & 2033
- Figure 11: Europe Anemia Treatment Industry Revenue (billion), by Type of Disease 2025 & 2033
- Figure 12: Europe Anemia Treatment Industry Volume (K Unit), by Type of Disease 2025 & 2033
- Figure 13: Europe Anemia Treatment Industry Revenue Share (%), by Type of Disease 2025 & 2033
- Figure 14: Europe Anemia Treatment Industry Volume Share (%), by Type of Disease 2025 & 2033
- Figure 15: Europe Anemia Treatment Industry Revenue (billion), by Country 2025 & 2033
- Figure 16: Europe Anemia Treatment Industry Volume (K Unit), by Country 2025 & 2033
- Figure 17: Europe Anemia Treatment Industry Revenue Share (%), by Country 2025 & 2033
- Figure 18: Europe Anemia Treatment Industry Volume Share (%), by Country 2025 & 2033
- Figure 19: Asia Pacific Anemia Treatment Industry Revenue (billion), by Type of Disease 2025 & 2033
- Figure 20: Asia Pacific Anemia Treatment Industry Volume (K Unit), by Type of Disease 2025 & 2033
- Figure 21: Asia Pacific Anemia Treatment Industry Revenue Share (%), by Type of Disease 2025 & 2033
- Figure 22: Asia Pacific Anemia Treatment Industry Volume Share (%), by Type of Disease 2025 & 2033
- Figure 23: Asia Pacific Anemia Treatment Industry Revenue (billion), by Country 2025 & 2033
- Figure 24: Asia Pacific Anemia Treatment Industry Volume (K Unit), by Country 2025 & 2033
- Figure 25: Asia Pacific Anemia Treatment Industry Revenue Share (%), by Country 2025 & 2033
- Figure 26: Asia Pacific Anemia Treatment Industry Volume Share (%), by Country 2025 & 2033
- Figure 27: Middle East and Africa Anemia Treatment Industry Revenue (billion), by Type of Disease 2025 & 2033
- Figure 28: Middle East and Africa Anemia Treatment Industry Volume (K Unit), by Type of Disease 2025 & 2033
- Figure 29: Middle East and Africa Anemia Treatment Industry Revenue Share (%), by Type of Disease 2025 & 2033
- Figure 30: Middle East and Africa Anemia Treatment Industry Volume Share (%), by Type of Disease 2025 & 2033
- Figure 31: Middle East and Africa Anemia Treatment Industry Revenue (billion), by Country 2025 & 2033
- Figure 32: Middle East and Africa Anemia Treatment Industry Volume (K Unit), by Country 2025 & 2033
- Figure 33: Middle East and Africa Anemia Treatment Industry Revenue Share (%), by Country 2025 & 2033
- Figure 34: Middle East and Africa Anemia Treatment Industry Volume Share (%), by Country 2025 & 2033
- Figure 35: South America Anemia Treatment Industry Revenue (billion), by Type of Disease 2025 & 2033
- Figure 36: South America Anemia Treatment Industry Volume (K Unit), by Type of Disease 2025 & 2033
- Figure 37: South America Anemia Treatment Industry Revenue Share (%), by Type of Disease 2025 & 2033
- Figure 38: South America Anemia Treatment Industry Volume Share (%), by Type of Disease 2025 & 2033
- Figure 39: South America Anemia Treatment Industry Revenue (billion), by Country 2025 & 2033
- Figure 40: South America Anemia Treatment Industry Volume (K Unit), by Country 2025 & 2033
- Figure 41: South America Anemia Treatment Industry Revenue Share (%), by Country 2025 & 2033
- Figure 42: South America Anemia Treatment Industry Volume Share (%), by Country 2025 & 2033
List of Tables
- Table 1: Global Anemia Treatment Industry Revenue billion Forecast, by Type of Disease 2020 & 2033
- Table 2: Global Anemia Treatment Industry Volume K Unit Forecast, by Type of Disease 2020 & 2033
- Table 3: Global Anemia Treatment Industry Revenue billion Forecast, by Region 2020 & 2033
- Table 4: Global Anemia Treatment Industry Volume K Unit Forecast, by Region 2020 & 2033
- Table 5: Global Anemia Treatment Industry Revenue billion Forecast, by Type of Disease 2020 & 2033
- Table 6: Global Anemia Treatment Industry Volume K Unit Forecast, by Type of Disease 2020 & 2033
- Table 7: Global Anemia Treatment Industry Revenue billion Forecast, by Country 2020 & 2033
- Table 8: Global Anemia Treatment Industry Volume K Unit Forecast, by Country 2020 & 2033
- Table 9: United States Anemia Treatment Industry Revenue (billion) Forecast, by Application 2020 & 2033
- Table 10: United States Anemia Treatment Industry Volume (K Unit) Forecast, by Application 2020 & 2033
- Table 11: Canada Anemia Treatment Industry Revenue (billion) Forecast, by Application 2020 & 2033
- Table 12: Canada Anemia Treatment Industry Volume (K Unit) Forecast, by Application 2020 & 2033
- Table 13: Mexico Anemia Treatment Industry Revenue (billion) Forecast, by Application 2020 & 2033
- Table 14: Mexico Anemia Treatment Industry Volume (K Unit) Forecast, by Application 2020 & 2033
- Table 15: Global Anemia Treatment Industry Revenue billion Forecast, by Type of Disease 2020 & 2033
- Table 16: Global Anemia Treatment Industry Volume K Unit Forecast, by Type of Disease 2020 & 2033
- Table 17: Global Anemia Treatment Industry Revenue billion Forecast, by Country 2020 & 2033
- Table 18: Global Anemia Treatment Industry Volume K Unit Forecast, by Country 2020 & 2033
- Table 19: Germany Anemia Treatment Industry Revenue (billion) Forecast, by Application 2020 & 2033
- Table 20: Germany Anemia Treatment Industry Volume (K Unit) Forecast, by Application 2020 & 2033
- Table 21: United Kingdom Anemia Treatment Industry Revenue (billion) Forecast, by Application 2020 & 2033
- Table 22: United Kingdom Anemia Treatment Industry Volume (K Unit) Forecast, by Application 2020 & 2033
- Table 23: France Anemia Treatment Industry Revenue (billion) Forecast, by Application 2020 & 2033
- Table 24: France Anemia Treatment Industry Volume (K Unit) Forecast, by Application 2020 & 2033
- Table 25: Italy Anemia Treatment Industry Revenue (billion) Forecast, by Application 2020 & 2033
- Table 26: Italy Anemia Treatment Industry Volume (K Unit) Forecast, by Application 2020 & 2033
- Table 27: Spain Anemia Treatment Industry Revenue (billion) Forecast, by Application 2020 & 2033
- Table 28: Spain Anemia Treatment Industry Volume (K Unit) Forecast, by Application 2020 & 2033
- Table 29: Rest of Europe Anemia Treatment Industry Revenue (billion) Forecast, by Application 2020 & 2033
- Table 30: Rest of Europe Anemia Treatment Industry Volume (K Unit) Forecast, by Application 2020 & 2033
- Table 31: Global Anemia Treatment Industry Revenue billion Forecast, by Type of Disease 2020 & 2033
- Table 32: Global Anemia Treatment Industry Volume K Unit Forecast, by Type of Disease 2020 & 2033
- Table 33: Global Anemia Treatment Industry Revenue billion Forecast, by Country 2020 & 2033
- Table 34: Global Anemia Treatment Industry Volume K Unit Forecast, by Country 2020 & 2033
- Table 35: China Anemia Treatment Industry Revenue (billion) Forecast, by Application 2020 & 2033
- Table 36: China Anemia Treatment Industry Volume (K Unit) Forecast, by Application 2020 & 2033
- Table 37: Japan Anemia Treatment Industry Revenue (billion) Forecast, by Application 2020 & 2033
- Table 38: Japan Anemia Treatment Industry Volume (K Unit) Forecast, by Application 2020 & 2033
- Table 39: India Anemia Treatment Industry Revenue (billion) Forecast, by Application 2020 & 2033
- Table 40: India Anemia Treatment Industry Volume (K Unit) Forecast, by Application 2020 & 2033
- Table 41: Australia Anemia Treatment Industry Revenue (billion) Forecast, by Application 2020 & 2033
- Table 42: Australia Anemia Treatment Industry Volume (K Unit) Forecast, by Application 2020 & 2033
- Table 43: South Korea Anemia Treatment Industry Revenue (billion) Forecast, by Application 2020 & 2033
- Table 44: South Korea Anemia Treatment Industry Volume (K Unit) Forecast, by Application 2020 & 2033
- Table 45: Rest of Asia Pacific Anemia Treatment Industry Revenue (billion) Forecast, by Application 2020 & 2033
- Table 46: Rest of Asia Pacific Anemia Treatment Industry Volume (K Unit) Forecast, by Application 2020 & 2033
- Table 47: Global Anemia Treatment Industry Revenue billion Forecast, by Type of Disease 2020 & 2033
- Table 48: Global Anemia Treatment Industry Volume K Unit Forecast, by Type of Disease 2020 & 2033
- Table 49: Global Anemia Treatment Industry Revenue billion Forecast, by Country 2020 & 2033
- Table 50: Global Anemia Treatment Industry Volume K Unit Forecast, by Country 2020 & 2033
- Table 51: GCC Anemia Treatment Industry Revenue (billion) Forecast, by Application 2020 & 2033
- Table 52: GCC Anemia Treatment Industry Volume (K Unit) Forecast, by Application 2020 & 2033
- Table 53: South Africa Anemia Treatment Industry Revenue (billion) Forecast, by Application 2020 & 2033
- Table 54: South Africa Anemia Treatment Industry Volume (K Unit) Forecast, by Application 2020 & 2033
- Table 55: Rest of Middle East and Africa Anemia Treatment Industry Revenue (billion) Forecast, by Application 2020 & 2033
- Table 56: Rest of Middle East and Africa Anemia Treatment Industry Volume (K Unit) Forecast, by Application 2020 & 2033
- Table 57: Global Anemia Treatment Industry Revenue billion Forecast, by Type of Disease 2020 & 2033
- Table 58: Global Anemia Treatment Industry Volume K Unit Forecast, by Type of Disease 2020 & 2033
- Table 59: Global Anemia Treatment Industry Revenue billion Forecast, by Country 2020 & 2033
- Table 60: Global Anemia Treatment Industry Volume K Unit Forecast, by Country 2020 & 2033
- Table 61: Brazil Anemia Treatment Industry Revenue (billion) Forecast, by Application 2020 & 2033
- Table 62: Brazil Anemia Treatment Industry Volume (K Unit) Forecast, by Application 2020 & 2033
- Table 63: Argentina Anemia Treatment Industry Revenue (billion) Forecast, by Application 2020 & 2033
- Table 64: Argentina Anemia Treatment Industry Volume (K Unit) Forecast, by Application 2020 & 2033
- Table 65: Rest of South America Anemia Treatment Industry Revenue (billion) Forecast, by Application 2020 & 2033
- Table 66: Rest of South America Anemia Treatment Industry Volume (K Unit) Forecast, by Application 2020 & 2033
Frequently Asked Questions
1. What is the projected Compound Annual Growth Rate (CAGR) of the Anemia Treatment Industry?
The projected CAGR is approximately 7.12%.
2. Which companies are prominent players in the Anemia Treatment Industry?
Key companies in the market include Covis Pharma GmbH (AMAG Pharmaceuticals Inc ), Sanofi, Pieris Pharmaceuticals Inc, Akebia Therapeutics Inc, Takeda Pharmaceutical Company Limited, Pharmacosmos A/S, GSK plc, Bluebird Bio Inc, AbbVie Inc (Allergan Plc), Pfizer Inc (Global Blood Therapeutics Inc ).
3. What are the main segments of the Anemia Treatment Industry?
The market segments include Type of Disease.
4. Can you provide details about the market size?
The market size is estimated to be USD 12.31 billion as of 2022.
5. What are some drivers contributing to market growth?
Increasing Cases of Anemia Across the Globe; Increasing Number of Women With Reproductive Age.
6. What are the notable trends driving market growth?
Iron Deficiency Anemia to Witness Healthy Growth Over the Forecast Period.
7. Are there any restraints impacting market growth?
Lack of Awareness About the Treatment in Developing Regions; High Cost of Drugs.
8. Can you provide examples of recent developments in the market?
November 2022: Sanofi received approval from the European Commission (EC) for Enjaymo (sutimlimab) for the treatment of hemolytic anemia in adult patients with cold agglutinin disease (CAD), a rare, serious, and chronic autoimmune hemolytic anemia, where the body's immune system mistakenly attacks healthy red blood cells and causes their rupture, known as hemolysis.
9. What pricing options are available for accessing the report?
Pricing options include single-user, multi-user, and enterprise licenses priced at USD 4750, USD 5250, and USD 8750 respectively.
10. Is the market size provided in terms of value or volume?
The market size is provided in terms of value, measured in billion and volume, measured in K Unit.
11. Are there any specific market keywords associated with the report?
Yes, the market keyword associated with the report is "Anemia Treatment Industry," which aids in identifying and referencing the specific market segment covered.
12. How do I determine which pricing option suits my needs best?
The pricing options vary based on user requirements and access needs. Individual users may opt for single-user licenses, while businesses requiring broader access may choose multi-user or enterprise licenses for cost-effective access to the report.
13. Are there any additional resources or data provided in the Anemia Treatment Industry report?
While the report offers comprehensive insights, it's advisable to review the specific contents or supplementary materials provided to ascertain if additional resources or data are available.
14. How can I stay updated on further developments or reports in the Anemia Treatment Industry?
To stay informed about further developments, trends, and reports in the Anemia Treatment Industry, consider subscribing to industry newsletters, following relevant companies and organizations, or regularly checking reputable industry news sources and publications.
Methodology
Step 1 - Identification of Relevant Samples Size from Population Database


Step 2 - Approaches for Defining Global Market Size (Value, Volume* & Price*)

Note*: In applicable scenarios
Step 3 - Data Sources
Primary Research
- Web Analytics
- Survey Reports
- Research Institute
- Latest Research Reports
- Opinion Leaders
Secondary Research
- Annual Reports
- White Paper
- Latest Press Release
- Industry Association
- Paid Database
- Investor Presentations

Step 4 - Data Triangulation
Involves using different sources of information in order to increase the validity of a study
These sources are likely to be stakeholders in a program - participants, other researchers, program staff, other community members, and so on.
Then we put all data in single framework & apply various statistical tools to find out the dynamic on the market.
During the analysis stage, feedback from the stakeholder groups would be compared to determine areas of agreement as well as areas of divergence