

Key Insights
The Label-free Detection market is poised for significant expansion, projected to reach an estimated $1.72 billion by 2025, with a compelling Compound Annual Growth Rate (CAGR) of 11.60% through 2033. This robust growth is primarily fueled by the increasing demand for high-throughput screening in drug discovery and development. Pharmaceutical and biotechnology companies are heavily investing in label-free technologies to accelerate the identification of potential drug candidates and to gain deeper insights into molecular interactions. The inherent advantages of label-free methods, such as eliminating the need for labels that can interfere with biological activity and simplifying experimental workflows, are driving widespread adoption across various research applications, including binding kinetics, binding thermodynamics, and hit confirmation. Furthermore, the growing complexity of biological systems and the need for precise characterization of molecular targets are creating a fertile ground for innovation and market penetration.
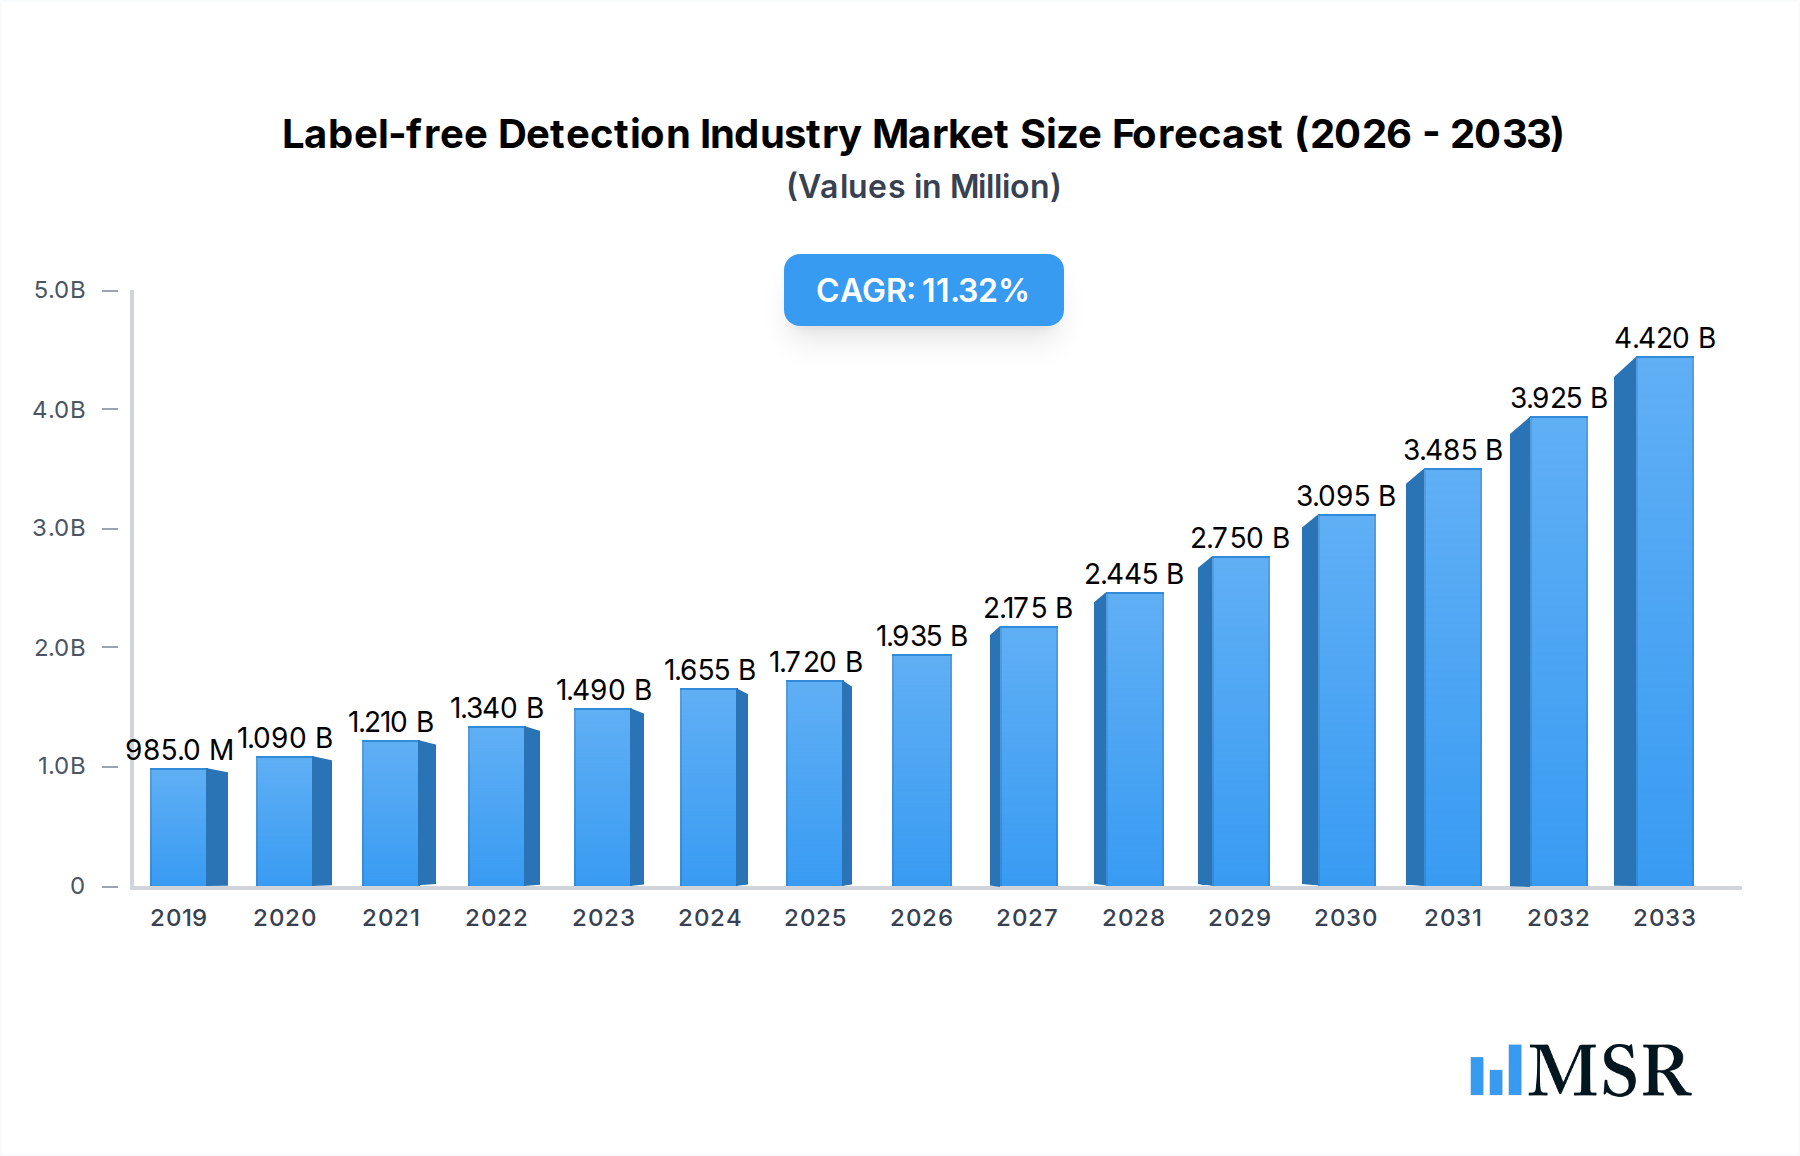
Label-free Detection Industry Market Size (In Million)
Key drivers underpinning this market trajectory include advancements in instrumentation and technology, such as the evolution of Surface Plasmon Resonance (SPR) and Bio-Layer Interferometry (BLI) systems, offering enhanced sensitivity and throughput. The expanding applications in endogenous receptor detection and lead generation are also contributing to market dynamism. While the market benefits from strong demand, certain restraints, such as the high initial cost of some sophisticated instrumentation and the requirement for specialized expertise, may present challenges. However, the continuous innovation in cost-effective solutions and the growing accessibility of these technologies are expected to mitigate these limitations. Geographically, North America and Europe are expected to remain dominant regions due to substantial R&D investments and a strong presence of leading pharmaceutical and biotechnology firms. The Asia Pacific region, particularly China and India, is emerging as a rapidly growing market driven by increasing healthcare expenditure and a burgeoning contract research organization (CRO) sector.

Label-free Detection Industry Company Market Share
Unlock critical insights into the burgeoning Label-free Detection market. This comprehensive report, covering 2019-2033 with a base year of 2025, offers deep analysis of market dynamics, technological advancements, key players, and future growth trajectories. Essential for pharmaceutical & biotechnology companies, academic & research institutes, and contract research organizations seeking to leverage label-free detection technologies.
Label-free Detection Industry Market Concentration & Dynamics
The Label-free Detection (LFD) market exhibits moderate concentration, driven by innovation and strategic collaborations among key players. The pharmaceutical & biotechnology sector significantly influences LFD market share, demanding advanced solutions for drug discovery and development. Innovation ecosystems are thriving, with continuous research and development in biosensor chips, microplates, and advanced LFD instruments. Regulatory frameworks, while evolving, are largely supportive of validated label-free detection technologies like Mass Spectrometry, Surface Plasmon Resonance (SPR), and Bio-Layer Interferometry. Substitute products, primarily traditional assay methods, are gradually being displaced by the superior efficiency and accuracy of LFD. End-user trends favor binding kinetics, binding thermodynamics, and hit confirmation applications. Mergers and acquisitions (M&A) activity is on the rise, with an estimated XX M&A deals in the past two years, indicating a consolidation phase and strategic expansion by leading companies. For instance, Thermo Fisher Scientific and Danaher Corporation (Cytiva) consistently invest in acquiring innovative LFD startups.
Label-free Detection Industry Industry Insights & Trends
The Label-free Detection market size is projected to reach XXX Million USD by 2025, exhibiting a robust Compound Annual Growth Rate (CAGR) of XX% during the forecast period (2025–2033). This significant growth is propelled by escalating demand for high-throughput screening and precise molecular interaction analysis in drug discovery and development. Technological disruptions are at the forefront, with continuous advancements in Mass Spectrometry, SPR, Bio-Layer Interferometry, and Isothermal Titration Calorimetry offering enhanced sensitivity and speed. The trend towards label-free detection technologies stems from the need to circumvent the limitations and potential artifacts associated with traditional labeling techniques. Evolving consumer behaviors within the pharmaceutical & biotechnology companies and academic & research institutes are increasingly prioritizing binding kinetics and binding thermodynamics studies for a deeper understanding of drug efficacy and target engagement. Furthermore, the growing emphasis on endogenous receptor detection and hit confirmation in early-stage research is a major market driver. The increasing complexity of biological systems and the pursuit of personalized medicine are further fueling the adoption of sophisticated label-free analytical instruments. The market is also witnessing a surge in demand for integrated solutions, encompassing both label-free detection instruments and their associated consumables like specialized biosensor chips. The contract research organizations (CROs) segment is also expanding its reliance on LFD to provide advanced research services, thereby contributing to overall market expansion. The estimated market value for label-free detection instruments alone is projected to cross XXX Million USD by 2025.
Key Markets & Segments Leading Label-free Detection Industry
The Label-free Detection industry is dominated by North America, particularly the United States, driven by its substantial pharmaceutical & biotechnology companies and extensive academic & research institutes.
Dominant Region: North America, with an estimated XX% of the global market share in 2025.
Key Country: United States, characterized by significant R&D expenditure and a strong presence of leading LFD companies.
Leading Product Segment: Instruments are the largest segment, projected to account for XX% of the market revenue in 2025, driven by the demand for advanced SPR systems, mass spectrometers, and bio-layer interferometry platforms.
Dominant Technology:
- Mass Spectrometry: Leading due to its versatility in protein identification, quantification, and interaction studies.
- Surface Plasmon Resonance (SPR): Crucial for real-time, label-free analysis of molecular interactions, particularly in binding kinetics and binding thermodynamics.
- Bio-Layer Interferometry (BLI): Gaining traction for its speed and ease of use in small molecule-protein kinetics studies.
Key Application Segments:
- Binding Kinetics: A primary driver, essential for understanding the speed and strength of molecular interactions, with an estimated market size of XXX Million USD in 2025.
- Binding Thermodynamics: Crucial for elucidating the energetic aspects of molecular binding.
- Hit Confirmation: A critical step in drug discovery, where LFD offers a reliable method for validating potential drug candidates.
Dominant End-User Segment:
- Pharmaceutical & Biotechnology Companies: Representing the largest share, approximately XX%, due to extensive R&D investments in drug discovery and development.
- Academic & Research Institutes: A significant segment, contributing to fundamental research and the development of new label-free detection technologies.
- Contract Research Organizations (CROs): Experiencing substantial growth as they offer specialized LFD services to the pharmaceutical and biotech industries.
The economic growth in emerging economies, coupled with increasing healthcare spending and government initiatives supporting life sciences research, are further propelling the adoption of label-free detection solutions across these key markets and segments. The market for consumables, including biosensor chips and specialized microplates, is also projected to grow steadily, supporting the expansion of label-free analytical instruments.
Label-free Detection Industry Product Developments
Recent product developments in the label-free detection industry are significantly enhancing research capabilities. Innovations focus on increasing throughput, improving sensitivity, and expanding the range of detectable analytes. Advancements in Mass Spectrometry systems, such as the Bruker Corporation's nanoElute 2, are enabling automated single-cell sample preparation and deeper proteomic analysis, crucial for understanding protein-protein interactions. The introduction of specialized probes for Bio-Layer Interferometry by Gator Bio, Inc. streamlines small molecule-protein kinetics studies. Furthermore, the launch of high-performance Octet R series systems by Sartorius underscores the continuous evolution of label-free analytical products for various applications including lead generation and hit confirmation. These developments are directly impacting market relevance by providing researchers with more powerful and efficient tools for complex biological investigations.
Challenges in the Label-free Detection Industry Market
Despite robust growth, the Label-free Detection market faces several challenges. High initial investment costs for advanced LFD instruments can be a barrier for smaller research institutions and startups. Regulatory hurdles for the validation of new label-free detection technologies can slow down market penetration. Supply chain disruptions for critical consumables, such as specialized biosensor chips, can impact research continuity, with potential impacts on research timelines estimated at XX% delay. Intense competitive pressures among established players and emerging innovators also necessitate continuous investment in R&D to maintain market share. The estimated cost impact of these challenges on market growth is approximately XXX Million USD annually.
Forces Driving Label-free Detection Industry Growth
Several key forces are driving the Label-free Detection industry growth. Technological advancements in Mass Spectrometry, SPR, and Bio-Layer Interferometry are offering unprecedented insights into molecular interactions, fueling adoption in drug discovery. The increasing demand for binding kinetics and binding thermodynamics data in pharmaceutical R&D is a significant economic factor. Supportive government initiatives and funding for life sciences research, particularly in genomics and proteomics, create a favorable regulatory environment. The growing prevalence of chronic diseases necessitates the development of novel therapeutics, driving the need for efficient label-free drug discovery tools. The estimated market growth due to these factors is projected at XX% CAGR.
Challenges in the Label-free Detection Industry Market
Long-term growth catalysts for the label-free detection industry lie in continued innovation and strategic market expansion. The development of more cost-effective and user-friendly label-free analytical instruments will broaden market access. Strategic partnerships between LFD companies and pharmaceutical giants can accelerate the translation of research into clinical applications. Furthermore, expanding the application of label-free detection technologies beyond traditional drug discovery into areas like diagnostics and food safety presents significant market expansion opportunities. The increasing integration of AI and machine learning with label-free data analysis will unlock deeper biological insights, further solidifying the industry's long-term growth trajectory.
Emerging Opportunities in Label-free Detection Industry
Emerging opportunities in the Label-free Detection industry are abundant. The growing field of single-cell analysis presents a significant avenue, with label-free methods offering a way to study cellular heterogeneity without introducing labeling artifacts. The development of portable and miniaturized LFD devices for point-of-care diagnostics and field research is another promising trend. Furthermore, the expansion of label-free technologies into emerging markets in Asia-Pacific and Latin America, driven by increasing healthcare investments, offers substantial growth potential. The increasing focus on understanding the proteome and metabolome will continue to drive demand for advanced mass spectrometry and other label-free detection techniques. The market for label-free protein-protein interaction studies alone is expected to grow by XX% in the next five years.
Leading Players in the Label-free Detection Industry Sector
- Horiba Ltd
- Waters
- Ametek Inc
- Fluidic Analytics
- PerkinElmer Inc
- Malvern Panalytical
- Thermo Fisher Scientific
- Corning Incorporated
- Cytiva (Danaher Corporation)
- Shimadzu Corporation
Key Milestones in Label-free Detection Industry Industry
- August 2022: Bruker Corporation announced the launch of the new nanoElute 2 nano-LC, MetaboScape, and TASQ 2023 software supporting fluxomics and the latest advances in PaSERs intelligent acquisition to enhance research in protein-protein interactions (PPIs) and metaproteomics applications. nanoElute 2 features nano-LC advances that support automated single-cell sample preparation from label-free ProteoCHIP on the CellenONE platform.
- October 2021: Gator Bio, Inc. launched its Gator SMAP probe and Gator mFC probe for its GatorPrime and GatorPlus biolayer interferometry (BLI) systems. The systems are dedicated to small molecule-protein kinetics studies and hybridoma and small peptide kinetic screening.
- March 2021: The Life Science Group Sartorius launched the new high-performance Octet R series of systems, the latest improvement in the company's line of label-free analytical products.
Strategic Outlook for Label-free Detection Industry Market
The strategic outlook for the Label-free Detection industry is highly positive, driven by a confluence of technological innovation and market demand. Growth accelerators include the increasing adoption of label-free detection technologies in personalized medicine, the expansion of LFD applications in diagnostics, and the continuous development of more sophisticated label-free analytical instruments. Strategic opportunities lie in forging collaborations to integrate LFD capabilities into broader drug discovery platforms, developing cost-effective solutions for emerging markets, and leveraging AI for enhanced data interpretation. The anticipated market value by 2033 is estimated to exceed XXX Million USD, underscoring the significant future potential and strategic importance of this dynamic sector.
Label-free Detection Industry Segmentation
-
1. Product
-
1.1. Consumables
- 1.1.1. Biosensor Chips
- 1.1.2. Microplates
- 1.2. Instruments
-
1.1. Consumables
-
2. Technology
- 2.1. Mass Spectrometry
- 2.2. Surface Plasmon Resonance (SPR)
- 2.3. Bio-Layer Interferometry
- 2.4. Isothermal Titration Calorimetry
- 2.5. Differential Scanning Calorimetry
- 2.6. Other LFD Technologies
-
3. Application
- 3.1. Binding Kinetics
- 3.2. Binding Thermodynamics
- 3.3. Endogenous Receptor Detection
- 3.4. Hit Confirmation
- 3.5. Lead Generation
- 3.6. Other Applications
-
4. End-User
- 4.1. Pharmaceutical & Biotechnology Companies
- 4.2. Academic & Research Institutes
- 4.3. Contract Research Organizations
Label-free Detection Industry Segmentation By Geography
-
1. North America
- 1.1. United States
- 1.2. Canada
- 1.3. Mexico
-
2. Europe
- 2.1. Germany
- 2.2. United Kingdom
- 2.3. France
- 2.4. Italy
- 2.5. Spain
- 2.6. Rest of Europe
-
3. Asia Pacific
- 3.1. China
- 3.2. Japan
- 3.3. India
- 3.4. Australia
- 3.5. South Korea
- 3.6. Rest of Asia Pacific
-
4. Middle East and Africa
- 4.1. GCC
- 4.2. South Africa
- 4.3. Rest of Middle East and Africa
-
5. South America
- 5.1. Brazil
- 5.2. Argentina
- 5.3. Rest of South America
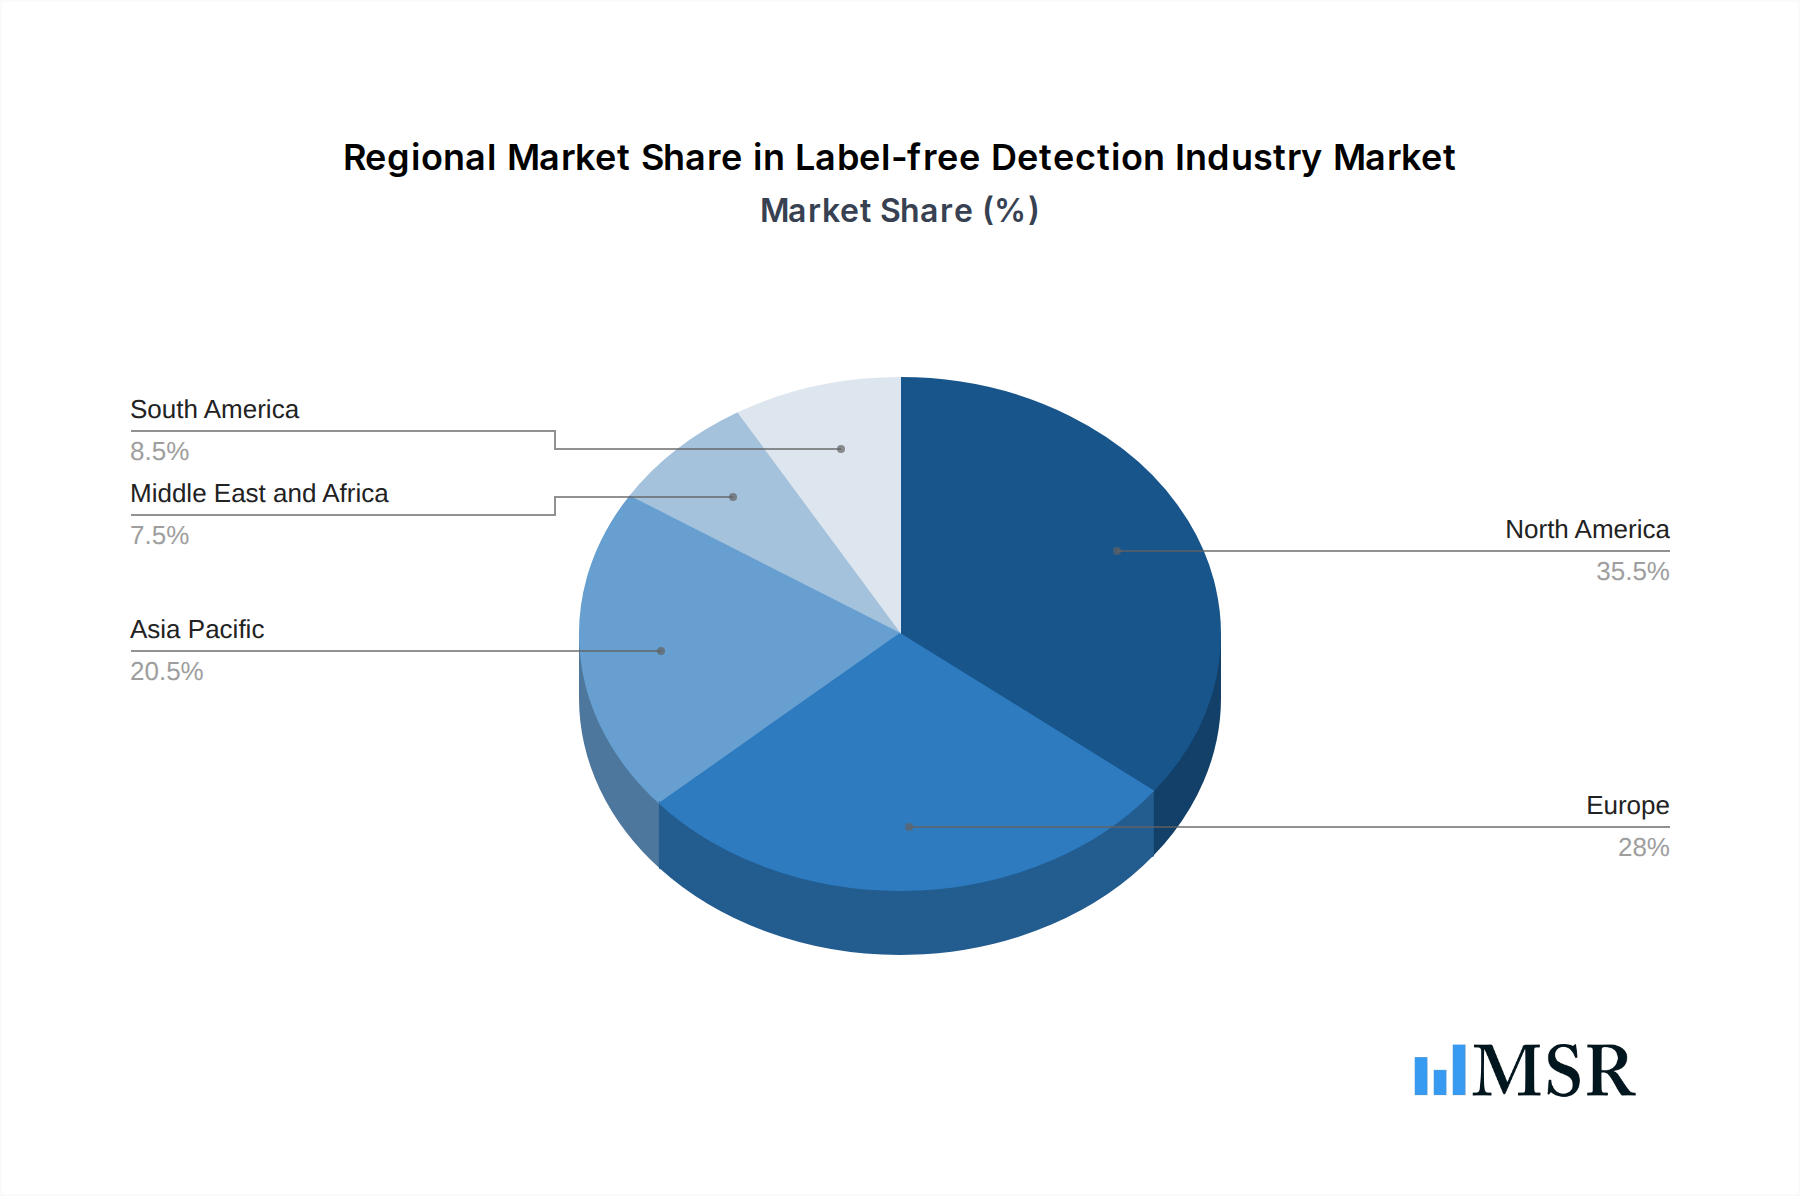
Label-free Detection Industry Regional Market Share
Geographic Coverage of Label-free Detection Industry
Label-free Detection Industry REPORT HIGHLIGHTS
| Aspects | Details |
|---|---|
| Study Period | 2020-2034 |
| Base Year | 2025 |
| Estimated Year | 2026 |
| Forecast Period | 2026-2034 |
| Historical Period | 2020-2025 |
| Growth Rate | CAGR of 11.60% from 2020-2034 |
| Segmentation |
|
Table of Contents
- 1. Introduction
- 1.1. Research Scope
- 1.2. Market Segmentation
- 1.3. Research Objective
- 1.4. Definitions and Assumptions
- 2. Executive Summary
- 2.1. Market Snapshot
- 3. Market Dynamics
- 3.1. Market Drivers
- 3.2. Market Restrains
- 3.3. Market Trends
- 3.4. Market Opportunities
- 4. Market Factor Analysis
- 4.1. Porters Five Forces
- 4.1.1. Bargaining Power of Suppliers
- 4.1.2. Bargaining Power of Buyers
- 4.1.3. Threat of New Entrants
- 4.1.4. Threat of Substitutes
- 4.1.5. Competitive Rivalry
- 4.2. PESTEL analysis
- 4.3. BCG Analysis
- 4.3.1. Stars (High Growth, High Market Share)
- 4.3.2. Cash Cows (Low Growth, High Market Share)
- 4.3.3. Question Mark (High Growth, Low Market Share)
- 4.3.4. Dogs (Low Growth, Low Market Share)
- 4.4. Ansoff Matrix Analysis
- 4.5. Supply Chain Analysis
- 4.6. Regulatory Landscape
- 4.7. Current Market Potential and Opportunity Assessment (TAM–SAM–SOM Framework)
- 4.8. MSR Analyst Note
- 4.1. Porters Five Forces
- 5. Market Analysis, Insights and Forecast 2021-2033
- 5.1. Market Analysis, Insights and Forecast - by Product
- 5.1.1. Consumables
- 5.1.1.1. Biosensor Chips
- 5.1.1.2. Microplates
- 5.1.2. Instruments
- 5.1.1. Consumables
- 5.2. Market Analysis, Insights and Forecast - by Technology
- 5.2.1. Mass Spectrometry
- 5.2.2. Surface Plasmon Resonance (SPR)
- 5.2.3. Bio-Layer Interferometry
- 5.2.4. Isothermal Titration Calorimetry
- 5.2.5. Differential Scanning Calorimetry
- 5.2.6. Other LFD Technologies
- 5.3. Market Analysis, Insights and Forecast - by Application
- 5.3.1. Binding Kinetics
- 5.3.2. Binding Thermodynamics
- 5.3.3. Endogenous Receptor Detection
- 5.3.4. Hit Confirmation
- 5.3.5. Lead Generation
- 5.3.6. Other Applications
- 5.4. Market Analysis, Insights and Forecast - by End-User
- 5.4.1. Pharmaceutical & Biotechnology Companies
- 5.4.2. Academic & Research Institutes
- 5.4.3. Contract Research Organizations
- 5.5. Market Analysis, Insights and Forecast - by Region
- 5.5.1. North America
- 5.5.2. Europe
- 5.5.3. Asia Pacific
- 5.5.4. Middle East and Africa
- 5.5.5. South America
- 5.1. Market Analysis, Insights and Forecast - by Product
- 6. Global Label-free Detection Industry Analysis, Insights and Forecast, 2021-2033
- 6.1. Market Analysis, Insights and Forecast - by Product
- 6.1.1. Consumables
- 6.1.1.1. Biosensor Chips
- 6.1.1.2. Microplates
- 6.1.2. Instruments
- 6.1.1. Consumables
- 6.2. Market Analysis, Insights and Forecast - by Technology
- 6.2.1. Mass Spectrometry
- 6.2.2. Surface Plasmon Resonance (SPR)
- 6.2.3. Bio-Layer Interferometry
- 6.2.4. Isothermal Titration Calorimetry
- 6.2.5. Differential Scanning Calorimetry
- 6.2.6. Other LFD Technologies
- 6.3. Market Analysis, Insights and Forecast - by Application
- 6.3.1. Binding Kinetics
- 6.3.2. Binding Thermodynamics
- 6.3.3. Endogenous Receptor Detection
- 6.3.4. Hit Confirmation
- 6.3.5. Lead Generation
- 6.3.6. Other Applications
- 6.4. Market Analysis, Insights and Forecast - by End-User
- 6.4.1. Pharmaceutical & Biotechnology Companies
- 6.4.2. Academic & Research Institutes
- 6.4.3. Contract Research Organizations
- 6.1. Market Analysis, Insights and Forecast - by Product
- 7. North America Label-free Detection Industry Analysis, Insights and Forecast, 2020-2032
- 7.1. Market Analysis, Insights and Forecast - by Product
- 7.1.1. Consumables
- 7.1.1.1. Biosensor Chips
- 7.1.1.2. Microplates
- 7.1.2. Instruments
- 7.1.1. Consumables
- 7.2. Market Analysis, Insights and Forecast - by Technology
- 7.2.1. Mass Spectrometry
- 7.2.2. Surface Plasmon Resonance (SPR)
- 7.2.3. Bio-Layer Interferometry
- 7.2.4. Isothermal Titration Calorimetry
- 7.2.5. Differential Scanning Calorimetry
- 7.2.6. Other LFD Technologies
- 7.3. Market Analysis, Insights and Forecast - by Application
- 7.3.1. Binding Kinetics
- 7.3.2. Binding Thermodynamics
- 7.3.3. Endogenous Receptor Detection
- 7.3.4. Hit Confirmation
- 7.3.5. Lead Generation
- 7.3.6. Other Applications
- 7.4. Market Analysis, Insights and Forecast - by End-User
- 7.4.1. Pharmaceutical & Biotechnology Companies
- 7.4.2. Academic & Research Institutes
- 7.4.3. Contract Research Organizations
- 7.1. Market Analysis, Insights and Forecast - by Product
- 8. Europe Label-free Detection Industry Analysis, Insights and Forecast, 2020-2032
- 8.1. Market Analysis, Insights and Forecast - by Product
- 8.1.1. Consumables
- 8.1.1.1. Biosensor Chips
- 8.1.1.2. Microplates
- 8.1.2. Instruments
- 8.1.1. Consumables
- 8.2. Market Analysis, Insights and Forecast - by Technology
- 8.2.1. Mass Spectrometry
- 8.2.2. Surface Plasmon Resonance (SPR)
- 8.2.3. Bio-Layer Interferometry
- 8.2.4. Isothermal Titration Calorimetry
- 8.2.5. Differential Scanning Calorimetry
- 8.2.6. Other LFD Technologies
- 8.3. Market Analysis, Insights and Forecast - by Application
- 8.3.1. Binding Kinetics
- 8.3.2. Binding Thermodynamics
- 8.3.3. Endogenous Receptor Detection
- 8.3.4. Hit Confirmation
- 8.3.5. Lead Generation
- 8.3.6. Other Applications
- 8.4. Market Analysis, Insights and Forecast - by End-User
- 8.4.1. Pharmaceutical & Biotechnology Companies
- 8.4.2. Academic & Research Institutes
- 8.4.3. Contract Research Organizations
- 8.1. Market Analysis, Insights and Forecast - by Product
- 9. Asia Pacific Label-free Detection Industry Analysis, Insights and Forecast, 2020-2032
- 9.1. Market Analysis, Insights and Forecast - by Product
- 9.1.1. Consumables
- 9.1.1.1. Biosensor Chips
- 9.1.1.2. Microplates
- 9.1.2. Instruments
- 9.1.1. Consumables
- 9.2. Market Analysis, Insights and Forecast - by Technology
- 9.2.1. Mass Spectrometry
- 9.2.2. Surface Plasmon Resonance (SPR)
- 9.2.3. Bio-Layer Interferometry
- 9.2.4. Isothermal Titration Calorimetry
- 9.2.5. Differential Scanning Calorimetry
- 9.2.6. Other LFD Technologies
- 9.3. Market Analysis, Insights and Forecast - by Application
- 9.3.1. Binding Kinetics
- 9.3.2. Binding Thermodynamics
- 9.3.3. Endogenous Receptor Detection
- 9.3.4. Hit Confirmation
- 9.3.5. Lead Generation
- 9.3.6. Other Applications
- 9.4. Market Analysis, Insights and Forecast - by End-User
- 9.4.1. Pharmaceutical & Biotechnology Companies
- 9.4.2. Academic & Research Institutes
- 9.4.3. Contract Research Organizations
- 9.1. Market Analysis, Insights and Forecast - by Product
- 10. Middle East and Africa Label-free Detection Industry Analysis, Insights and Forecast, 2020-2032
- 10.1. Market Analysis, Insights and Forecast - by Product
- 10.1.1. Consumables
- 10.1.1.1. Biosensor Chips
- 10.1.1.2. Microplates
- 10.1.2. Instruments
- 10.1.1. Consumables
- 10.2. Market Analysis, Insights and Forecast - by Technology
- 10.2.1. Mass Spectrometry
- 10.2.2. Surface Plasmon Resonance (SPR)
- 10.2.3. Bio-Layer Interferometry
- 10.2.4. Isothermal Titration Calorimetry
- 10.2.5. Differential Scanning Calorimetry
- 10.2.6. Other LFD Technologies
- 10.3. Market Analysis, Insights and Forecast - by Application
- 10.3.1. Binding Kinetics
- 10.3.2. Binding Thermodynamics
- 10.3.3. Endogenous Receptor Detection
- 10.3.4. Hit Confirmation
- 10.3.5. Lead Generation
- 10.3.6. Other Applications
- 10.4. Market Analysis, Insights and Forecast - by End-User
- 10.4.1. Pharmaceutical & Biotechnology Companies
- 10.4.2. Academic & Research Institutes
- 10.4.3. Contract Research Organizations
- 10.1. Market Analysis, Insights and Forecast - by Product
- 11. South America Label-free Detection Industry Analysis, Insights and Forecast, 2020-2032
- 11.1. Market Analysis, Insights and Forecast - by Product
- 11.1.1. Consumables
- 11.1.1.1. Biosensor Chips
- 11.1.1.2. Microplates
- 11.1.2. Instruments
- 11.1.1. Consumables
- 11.2. Market Analysis, Insights and Forecast - by Technology
- 11.2.1. Mass Spectrometry
- 11.2.2. Surface Plasmon Resonance (SPR)
- 11.2.3. Bio-Layer Interferometry
- 11.2.4. Isothermal Titration Calorimetry
- 11.2.5. Differential Scanning Calorimetry
- 11.2.6. Other LFD Technologies
- 11.3. Market Analysis, Insights and Forecast - by Application
- 11.3.1. Binding Kinetics
- 11.3.2. Binding Thermodynamics
- 11.3.3. Endogenous Receptor Detection
- 11.3.4. Hit Confirmation
- 11.3.5. Lead Generation
- 11.3.6. Other Applications
- 11.4. Market Analysis, Insights and Forecast - by End-User
- 11.4.1. Pharmaceutical & Biotechnology Companies
- 11.4.2. Academic & Research Institutes
- 11.4.3. Contract Research Organizations
- 11.1. Market Analysis, Insights and Forecast - by Product
- 12. Competitive Analysis
- 12.1. Company Profiles
- 12.1.1 Horiba Ltd
- 12.1.1.1. Company Overview
- 12.1.1.2. Products
- 12.1.1.3. Company Financials
- 12.1.1.4. SWOT Analysis
- 12.1.2 Waters
- 12.1.2.1. Company Overview
- 12.1.2.2. Products
- 12.1.2.3. Company Financials
- 12.1.2.4. SWOT Analysis
- 12.1.3 Ametek Inc
- 12.1.3.1. Company Overview
- 12.1.3.2. Products
- 12.1.3.3. Company Financials
- 12.1.3.4. SWOT Analysis
- 12.1.4 Fluidic Analytics
- 12.1.4.1. Company Overview
- 12.1.4.2. Products
- 12.1.4.3. Company Financials
- 12.1.4.4. SWOT Analysis
- 12.1.5 PerkinElmer Inc
- 12.1.5.1. Company Overview
- 12.1.5.2. Products
- 12.1.5.3. Company Financials
- 12.1.5.4. SWOT Analysis
- 12.1.6 Malvern Panalytical
- 12.1.6.1. Company Overview
- 12.1.6.2. Products
- 12.1.6.3. Company Financials
- 12.1.6.4. SWOT Analysis
- 12.1.7 Thermo Fisher Scientific
- 12.1.7.1. Company Overview
- 12.1.7.2. Products
- 12.1.7.3. Company Financials
- 12.1.7.4. SWOT Analysis
- 12.1.8 Corning Incorporated
- 12.1.8.1. Company Overview
- 12.1.8.2. Products
- 12.1.8.3. Company Financials
- 12.1.8.4. SWOT Analysis
- 12.1.9 Cytiva (Danaher Corporation)
- 12.1.9.1. Company Overview
- 12.1.9.2. Products
- 12.1.9.3. Company Financials
- 12.1.9.4. SWOT Analysis
- 12.1.10 Shimadzu Corporation
- 12.1.10.1. Company Overview
- 12.1.10.2. Products
- 12.1.10.3. Company Financials
- 12.1.10.4. SWOT Analysis
- 12.1.1 Horiba Ltd
- 12.2. Market Entropy
- 12.2.1 Company's Key Areas Served
- 12.2.2 Recent Developments
- 12.3. Company Market Share Analysis 2025
- 12.3.1 Top 5 Companies Market Share Analysis
- 12.3.2 Top 3 Companies Market Share Analysis
- 12.4. List of Potential Customers
- 13. Research Methodology
List of Figures
- Figure 1: Global Label-free Detection Industry Revenue Breakdown (Million, %) by Region 2025 & 2033
- Figure 2: North America Label-free Detection Industry Revenue (Million), by Product 2025 & 2033
- Figure 3: North America Label-free Detection Industry Revenue Share (%), by Product 2025 & 2033
- Figure 4: North America Label-free Detection Industry Revenue (Million), by Technology 2025 & 2033
- Figure 5: North America Label-free Detection Industry Revenue Share (%), by Technology 2025 & 2033
- Figure 6: North America Label-free Detection Industry Revenue (Million), by Application 2025 & 2033
- Figure 7: North America Label-free Detection Industry Revenue Share (%), by Application 2025 & 2033
- Figure 8: North America Label-free Detection Industry Revenue (Million), by End-User 2025 & 2033
- Figure 9: North America Label-free Detection Industry Revenue Share (%), by End-User 2025 & 2033
- Figure 10: North America Label-free Detection Industry Revenue (Million), by Country 2025 & 2033
- Figure 11: North America Label-free Detection Industry Revenue Share (%), by Country 2025 & 2033
- Figure 12: Europe Label-free Detection Industry Revenue (Million), by Product 2025 & 2033
- Figure 13: Europe Label-free Detection Industry Revenue Share (%), by Product 2025 & 2033
- Figure 14: Europe Label-free Detection Industry Revenue (Million), by Technology 2025 & 2033
- Figure 15: Europe Label-free Detection Industry Revenue Share (%), by Technology 2025 & 2033
- Figure 16: Europe Label-free Detection Industry Revenue (Million), by Application 2025 & 2033
- Figure 17: Europe Label-free Detection Industry Revenue Share (%), by Application 2025 & 2033
- Figure 18: Europe Label-free Detection Industry Revenue (Million), by End-User 2025 & 2033
- Figure 19: Europe Label-free Detection Industry Revenue Share (%), by End-User 2025 & 2033
- Figure 20: Europe Label-free Detection Industry Revenue (Million), by Country 2025 & 2033
- Figure 21: Europe Label-free Detection Industry Revenue Share (%), by Country 2025 & 2033
- Figure 22: Asia Pacific Label-free Detection Industry Revenue (Million), by Product 2025 & 2033
- Figure 23: Asia Pacific Label-free Detection Industry Revenue Share (%), by Product 2025 & 2033
- Figure 24: Asia Pacific Label-free Detection Industry Revenue (Million), by Technology 2025 & 2033
- Figure 25: Asia Pacific Label-free Detection Industry Revenue Share (%), by Technology 2025 & 2033
- Figure 26: Asia Pacific Label-free Detection Industry Revenue (Million), by Application 2025 & 2033
- Figure 27: Asia Pacific Label-free Detection Industry Revenue Share (%), by Application 2025 & 2033
- Figure 28: Asia Pacific Label-free Detection Industry Revenue (Million), by End-User 2025 & 2033
- Figure 29: Asia Pacific Label-free Detection Industry Revenue Share (%), by End-User 2025 & 2033
- Figure 30: Asia Pacific Label-free Detection Industry Revenue (Million), by Country 2025 & 2033
- Figure 31: Asia Pacific Label-free Detection Industry Revenue Share (%), by Country 2025 & 2033
- Figure 32: Middle East and Africa Label-free Detection Industry Revenue (Million), by Product 2025 & 2033
- Figure 33: Middle East and Africa Label-free Detection Industry Revenue Share (%), by Product 2025 & 2033
- Figure 34: Middle East and Africa Label-free Detection Industry Revenue (Million), by Technology 2025 & 2033
- Figure 35: Middle East and Africa Label-free Detection Industry Revenue Share (%), by Technology 2025 & 2033
- Figure 36: Middle East and Africa Label-free Detection Industry Revenue (Million), by Application 2025 & 2033
- Figure 37: Middle East and Africa Label-free Detection Industry Revenue Share (%), by Application 2025 & 2033
- Figure 38: Middle East and Africa Label-free Detection Industry Revenue (Million), by End-User 2025 & 2033
- Figure 39: Middle East and Africa Label-free Detection Industry Revenue Share (%), by End-User 2025 & 2033
- Figure 40: Middle East and Africa Label-free Detection Industry Revenue (Million), by Country 2025 & 2033
- Figure 41: Middle East and Africa Label-free Detection Industry Revenue Share (%), by Country 2025 & 2033
- Figure 42: South America Label-free Detection Industry Revenue (Million), by Product 2025 & 2033
- Figure 43: South America Label-free Detection Industry Revenue Share (%), by Product 2025 & 2033
- Figure 44: South America Label-free Detection Industry Revenue (Million), by Technology 2025 & 2033
- Figure 45: South America Label-free Detection Industry Revenue Share (%), by Technology 2025 & 2033
- Figure 46: South America Label-free Detection Industry Revenue (Million), by Application 2025 & 2033
- Figure 47: South America Label-free Detection Industry Revenue Share (%), by Application 2025 & 2033
- Figure 48: South America Label-free Detection Industry Revenue (Million), by End-User 2025 & 2033
- Figure 49: South America Label-free Detection Industry Revenue Share (%), by End-User 2025 & 2033
- Figure 50: South America Label-free Detection Industry Revenue (Million), by Country 2025 & 2033
- Figure 51: South America Label-free Detection Industry Revenue Share (%), by Country 2025 & 2033
List of Tables
- Table 1: Global Label-free Detection Industry Revenue Million Forecast, by Product 2020 & 2033
- Table 2: Global Label-free Detection Industry Revenue Million Forecast, by Technology 2020 & 2033
- Table 3: Global Label-free Detection Industry Revenue Million Forecast, by Application 2020 & 2033
- Table 4: Global Label-free Detection Industry Revenue Million Forecast, by End-User 2020 & 2033
- Table 5: Global Label-free Detection Industry Revenue Million Forecast, by Region 2020 & 2033
- Table 6: Global Label-free Detection Industry Revenue Million Forecast, by Product 2020 & 2033
- Table 7: Global Label-free Detection Industry Revenue Million Forecast, by Technology 2020 & 2033
- Table 8: Global Label-free Detection Industry Revenue Million Forecast, by Application 2020 & 2033
- Table 9: Global Label-free Detection Industry Revenue Million Forecast, by End-User 2020 & 2033
- Table 10: Global Label-free Detection Industry Revenue Million Forecast, by Country 2020 & 2033
- Table 11: United States Label-free Detection Industry Revenue (Million) Forecast, by Application 2020 & 2033
- Table 12: Canada Label-free Detection Industry Revenue (Million) Forecast, by Application 2020 & 2033
- Table 13: Mexico Label-free Detection Industry Revenue (Million) Forecast, by Application 2020 & 2033
- Table 14: Global Label-free Detection Industry Revenue Million Forecast, by Product 2020 & 2033
- Table 15: Global Label-free Detection Industry Revenue Million Forecast, by Technology 2020 & 2033
- Table 16: Global Label-free Detection Industry Revenue Million Forecast, by Application 2020 & 2033
- Table 17: Global Label-free Detection Industry Revenue Million Forecast, by End-User 2020 & 2033
- Table 18: Global Label-free Detection Industry Revenue Million Forecast, by Country 2020 & 2033
- Table 19: Germany Label-free Detection Industry Revenue (Million) Forecast, by Application 2020 & 2033
- Table 20: United Kingdom Label-free Detection Industry Revenue (Million) Forecast, by Application 2020 & 2033
- Table 21: France Label-free Detection Industry Revenue (Million) Forecast, by Application 2020 & 2033
- Table 22: Italy Label-free Detection Industry Revenue (Million) Forecast, by Application 2020 & 2033
- Table 23: Spain Label-free Detection Industry Revenue (Million) Forecast, by Application 2020 & 2033
- Table 24: Rest of Europe Label-free Detection Industry Revenue (Million) Forecast, by Application 2020 & 2033
- Table 25: Global Label-free Detection Industry Revenue Million Forecast, by Product 2020 & 2033
- Table 26: Global Label-free Detection Industry Revenue Million Forecast, by Technology 2020 & 2033
- Table 27: Global Label-free Detection Industry Revenue Million Forecast, by Application 2020 & 2033
- Table 28: Global Label-free Detection Industry Revenue Million Forecast, by End-User 2020 & 2033
- Table 29: Global Label-free Detection Industry Revenue Million Forecast, by Country 2020 & 2033
- Table 30: China Label-free Detection Industry Revenue (Million) Forecast, by Application 2020 & 2033
- Table 31: Japan Label-free Detection Industry Revenue (Million) Forecast, by Application 2020 & 2033
- Table 32: India Label-free Detection Industry Revenue (Million) Forecast, by Application 2020 & 2033
- Table 33: Australia Label-free Detection Industry Revenue (Million) Forecast, by Application 2020 & 2033
- Table 34: South Korea Label-free Detection Industry Revenue (Million) Forecast, by Application 2020 & 2033
- Table 35: Rest of Asia Pacific Label-free Detection Industry Revenue (Million) Forecast, by Application 2020 & 2033
- Table 36: Global Label-free Detection Industry Revenue Million Forecast, by Product 2020 & 2033
- Table 37: Global Label-free Detection Industry Revenue Million Forecast, by Technology 2020 & 2033
- Table 38: Global Label-free Detection Industry Revenue Million Forecast, by Application 2020 & 2033
- Table 39: Global Label-free Detection Industry Revenue Million Forecast, by End-User 2020 & 2033
- Table 40: Global Label-free Detection Industry Revenue Million Forecast, by Country 2020 & 2033
- Table 41: GCC Label-free Detection Industry Revenue (Million) Forecast, by Application 2020 & 2033
- Table 42: South Africa Label-free Detection Industry Revenue (Million) Forecast, by Application 2020 & 2033
- Table 43: Rest of Middle East and Africa Label-free Detection Industry Revenue (Million) Forecast, by Application 2020 & 2033
- Table 44: Global Label-free Detection Industry Revenue Million Forecast, by Product 2020 & 2033
- Table 45: Global Label-free Detection Industry Revenue Million Forecast, by Technology 2020 & 2033
- Table 46: Global Label-free Detection Industry Revenue Million Forecast, by Application 2020 & 2033
- Table 47: Global Label-free Detection Industry Revenue Million Forecast, by End-User 2020 & 2033
- Table 48: Global Label-free Detection Industry Revenue Million Forecast, by Country 2020 & 2033
- Table 49: Brazil Label-free Detection Industry Revenue (Million) Forecast, by Application 2020 & 2033
- Table 50: Argentina Label-free Detection Industry Revenue (Million) Forecast, by Application 2020 & 2033
- Table 51: Rest of South America Label-free Detection Industry Revenue (Million) Forecast, by Application 2020 & 2033
Frequently Asked Questions
1. What is the projected Compound Annual Growth Rate (CAGR) of the Label-free Detection Industry?
The projected CAGR is approximately 11.60%.
2. Which companies are prominent players in the Label-free Detection Industry?
Key companies in the market include Horiba Ltd, Waters, Ametek Inc, Fluidic Analytics, PerkinElmer Inc, Malvern Panalytical, Thermo Fisher Scientific, Corning Incorporated, Cytiva (Danaher Corporation), Shimadzu Corporation.
3. What are the main segments of the Label-free Detection Industry?
The market segments include Product, Technology, Application, End-User.
4. Can you provide details about the market size?
The market size is estimated to be USD 1.72 Million as of 2022.
5. What are some drivers contributing to market growth?
Increasing R&D Activities Through Research Partnerships Between Pharmaceutical Companies and Academic Institutes; Innovations in Label-free Detection Technologies.
6. What are the notable trends driving market growth?
Surface Plasmon Resonance (SPR) Segment is Expected to Hold Largest Share of Global Label-Free Detection (LFD) Market.
7. Are there any restraints impacting market growth?
High Cost of Instruments; Issues in Sensitivty and Throughput.
8. Can you provide examples of recent developments in the market?
August 2022: Bruker Corporation announced the launch of the new nanoElute 2 nano-LC, MetaboScape, and TASQ 2023 software supporting fluxomics and the latest advances in PaSERs intelligent acquisition to enhance research in protein-protein interactions (PPIs) and metaproteomics applications. nanoElute 2 features nano-LC advances that support automated single-cell sample preparation from label-free ProteoCHIP on the CellenONE platform.
9. What pricing options are available for accessing the report?
Pricing options include single-user, multi-user, and enterprise licenses priced at USD 4750, USD 5250, and USD 8750 respectively.
10. Is the market size provided in terms of value or volume?
The market size is provided in terms of value, measured in Million.
11. Are there any specific market keywords associated with the report?
Yes, the market keyword associated with the report is "Label-free Detection Industry," which aids in identifying and referencing the specific market segment covered.
12. How do I determine which pricing option suits my needs best?
The pricing options vary based on user requirements and access needs. Individual users may opt for single-user licenses, while businesses requiring broader access may choose multi-user or enterprise licenses for cost-effective access to the report.
13. Are there any additional resources or data provided in the Label-free Detection Industry report?
While the report offers comprehensive insights, it's advisable to review the specific contents or supplementary materials provided to ascertain if additional resources or data are available.
14. How can I stay updated on further developments or reports in the Label-free Detection Industry?
To stay informed about further developments, trends, and reports in the Label-free Detection Industry, consider subscribing to industry newsletters, following relevant companies and organizations, or regularly checking reputable industry news sources and publications.
Methodology
Step 1 - Identification of Relevant Samples Size from Population Database


Step 2 - Approaches for Defining Global Market Size (Value, Volume* & Price*)

Note*: In applicable scenarios
Step 3 - Data Sources
Primary Research
- Web Analytics
- Survey Reports
- Research Institute
- Latest Research Reports
- Opinion Leaders
Secondary Research
- Annual Reports
- White Paper
- Latest Press Release
- Industry Association
- Paid Database
- Investor Presentations

Step 4 - Data Triangulation
Involves using different sources of information in order to increase the validity of a study
These sources are likely to be stakeholders in a program - participants, other researchers, program staff, other community members, and so on.
Then we put all data in single framework & apply various statistical tools to find out the dynamic on the market.
During the analysis stage, feedback from the stakeholder groups would be compared to determine areas of agreement as well as areas of divergence