

Key Insights
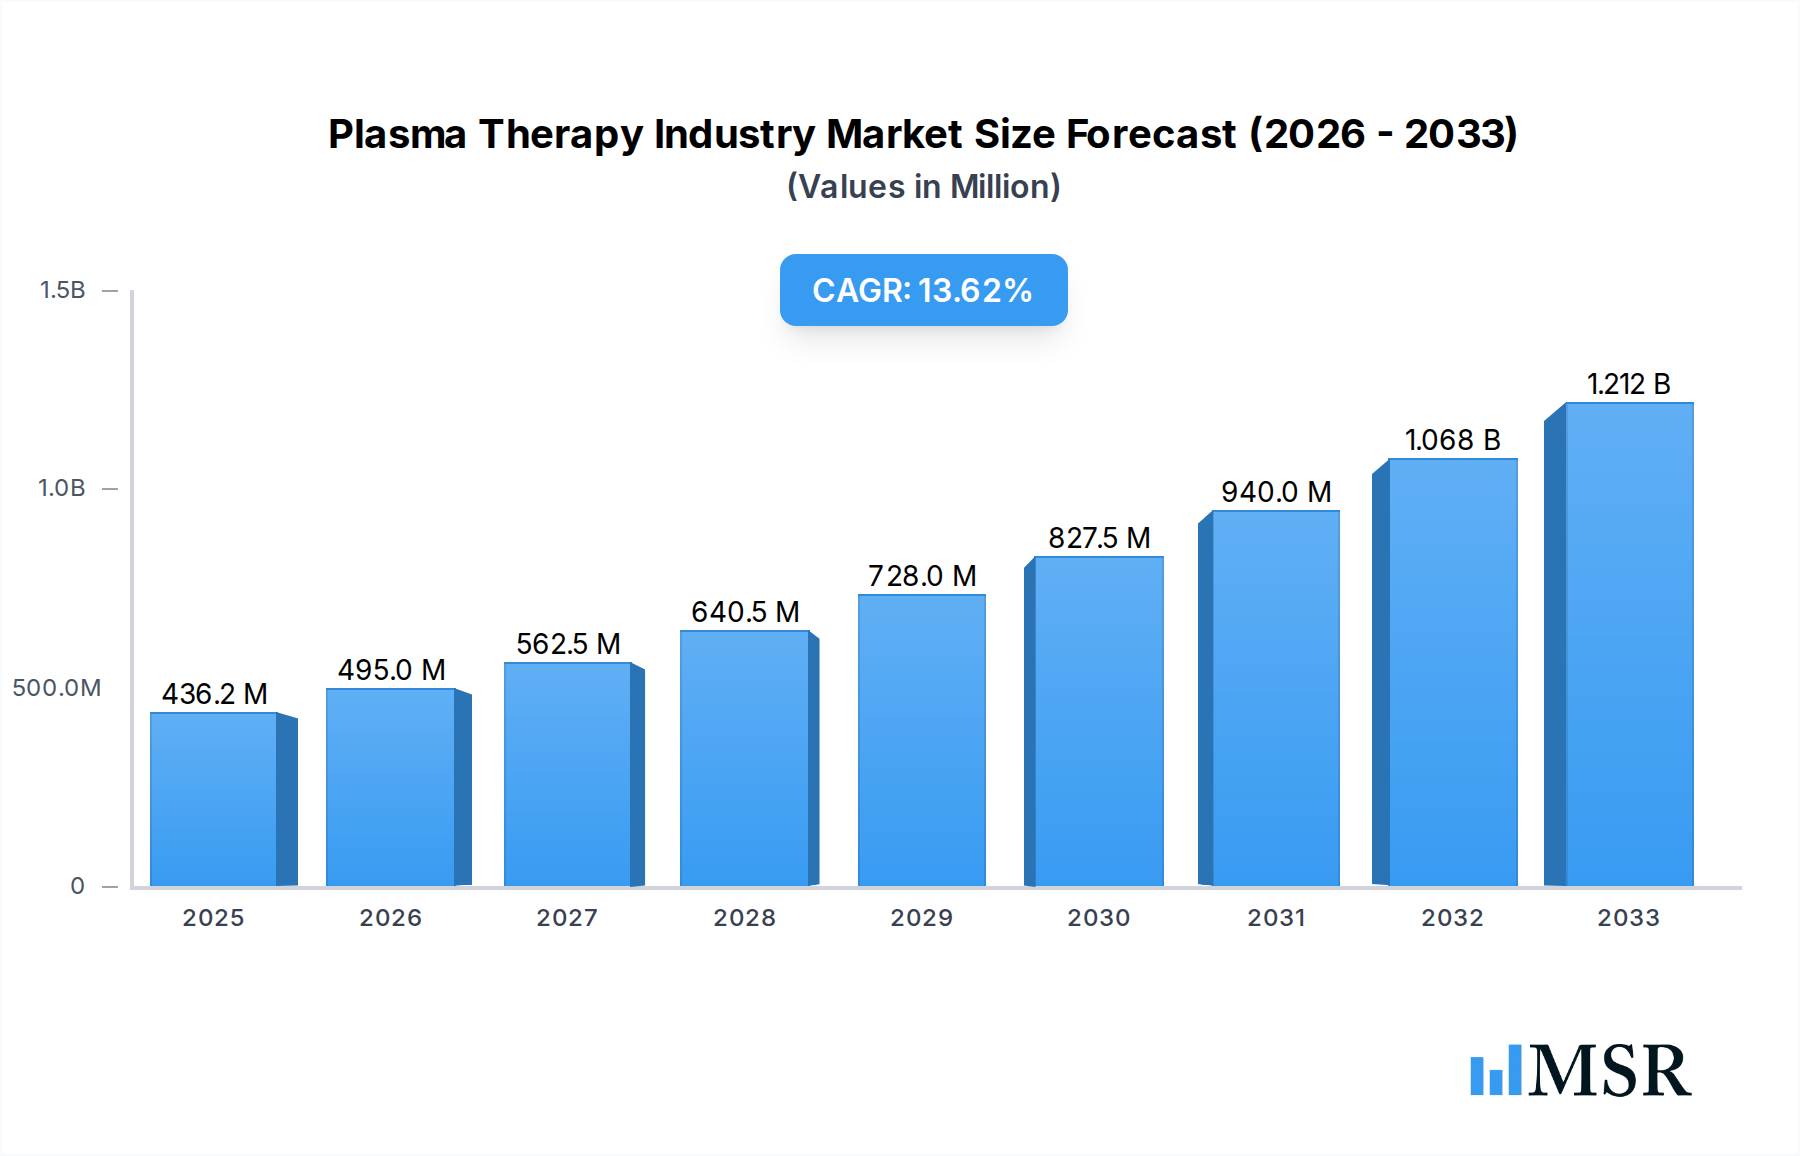
The global Plasma Therapy market is poised for substantial expansion, projected to reach $436.2 million in 2025, with a compelling Compound Annual Growth Rate (CAGR) of 14.2% anticipated from 2025 to 2033. This robust growth is propelled by a confluence of factors, including the increasing prevalence of chronic and autoimmune diseases, a rising global demand for plasma-derived therapeutics, and advancements in fractionation and purification technologies. The growing awareness and diagnosis of conditions like hemophilia, primary immunodeficiencies, and idiopathic thrombocytopenic purpura are directly fueling the demand for plasma-derived products such as immunoglobulins, albumin, and Factor VIII. Furthermore, an aging global population, coupled with a greater emphasis on personalized medicine and improved healthcare infrastructure in emerging economies, is expected to further bolster market penetration and revenue generation. The strategic initiatives undertaken by leading players, including research and development investments, mergers, and acquisitions, are also contributing to the market's dynamic growth trajectory.

Plasma Therapy Industry Market Size (In Million)
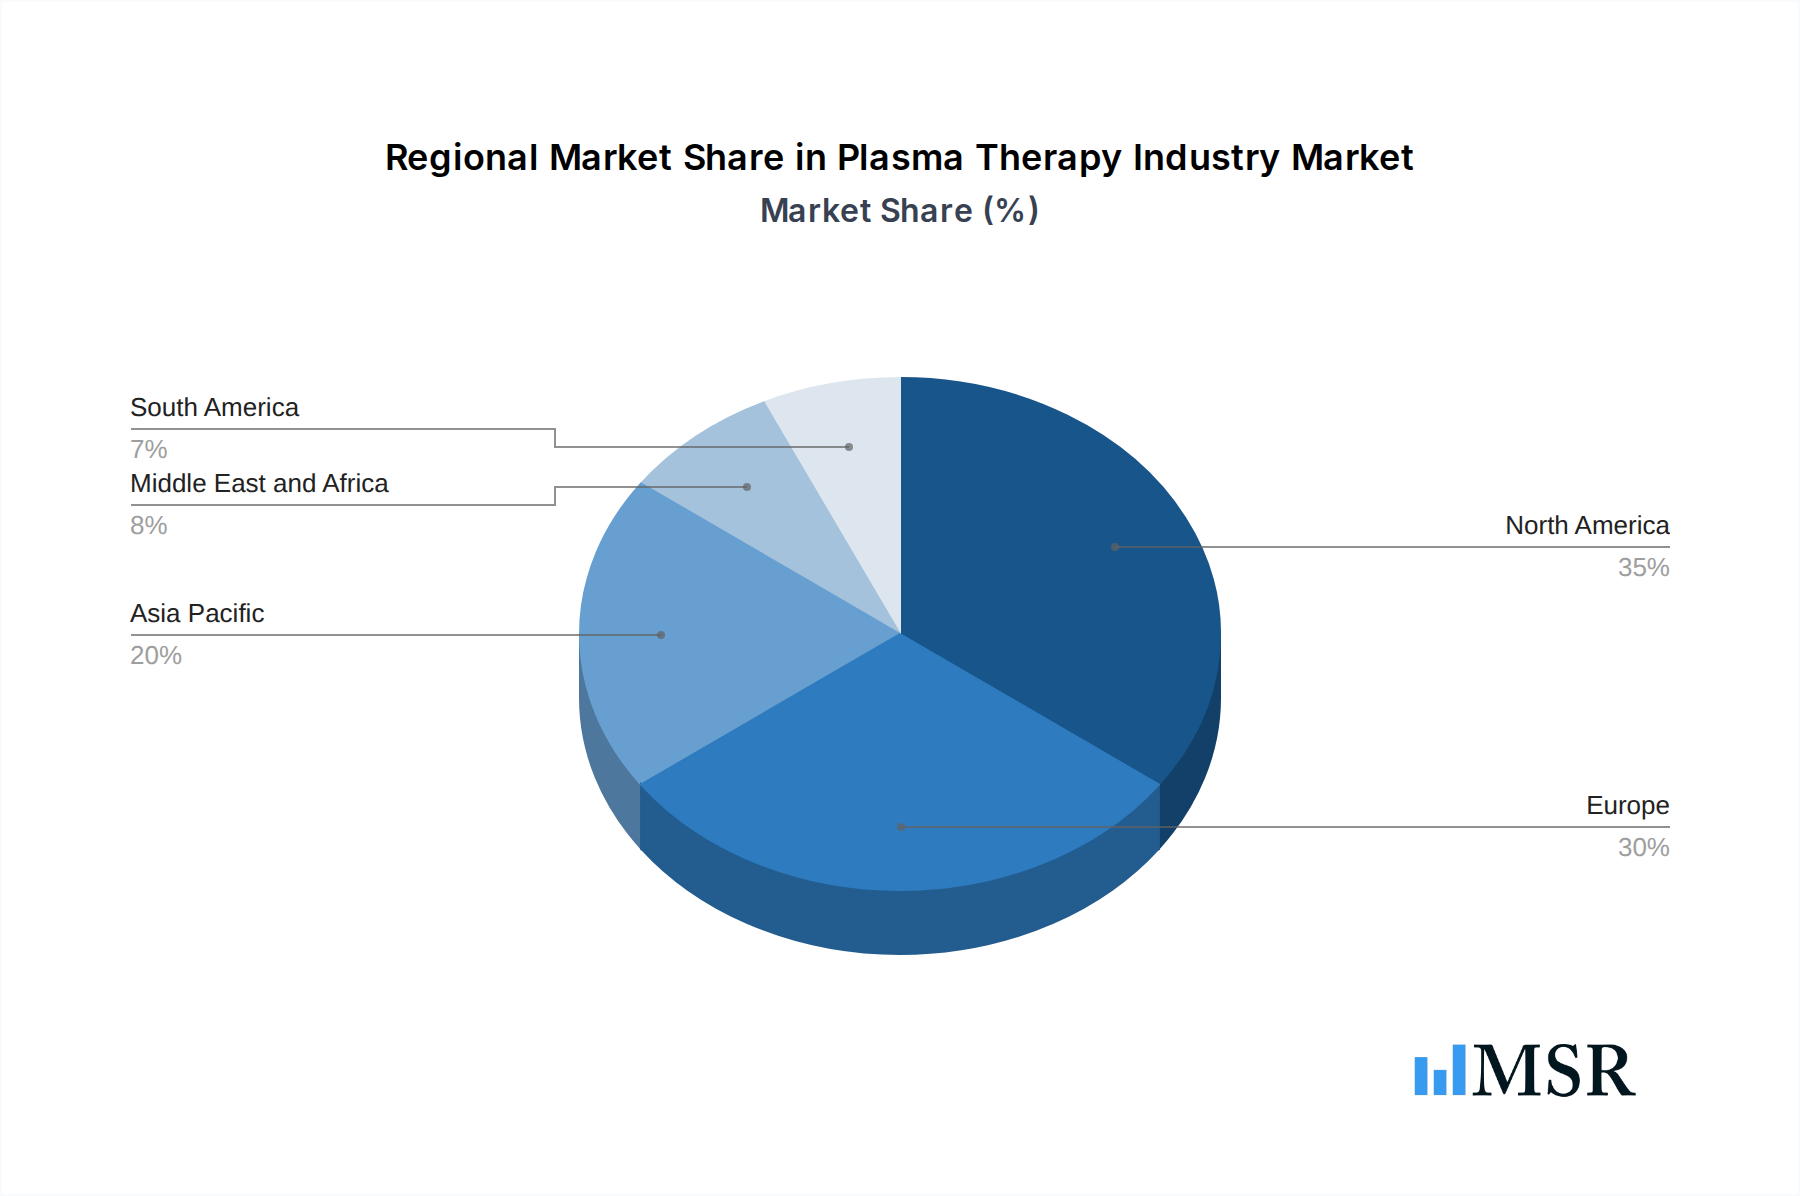
The market's segmentation reveals a diverse landscape. Within product segments, Immunoglobulin is expected to command a significant share, driven by its broad therapeutic applications. Albumin and Plasma Derived Factor VIII are also critical segments, essential for managing specific coagulation disorders and critical care scenarios, respectively. On the application front, Hemophilia remains a primary driver, alongside growing applications in Idiopathic Thrombocytopenic Purpura and Primary Immunodeficiencies. North America currently leads the market due to advanced healthcare systems and high patient awareness, with Europe following closely. The Asia Pacific region, however, presents the most significant growth potential, owing to a large and growing patient pool, increasing healthcare expenditure, and supportive government initiatives aimed at boosting domestic plasma collection and processing capabilities. Restraints such as plasma supply chain complexities and regulatory hurdles are being actively addressed through innovations and strategic collaborations, indicating a resilient and upward market trend.
Plasma Therapy Industry Company Market Share
Unlock the Future of Plasma-Derived Medicines: An In-Depth Analysis of the Global Plasma Therapy Market
This pivotal report offers an exhaustive exploration of the global Plasma Therapy Industry, meticulously analyzing its intricate dynamics from 2019 through 2033. With a base year of 2025 and a forecast period extending to 2033, this comprehensive study delves into market size, growth drivers, emerging trends, and the competitive landscape of plasma-derived therapeutics. Designed for industry stakeholders, investors, and researchers, this report provides actionable insights and strategic foresight to navigate the complexities of this vital sector. The global Plasma Therapy Market is projected to reach $XX million by 2025, exhibiting a robust Compound Annual Growth Rate (CAGR) of XX% during the forecast period.
Plasma Therapy Industry Market Concentration & Dynamics
The Plasma Therapy Industry is characterized by a moderate to high level of market concentration, with a few dominant players controlling a significant portion of the global market share. Key companies such as Grifols S.A., CSL Limited, Takeda Pharmaceutical Company Limited, and Octapharma USA Inc. exhibit substantial influence, driven by their extensive plasma collection networks, advanced manufacturing capabilities, and diversified product portfolios. Innovation ecosystems are robust, fostered by significant R&D investments in novel plasma-derived therapies and improved collection technologies. Regulatory frameworks, primarily governed by agencies like the FDA and EMA, play a crucial role in market access and product approvals, ensuring the safety and efficacy of plasma therapies. The threat of substitute products, while present in some therapeutic areas, is generally low due to the unique therapeutic properties of plasma-derived proteins. End-user trends point towards an increasing demand for specialized therapies for rare diseases and a growing preference for patient-centric delivery models. Merger and acquisition (M&A) activities, with an estimated XX major deals in the historical period and XX projected for the forecast, are strategic tools for market expansion, vertical integration, and acquiring technological expertise. The market share of leading players is estimated to be between XX% and XX%.
Plasma Therapy Industry Industry Insights & Trends
The global Plasma Therapy Industry is poised for substantial growth, fueled by a confluence of compelling market growth drivers, disruptive technological advancements, and evolving consumer behaviors. The increasing prevalence of chronic diseases, autoimmune disorders, and rare genetic conditions worldwide is a primary impetus, escalating the demand for life-saving plasma-derived therapies such as immunoglobulins, albumin, and coagulation factors. Technological disruptions are revolutionizing the industry, from advanced plasma collection systems that enhance donor experience and collection efficiency to sophisticated manufacturing processes that improve product yield and purity. The adoption of novel therapeutic modalities and personalized medicine approaches further amplifies market potential. Evolving consumer behaviors reflect a growing awareness and demand for biologics, with patients and healthcare providers increasingly recognizing the therapeutic benefits of plasma-derived products. Furthermore, supportive government initiatives, reimbursement policies, and expanding healthcare infrastructure in emerging economies are significantly contributing to market penetration and accessibility. The total market size for plasma therapy is estimated at $XX million in 2024, projected to reach $XX million by 2033, with a CAGR of XX% during the forecast period.
Key Markets & Segments Leading Plasma Therapy Industry
The global Plasma Therapy Industry exhibits leadership across key regions and segments, driven by varying economic, demographic, and healthcare landscape factors.
Dominant Regions:
- North America: Continues to be a leading market due to a well-established healthcare infrastructure, high patient awareness, significant R&D investments, and favorable reimbursement policies for plasma-derived therapies. The United States, in particular, boasts a robust plasma collection network and a high incidence of conditions treated by plasma therapies.
- Europe: Represents another significant market, supported by advanced healthcare systems, strong patient advocacy groups, and a growing focus on treating rare diseases. Countries like Germany, France, and the UK are key contributors to market growth.
- Asia Pacific: Demonstrates the fastest growth potential, driven by rising disposable incomes, expanding healthcare access, increasing diagnosis rates, and government initiatives to bolster domestic plasma production capabilities.
Dominant Segments:
Product Segment:
- Immunoglobulin: This segment is the largest and fastest-growing, driven by its widespread use in treating primary immunodeficiencies, neurological disorders, and autoimmune diseases. Increased diagnosis and therapeutic applications are key drivers.
- Albumin: Essential for volume replacement in critically ill patients and surgery, albumin holds a significant market share. Growing demand in critical care settings contributes to its dominance.
- Plasma Derived Factor VIII: Crucial for the treatment of Hemophilia A, this segment is vital, with consistent demand and ongoing advancements in therapy.
- Other Products: Includes a range of specialized plasma proteins like alpha-1 antitrypsin, antithrombin, and clotting factors, catering to niche therapeutic needs.
Application Segment:
- Primary Immunodeficiencies (PIDs): This application consistently drives demand for immunoglobulins, as PIDs require lifelong replacement therapy.
- Hemophilia: A major application, particularly for Factor VIII and Factor IX, where plasma-derived therapies are foundational treatments.
- Idiopathic Thrombocytopenic Purpura (ITP): A significant application for immunoglobulins, contributing to market growth.
- Other Applications: Encompasses a broad spectrum of uses, including neurological disorders, autoimmune diseases, liver diseases, and critical care, collectively contributing substantially to market volume.
The dominance in these segments is reinforced by factors such as the availability of advanced diagnostic tools, increasing patient advocacy, and continuous innovation in therapeutic formulations and delivery methods. Economic growth in emerging markets further fuels demand, while robust regulatory approvals facilitate market entry and expansion.
Plasma Therapy Industry Product Developments
Product development in the Plasma Therapy Industry is primarily focused on enhancing the efficacy, safety, and convenience of existing plasma-derived proteins and exploring novel therapeutic applications. Innovations in fractionation and purification technologies are leading to higher-purity products with reduced immunogenicity. Advancements in formulation and delivery systems, such as subcutaneous immunoglobulin (SCIG) options, are improving patient convenience and compliance. Furthermore, research into the therapeutic potential of plasma-derived proteins for new indications, including infectious diseases and rare genetic disorders, is a key area of focus. The continuous pursuit of optimized manufacturing processes to increase yields and reduce production costs remains paramount.
Challenges in the Plasma Therapy Industry Market
The Plasma Therapy Industry faces several significant challenges that can impact growth and market dynamics. Regulatory hurdles, including stringent approval processes and evolving compliance standards, can lead to lengthy development timelines and increased costs. Supply chain vulnerabilities, particularly concerning the consistent and ethical sourcing of human plasma, pose a continuous concern, exacerbated by factors like donor fatigue and geopolitical instability. Intense competition among established players and emerging biopharmaceutical companies necessitates continuous innovation and cost management. Furthermore, the high cost of plasma-derived therapies can limit patient access in certain markets, creating affordability challenges. The risk of contamination and the need for rigorous quality control also add to operational complexities and expenses.
Forces Driving Plasma Therapy Industry Growth
Several key forces are propelling the growth of the Plasma Therapy Industry. The escalating global burden of rare diseases and chronic conditions, such as hemophilia, primary immunodeficiencies, and autoimmune disorders, creates a sustained demand for life-saving plasma-derived therapies. Technological advancements in plasma fractionation, purification, and manufacturing processes are leading to more effective and safer therapeutic products. Supportive government policies, including favorable reimbursement schemes and initiatives to increase plasma collection, are crucial growth enablers. The growing awareness among healthcare professionals and patients regarding the benefits of plasma-derived medicines, coupled with expanding healthcare infrastructure in emerging economies, further fuels market expansion.
Challenges in the Plasma Therapy Industry Market
While the Plasma Therapy Industry is experiencing robust growth, long-term expansion is contingent on addressing specific strategic challenges. Maintaining a stable and sufficient supply of high-quality plasma remains a critical concern, requiring continuous efforts in donor recruitment and retention. The high cost of plasma-derived therapies presents an ongoing barrier to access, necessitating innovative pricing models and value-based healthcare solutions. Navigating complex and evolving international regulatory landscapes can hinder market penetration and product launches. Furthermore, the industry must continually invest in research and development to stay ahead of emerging therapeutic alternatives and to discover new applications for plasma-derived proteins, ensuring sustained relevance and competitive advantage.
Emerging Opportunities in Plasma Therapy Industry
The Plasma Therapy Industry is ripe with emerging opportunities driven by ongoing innovation and evolving market needs. The untapped potential of plasma-derived proteins in treating a wider range of autoimmune and inflammatory conditions presents a significant avenue for growth. Advancements in recombinant protein technology and gene therapy, while potential substitutes, also drive innovation in the plasma sector, pushing for greater efficiency and specialized therapies. Expansion into emerging markets with increasing healthcare expenditure and diagnosed patient populations offers substantial market penetration opportunities. Furthermore, the development of novel drug delivery systems that enhance patient convenience and compliance, such as subcutaneous or self-administered therapies, represents a key area for future development and market differentiation.
Leading Players in the Plasma Therapy Industry Sector
- Arthrex Inc
- Octapharma USA Inc
- Baxter
- Bio Products Laboratory Ltd
- Takeda Pharmaceutical Company Limited
- CSL Limited
- ADMA Biologics Inc
- Taibang Biological Group Co Ltd
- Grifols S A
- Johnson and Johnson (DePuy Synthes)
- Biotest UK
- Kedrion S p A
Key Milestones in Plasma Therapy Industry Industry
- October 2022: Grifols inaugurated its new state-of-the-art manufacturing plant in Ireland to meet the growing global demand for plasma medicines. Grifols' Dublin manufacturing facility triples the annual filling capacity of its innovative, flexible container, ALBUTEIN FlexBag, to meet the rising demand for albumin, the most abundant plasma protein. This expansion significantly enhances Grifols' capacity to serve the global market for albumin, a critical therapeutic protein.
- March 2022: Food and Drug Administration (FDA) cleared the new plasma collection system, Rika Plasma Donation System (Rika), developed by Terumo Blood and Cell Technologies (Terumo BCT), a medical technology company. Rika is a next-generation automated technology focused on the experience of plasma center employees and donors. This clearance marks a significant technological advancement in plasma collection, aiming to improve efficiency and donor comfort.
Strategic Outlook for Plasma Therapy Industry Market
The strategic outlook for the Plasma Therapy Industry remains exceptionally positive, driven by a sustained increase in demand for its essential therapeutic proteins and continuous innovation. Future growth accelerators will stem from expanded indications for existing therapies, the development of novel plasma-derived products for unmet medical needs, and strategic geographical expansions into high-growth emerging markets. Investments in advanced plasma collection technologies and manufacturing efficiencies will be crucial for maintaining competitiveness and managing costs. Partnerships and collaborations between plasma fractionation companies, biotechnology firms, and research institutions will foster a dynamic environment for pioneering new treatments and enhancing patient care, solidifying the industry's critical role in global healthcare.
Plasma Therapy Industry Segmentation
-
1. Product
- 1.1. Immunoglobulin
- 1.2. Albumin
- 1.3. Plasma Derived Factor VIII
- 1.4. Other Products
-
2. Application
- 2.1. Hemophilia
- 2.2. Idiopathic Thrombocytopenic Purpura
- 2.3. Primary Immunodeficiencies
- 2.4. Other Applications
Plasma Therapy Industry Segmentation By Geography
-
1. North America
- 1.1. United States
- 1.2. Canada
- 1.3. Mexico
-
2. Europe
- 2.1. Germany
- 2.2. United Kingdom
- 2.3. France
- 2.4. Italy
- 2.5. Spain
- 2.6. Rest of Europe
-
3. Asia Pacific
- 3.1. China
- 3.2. Japan
- 3.3. India
- 3.4. Australia
- 3.5. South Korea
- 3.6. Rest of Asia Pacific
-
4. Middle East and Africa
- 4.1. GCC
- 4.2. South Africa
- 4.3. Rest of Middle East and Africa
-
5. South America
- 5.1. Brazil
- 5.2. Argentina
- 5.3. Rest of South America
Plasma Therapy Industry Regional Market Share
Geographic Coverage of Plasma Therapy Industry
Plasma Therapy Industry REPORT HIGHLIGHTS
| Aspects | Details |
|---|---|
| Study Period | 2020-2034 |
| Base Year | 2025 |
| Estimated Year | 2026 |
| Forecast Period | 2026-2034 |
| Historical Period | 2020-2025 |
| Growth Rate | CAGR of 14.2% from 2020-2034 |
| Segmentation |
|
Table of Contents
- 1. Introduction
- 1.1. Research Scope
- 1.2. Market Segmentation
- 1.3. Research Objective
- 1.4. Definitions and Assumptions
- 2. Executive Summary
- 2.1. Market Snapshot
- 3. Market Dynamics
- 3.1. Market Drivers
- 3.2. Market Restrains
- 3.3. Market Trends
- 3.4. Market Opportunities
- 4. Market Factor Analysis
- 4.1. Porters Five Forces
- 4.1.1. Bargaining Power of Suppliers
- 4.1.2. Bargaining Power of Buyers
- 4.1.3. Threat of New Entrants
- 4.1.4. Threat of Substitutes
- 4.1.5. Competitive Rivalry
- 4.2. PESTEL analysis
- 4.3. BCG Analysis
- 4.3.1. Stars (High Growth, High Market Share)
- 4.3.2. Cash Cows (Low Growth, High Market Share)
- 4.3.3. Question Mark (High Growth, Low Market Share)
- 4.3.4. Dogs (Low Growth, Low Market Share)
- 4.4. Ansoff Matrix Analysis
- 4.5. Supply Chain Analysis
- 4.6. Regulatory Landscape
- 4.7. Current Market Potential and Opportunity Assessment (TAM–SAM–SOM Framework)
- 4.8. MSR Analyst Note
- 4.1. Porters Five Forces
- 5. Market Analysis, Insights and Forecast 2021-2033
- 5.1. Market Analysis, Insights and Forecast - by Product
- 5.1.1. Immunoglobulin
- 5.1.2. Albumin
- 5.1.3. Plasma Derived Factor VIII
- 5.1.4. Other Products
- 5.2. Market Analysis, Insights and Forecast - by Application
- 5.2.1. Hemophilia
- 5.2.2. Idiopathic Thrombocytopenic Purpura
- 5.2.3. Primary Immunodeficiencies
- 5.2.4. Other Applications
- 5.3. Market Analysis, Insights and Forecast - by Region
- 5.3.1. North America
- 5.3.2. Europe
- 5.3.3. Asia Pacific
- 5.3.4. Middle East and Africa
- 5.3.5. South America
- 5.1. Market Analysis, Insights and Forecast - by Product
- 6. Global Plasma Therapy Industry Analysis, Insights and Forecast, 2021-2033
- 6.1. Market Analysis, Insights and Forecast - by Product
- 6.1.1. Immunoglobulin
- 6.1.2. Albumin
- 6.1.3. Plasma Derived Factor VIII
- 6.1.4. Other Products
- 6.2. Market Analysis, Insights and Forecast - by Application
- 6.2.1. Hemophilia
- 6.2.2. Idiopathic Thrombocytopenic Purpura
- 6.2.3. Primary Immunodeficiencies
- 6.2.4. Other Applications
- 6.1. Market Analysis, Insights and Forecast - by Product
- 7. North America Plasma Therapy Industry Analysis, Insights and Forecast, 2020-2032
- 7.1. Market Analysis, Insights and Forecast - by Product
- 7.1.1. Immunoglobulin
- 7.1.2. Albumin
- 7.1.3. Plasma Derived Factor VIII
- 7.1.4. Other Products
- 7.2. Market Analysis, Insights and Forecast - by Application
- 7.2.1. Hemophilia
- 7.2.2. Idiopathic Thrombocytopenic Purpura
- 7.2.3. Primary Immunodeficiencies
- 7.2.4. Other Applications
- 7.1. Market Analysis, Insights and Forecast - by Product
- 8. Europe Plasma Therapy Industry Analysis, Insights and Forecast, 2020-2032
- 8.1. Market Analysis, Insights and Forecast - by Product
- 8.1.1. Immunoglobulin
- 8.1.2. Albumin
- 8.1.3. Plasma Derived Factor VIII
- 8.1.4. Other Products
- 8.2. Market Analysis, Insights and Forecast - by Application
- 8.2.1. Hemophilia
- 8.2.2. Idiopathic Thrombocytopenic Purpura
- 8.2.3. Primary Immunodeficiencies
- 8.2.4. Other Applications
- 8.1. Market Analysis, Insights and Forecast - by Product
- 9. Asia Pacific Plasma Therapy Industry Analysis, Insights and Forecast, 2020-2032
- 9.1. Market Analysis, Insights and Forecast - by Product
- 9.1.1. Immunoglobulin
- 9.1.2. Albumin
- 9.1.3. Plasma Derived Factor VIII
- 9.1.4. Other Products
- 9.2. Market Analysis, Insights and Forecast - by Application
- 9.2.1. Hemophilia
- 9.2.2. Idiopathic Thrombocytopenic Purpura
- 9.2.3. Primary Immunodeficiencies
- 9.2.4. Other Applications
- 9.1. Market Analysis, Insights and Forecast - by Product
- 10. Middle East and Africa Plasma Therapy Industry Analysis, Insights and Forecast, 2020-2032
- 10.1. Market Analysis, Insights and Forecast - by Product
- 10.1.1. Immunoglobulin
- 10.1.2. Albumin
- 10.1.3. Plasma Derived Factor VIII
- 10.1.4. Other Products
- 10.2. Market Analysis, Insights and Forecast - by Application
- 10.2.1. Hemophilia
- 10.2.2. Idiopathic Thrombocytopenic Purpura
- 10.2.3. Primary Immunodeficiencies
- 10.2.4. Other Applications
- 10.1. Market Analysis, Insights and Forecast - by Product
- 11. South America Plasma Therapy Industry Analysis, Insights and Forecast, 2020-2032
- 11.1. Market Analysis, Insights and Forecast - by Product
- 11.1.1. Immunoglobulin
- 11.1.2. Albumin
- 11.1.3. Plasma Derived Factor VIII
- 11.1.4. Other Products
- 11.2. Market Analysis, Insights and Forecast - by Application
- 11.2.1. Hemophilia
- 11.2.2. Idiopathic Thrombocytopenic Purpura
- 11.2.3. Primary Immunodeficiencies
- 11.2.4. Other Applications
- 11.1. Market Analysis, Insights and Forecast - by Product
- 12. Competitive Analysis
- 12.1. Company Profiles
- 12.1.1 Arthrex Inc
- 12.1.1.1. Company Overview
- 12.1.1.2. Products
- 12.1.1.3. Company Financials
- 12.1.1.4. SWOT Analysis
- 12.1.2 Octapharma USA Inc
- 12.1.2.1. Company Overview
- 12.1.2.2. Products
- 12.1.2.3. Company Financials
- 12.1.2.4. SWOT Analysis
- 12.1.3 Baxter
- 12.1.3.1. Company Overview
- 12.1.3.2. Products
- 12.1.3.3. Company Financials
- 12.1.3.4. SWOT Analysis
- 12.1.4 Bio Products Laboratory Ltd
- 12.1.4.1. Company Overview
- 12.1.4.2. Products
- 12.1.4.3. Company Financials
- 12.1.4.4. SWOT Analysis
- 12.1.5 Takeda Pharmaceutical Company Limited
- 12.1.5.1. Company Overview
- 12.1.5.2. Products
- 12.1.5.3. Company Financials
- 12.1.5.4. SWOT Analysis
- 12.1.6 CSL Limited
- 12.1.6.1. Company Overview
- 12.1.6.2. Products
- 12.1.6.3. Company Financials
- 12.1.6.4. SWOT Analysis
- 12.1.7 ADMA Biologics Inc
- 12.1.7.1. Company Overview
- 12.1.7.2. Products
- 12.1.7.3. Company Financials
- 12.1.7.4. SWOT Analysis
- 12.1.8 Taibang Biological Group Co Ltd
- 12.1.8.1. Company Overview
- 12.1.8.2. Products
- 12.1.8.3. Company Financials
- 12.1.8.4. SWOT Analysis
- 12.1.9 Grifols S A
- 12.1.9.1. Company Overview
- 12.1.9.2. Products
- 12.1.9.3. Company Financials
- 12.1.9.4. SWOT Analysis
- 12.1.10 Johnson and Johnson (DePuy Synthes)
- 12.1.10.1. Company Overview
- 12.1.10.2. Products
- 12.1.10.3. Company Financials
- 12.1.10.4. SWOT Analysis
- 12.1.11 Biotest UK
- 12.1.11.1. Company Overview
- 12.1.11.2. Products
- 12.1.11.3. Company Financials
- 12.1.11.4. SWOT Analysis
- 12.1.12 Kedrion S p A
- 12.1.12.1. Company Overview
- 12.1.12.2. Products
- 12.1.12.3. Company Financials
- 12.1.12.4. SWOT Analysis
- 12.1.1 Arthrex Inc
- 12.2. Market Entropy
- 12.2.1 Company's Key Areas Served
- 12.2.2 Recent Developments
- 12.3. Company Market Share Analysis 2025
- 12.3.1 Top 5 Companies Market Share Analysis
- 12.3.2 Top 3 Companies Market Share Analysis
- 12.4. List of Potential Customers
- 13. Research Methodology
List of Figures
- Figure 1: Global Plasma Therapy Industry Revenue Breakdown (million, %) by Region 2025 & 2033
- Figure 2: Global Plasma Therapy Industry Volume Breakdown (K Unit, %) by Region 2025 & 2033
- Figure 3: North America Plasma Therapy Industry Revenue (million), by Product 2025 & 2033
- Figure 4: North America Plasma Therapy Industry Volume (K Unit), by Product 2025 & 2033
- Figure 5: North America Plasma Therapy Industry Revenue Share (%), by Product 2025 & 2033
- Figure 6: North America Plasma Therapy Industry Volume Share (%), by Product 2025 & 2033
- Figure 7: North America Plasma Therapy Industry Revenue (million), by Application 2025 & 2033
- Figure 8: North America Plasma Therapy Industry Volume (K Unit), by Application 2025 & 2033
- Figure 9: North America Plasma Therapy Industry Revenue Share (%), by Application 2025 & 2033
- Figure 10: North America Plasma Therapy Industry Volume Share (%), by Application 2025 & 2033
- Figure 11: North America Plasma Therapy Industry Revenue (million), by Country 2025 & 2033
- Figure 12: North America Plasma Therapy Industry Volume (K Unit), by Country 2025 & 2033
- Figure 13: North America Plasma Therapy Industry Revenue Share (%), by Country 2025 & 2033
- Figure 14: North America Plasma Therapy Industry Volume Share (%), by Country 2025 & 2033
- Figure 15: Europe Plasma Therapy Industry Revenue (million), by Product 2025 & 2033
- Figure 16: Europe Plasma Therapy Industry Volume (K Unit), by Product 2025 & 2033
- Figure 17: Europe Plasma Therapy Industry Revenue Share (%), by Product 2025 & 2033
- Figure 18: Europe Plasma Therapy Industry Volume Share (%), by Product 2025 & 2033
- Figure 19: Europe Plasma Therapy Industry Revenue (million), by Application 2025 & 2033
- Figure 20: Europe Plasma Therapy Industry Volume (K Unit), by Application 2025 & 2033
- Figure 21: Europe Plasma Therapy Industry Revenue Share (%), by Application 2025 & 2033
- Figure 22: Europe Plasma Therapy Industry Volume Share (%), by Application 2025 & 2033
- Figure 23: Europe Plasma Therapy Industry Revenue (million), by Country 2025 & 2033
- Figure 24: Europe Plasma Therapy Industry Volume (K Unit), by Country 2025 & 2033
- Figure 25: Europe Plasma Therapy Industry Revenue Share (%), by Country 2025 & 2033
- Figure 26: Europe Plasma Therapy Industry Volume Share (%), by Country 2025 & 2033
- Figure 27: Asia Pacific Plasma Therapy Industry Revenue (million), by Product 2025 & 2033
- Figure 28: Asia Pacific Plasma Therapy Industry Volume (K Unit), by Product 2025 & 2033
- Figure 29: Asia Pacific Plasma Therapy Industry Revenue Share (%), by Product 2025 & 2033
- Figure 30: Asia Pacific Plasma Therapy Industry Volume Share (%), by Product 2025 & 2033
- Figure 31: Asia Pacific Plasma Therapy Industry Revenue (million), by Application 2025 & 2033
- Figure 32: Asia Pacific Plasma Therapy Industry Volume (K Unit), by Application 2025 & 2033
- Figure 33: Asia Pacific Plasma Therapy Industry Revenue Share (%), by Application 2025 & 2033
- Figure 34: Asia Pacific Plasma Therapy Industry Volume Share (%), by Application 2025 & 2033
- Figure 35: Asia Pacific Plasma Therapy Industry Revenue (million), by Country 2025 & 2033
- Figure 36: Asia Pacific Plasma Therapy Industry Volume (K Unit), by Country 2025 & 2033
- Figure 37: Asia Pacific Plasma Therapy Industry Revenue Share (%), by Country 2025 & 2033
- Figure 38: Asia Pacific Plasma Therapy Industry Volume Share (%), by Country 2025 & 2033
- Figure 39: Middle East and Africa Plasma Therapy Industry Revenue (million), by Product 2025 & 2033
- Figure 40: Middle East and Africa Plasma Therapy Industry Volume (K Unit), by Product 2025 & 2033
- Figure 41: Middle East and Africa Plasma Therapy Industry Revenue Share (%), by Product 2025 & 2033
- Figure 42: Middle East and Africa Plasma Therapy Industry Volume Share (%), by Product 2025 & 2033
- Figure 43: Middle East and Africa Plasma Therapy Industry Revenue (million), by Application 2025 & 2033
- Figure 44: Middle East and Africa Plasma Therapy Industry Volume (K Unit), by Application 2025 & 2033
- Figure 45: Middle East and Africa Plasma Therapy Industry Revenue Share (%), by Application 2025 & 2033
- Figure 46: Middle East and Africa Plasma Therapy Industry Volume Share (%), by Application 2025 & 2033
- Figure 47: Middle East and Africa Plasma Therapy Industry Revenue (million), by Country 2025 & 2033
- Figure 48: Middle East and Africa Plasma Therapy Industry Volume (K Unit), by Country 2025 & 2033
- Figure 49: Middle East and Africa Plasma Therapy Industry Revenue Share (%), by Country 2025 & 2033
- Figure 50: Middle East and Africa Plasma Therapy Industry Volume Share (%), by Country 2025 & 2033
- Figure 51: South America Plasma Therapy Industry Revenue (million), by Product 2025 & 2033
- Figure 52: South America Plasma Therapy Industry Volume (K Unit), by Product 2025 & 2033
- Figure 53: South America Plasma Therapy Industry Revenue Share (%), by Product 2025 & 2033
- Figure 54: South America Plasma Therapy Industry Volume Share (%), by Product 2025 & 2033
- Figure 55: South America Plasma Therapy Industry Revenue (million), by Application 2025 & 2033
- Figure 56: South America Plasma Therapy Industry Volume (K Unit), by Application 2025 & 2033
- Figure 57: South America Plasma Therapy Industry Revenue Share (%), by Application 2025 & 2033
- Figure 58: South America Plasma Therapy Industry Volume Share (%), by Application 2025 & 2033
- Figure 59: South America Plasma Therapy Industry Revenue (million), by Country 2025 & 2033
- Figure 60: South America Plasma Therapy Industry Volume (K Unit), by Country 2025 & 2033
- Figure 61: South America Plasma Therapy Industry Revenue Share (%), by Country 2025 & 2033
- Figure 62: South America Plasma Therapy Industry Volume Share (%), by Country 2025 & 2033
List of Tables
- Table 1: Global Plasma Therapy Industry Revenue million Forecast, by Product 2020 & 2033
- Table 2: Global Plasma Therapy Industry Volume K Unit Forecast, by Product 2020 & 2033
- Table 3: Global Plasma Therapy Industry Revenue million Forecast, by Application 2020 & 2033
- Table 4: Global Plasma Therapy Industry Volume K Unit Forecast, by Application 2020 & 2033
- Table 5: Global Plasma Therapy Industry Revenue million Forecast, by Region 2020 & 2033
- Table 6: Global Plasma Therapy Industry Volume K Unit Forecast, by Region 2020 & 2033
- Table 7: Global Plasma Therapy Industry Revenue million Forecast, by Product 2020 & 2033
- Table 8: Global Plasma Therapy Industry Volume K Unit Forecast, by Product 2020 & 2033
- Table 9: Global Plasma Therapy Industry Revenue million Forecast, by Application 2020 & 2033
- Table 10: Global Plasma Therapy Industry Volume K Unit Forecast, by Application 2020 & 2033
- Table 11: Global Plasma Therapy Industry Revenue million Forecast, by Country 2020 & 2033
- Table 12: Global Plasma Therapy Industry Volume K Unit Forecast, by Country 2020 & 2033
- Table 13: United States Plasma Therapy Industry Revenue (million) Forecast, by Application 2020 & 2033
- Table 14: United States Plasma Therapy Industry Volume (K Unit) Forecast, by Application 2020 & 2033
- Table 15: Canada Plasma Therapy Industry Revenue (million) Forecast, by Application 2020 & 2033
- Table 16: Canada Plasma Therapy Industry Volume (K Unit) Forecast, by Application 2020 & 2033
- Table 17: Mexico Plasma Therapy Industry Revenue (million) Forecast, by Application 2020 & 2033
- Table 18: Mexico Plasma Therapy Industry Volume (K Unit) Forecast, by Application 2020 & 2033
- Table 19: Global Plasma Therapy Industry Revenue million Forecast, by Product 2020 & 2033
- Table 20: Global Plasma Therapy Industry Volume K Unit Forecast, by Product 2020 & 2033
- Table 21: Global Plasma Therapy Industry Revenue million Forecast, by Application 2020 & 2033
- Table 22: Global Plasma Therapy Industry Volume K Unit Forecast, by Application 2020 & 2033
- Table 23: Global Plasma Therapy Industry Revenue million Forecast, by Country 2020 & 2033
- Table 24: Global Plasma Therapy Industry Volume K Unit Forecast, by Country 2020 & 2033
- Table 25: Germany Plasma Therapy Industry Revenue (million) Forecast, by Application 2020 & 2033
- Table 26: Germany Plasma Therapy Industry Volume (K Unit) Forecast, by Application 2020 & 2033
- Table 27: United Kingdom Plasma Therapy Industry Revenue (million) Forecast, by Application 2020 & 2033
- Table 28: United Kingdom Plasma Therapy Industry Volume (K Unit) Forecast, by Application 2020 & 2033
- Table 29: France Plasma Therapy Industry Revenue (million) Forecast, by Application 2020 & 2033
- Table 30: France Plasma Therapy Industry Volume (K Unit) Forecast, by Application 2020 & 2033
- Table 31: Italy Plasma Therapy Industry Revenue (million) Forecast, by Application 2020 & 2033
- Table 32: Italy Plasma Therapy Industry Volume (K Unit) Forecast, by Application 2020 & 2033
- Table 33: Spain Plasma Therapy Industry Revenue (million) Forecast, by Application 2020 & 2033
- Table 34: Spain Plasma Therapy Industry Volume (K Unit) Forecast, by Application 2020 & 2033
- Table 35: Rest of Europe Plasma Therapy Industry Revenue (million) Forecast, by Application 2020 & 2033
- Table 36: Rest of Europe Plasma Therapy Industry Volume (K Unit) Forecast, by Application 2020 & 2033
- Table 37: Global Plasma Therapy Industry Revenue million Forecast, by Product 2020 & 2033
- Table 38: Global Plasma Therapy Industry Volume K Unit Forecast, by Product 2020 & 2033
- Table 39: Global Plasma Therapy Industry Revenue million Forecast, by Application 2020 & 2033
- Table 40: Global Plasma Therapy Industry Volume K Unit Forecast, by Application 2020 & 2033
- Table 41: Global Plasma Therapy Industry Revenue million Forecast, by Country 2020 & 2033
- Table 42: Global Plasma Therapy Industry Volume K Unit Forecast, by Country 2020 & 2033
- Table 43: China Plasma Therapy Industry Revenue (million) Forecast, by Application 2020 & 2033
- Table 44: China Plasma Therapy Industry Volume (K Unit) Forecast, by Application 2020 & 2033
- Table 45: Japan Plasma Therapy Industry Revenue (million) Forecast, by Application 2020 & 2033
- Table 46: Japan Plasma Therapy Industry Volume (K Unit) Forecast, by Application 2020 & 2033
- Table 47: India Plasma Therapy Industry Revenue (million) Forecast, by Application 2020 & 2033
- Table 48: India Plasma Therapy Industry Volume (K Unit) Forecast, by Application 2020 & 2033
- Table 49: Australia Plasma Therapy Industry Revenue (million) Forecast, by Application 2020 & 2033
- Table 50: Australia Plasma Therapy Industry Volume (K Unit) Forecast, by Application 2020 & 2033
- Table 51: South Korea Plasma Therapy Industry Revenue (million) Forecast, by Application 2020 & 2033
- Table 52: South Korea Plasma Therapy Industry Volume (K Unit) Forecast, by Application 2020 & 2033
- Table 53: Rest of Asia Pacific Plasma Therapy Industry Revenue (million) Forecast, by Application 2020 & 2033
- Table 54: Rest of Asia Pacific Plasma Therapy Industry Volume (K Unit) Forecast, by Application 2020 & 2033
- Table 55: Global Plasma Therapy Industry Revenue million Forecast, by Product 2020 & 2033
- Table 56: Global Plasma Therapy Industry Volume K Unit Forecast, by Product 2020 & 2033
- Table 57: Global Plasma Therapy Industry Revenue million Forecast, by Application 2020 & 2033
- Table 58: Global Plasma Therapy Industry Volume K Unit Forecast, by Application 2020 & 2033
- Table 59: Global Plasma Therapy Industry Revenue million Forecast, by Country 2020 & 2033
- Table 60: Global Plasma Therapy Industry Volume K Unit Forecast, by Country 2020 & 2033
- Table 61: GCC Plasma Therapy Industry Revenue (million) Forecast, by Application 2020 & 2033
- Table 62: GCC Plasma Therapy Industry Volume (K Unit) Forecast, by Application 2020 & 2033
- Table 63: South Africa Plasma Therapy Industry Revenue (million) Forecast, by Application 2020 & 2033
- Table 64: South Africa Plasma Therapy Industry Volume (K Unit) Forecast, by Application 2020 & 2033
- Table 65: Rest of Middle East and Africa Plasma Therapy Industry Revenue (million) Forecast, by Application 2020 & 2033
- Table 66: Rest of Middle East and Africa Plasma Therapy Industry Volume (K Unit) Forecast, by Application 2020 & 2033
- Table 67: Global Plasma Therapy Industry Revenue million Forecast, by Product 2020 & 2033
- Table 68: Global Plasma Therapy Industry Volume K Unit Forecast, by Product 2020 & 2033
- Table 69: Global Plasma Therapy Industry Revenue million Forecast, by Application 2020 & 2033
- Table 70: Global Plasma Therapy Industry Volume K Unit Forecast, by Application 2020 & 2033
- Table 71: Global Plasma Therapy Industry Revenue million Forecast, by Country 2020 & 2033
- Table 72: Global Plasma Therapy Industry Volume K Unit Forecast, by Country 2020 & 2033
- Table 73: Brazil Plasma Therapy Industry Revenue (million) Forecast, by Application 2020 & 2033
- Table 74: Brazil Plasma Therapy Industry Volume (K Unit) Forecast, by Application 2020 & 2033
- Table 75: Argentina Plasma Therapy Industry Revenue (million) Forecast, by Application 2020 & 2033
- Table 76: Argentina Plasma Therapy Industry Volume (K Unit) Forecast, by Application 2020 & 2033
- Table 77: Rest of South America Plasma Therapy Industry Revenue (million) Forecast, by Application 2020 & 2033
- Table 78: Rest of South America Plasma Therapy Industry Volume (K Unit) Forecast, by Application 2020 & 2033
Frequently Asked Questions
1. What is the projected Compound Annual Growth Rate (CAGR) of the Plasma Therapy Industry?
The projected CAGR is approximately 14.2%.
2. Which companies are prominent players in the Plasma Therapy Industry?
Key companies in the market include Arthrex Inc, Octapharma USA Inc, Baxter, Bio Products Laboratory Ltd, Takeda Pharmaceutical Company Limited, CSL Limited, ADMA Biologics Inc, Taibang Biological Group Co Ltd, Grifols S A, Johnson and Johnson (DePuy Synthes), Biotest UK, Kedrion S p A.
3. What are the main segments of the Plasma Therapy Industry?
The market segments include Product, Application.
4. Can you provide details about the market size?
The market size is estimated to be USD 436.2 million as of 2022.
5. What are some drivers contributing to market growth?
Increasing Incidence of Autoimmune and Neurological Diseases; Rise in Research & Development in Plasma Protein.
6. What are the notable trends driving market growth?
Hemophilia Segment is Expected to Witness a Growth in the Plasma Protein Therapeutics Market Over the Forecast Period.
7. Are there any restraints impacting market growth?
Strict Regulations for the Handling of Plasma Protein Products.
8. Can you provide examples of recent developments in the market?
October 2022- Grifols inaugurated its new state-of-the-art manufacturing plant in Ireland to meet the growing global demand for plasma medicines. Grifols' Dublin manufacturing facility triples the annual filling capacity of its innovative, flexible container, ALBUTEIN FlexBag, to meet the rising demand for albumin, the most abundant plasma protein.
9. What pricing options are available for accessing the report?
Pricing options include single-user, multi-user, and enterprise licenses priced at USD 4750, USD 5250, and USD 8750 respectively.
10. Is the market size provided in terms of value or volume?
The market size is provided in terms of value, measured in million and volume, measured in K Unit.
11. Are there any specific market keywords associated with the report?
Yes, the market keyword associated with the report is "Plasma Therapy Industry," which aids in identifying and referencing the specific market segment covered.
12. How do I determine which pricing option suits my needs best?
The pricing options vary based on user requirements and access needs. Individual users may opt for single-user licenses, while businesses requiring broader access may choose multi-user or enterprise licenses for cost-effective access to the report.
13. Are there any additional resources or data provided in the Plasma Therapy Industry report?
While the report offers comprehensive insights, it's advisable to review the specific contents or supplementary materials provided to ascertain if additional resources or data are available.
14. How can I stay updated on further developments or reports in the Plasma Therapy Industry?
To stay informed about further developments, trends, and reports in the Plasma Therapy Industry, consider subscribing to industry newsletters, following relevant companies and organizations, or regularly checking reputable industry news sources and publications.
Methodology
Step 1 - Identification of Relevant Samples Size from Population Database


Step 2 - Approaches for Defining Global Market Size (Value, Volume* & Price*)

Note*: In applicable scenarios
Step 3 - Data Sources
Primary Research
- Web Analytics
- Survey Reports
- Research Institute
- Latest Research Reports
- Opinion Leaders
Secondary Research
- Annual Reports
- White Paper
- Latest Press Release
- Industry Association
- Paid Database
- Investor Presentations

Step 4 - Data Triangulation
Involves using different sources of information in order to increase the validity of a study
These sources are likely to be stakeholders in a program - participants, other researchers, program staff, other community members, and so on.
Then we put all data in single framework & apply various statistical tools to find out the dynamic on the market.
During the analysis stage, feedback from the stakeholder groups would be compared to determine areas of agreement as well as areas of divergence