

Key Insights
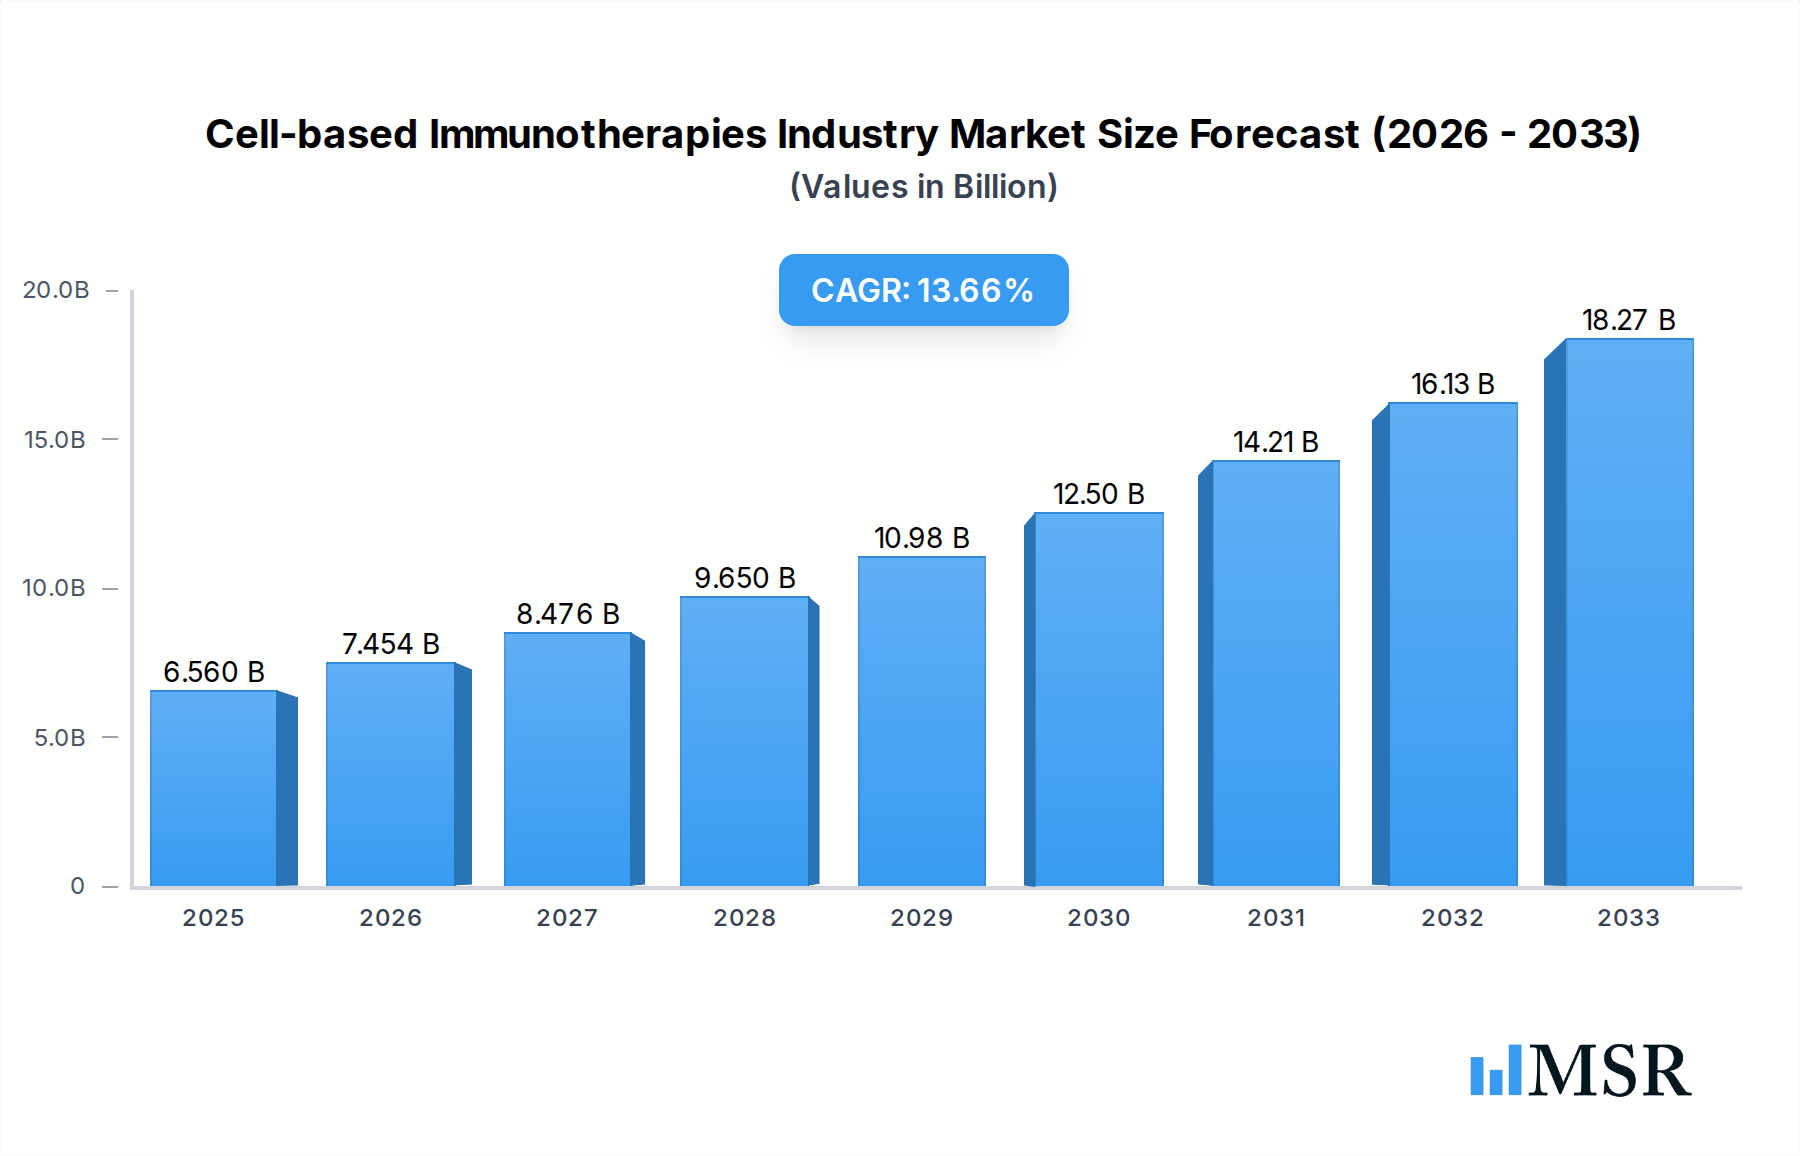
The global Cell-based Immunotherapies market is poised for remarkable growth, projected to reach $6.56 billion by 2025 with an impressive Compound Annual Growth Rate (CAGR) of 13.9% during the forecast period of 2025-2033. This robust expansion is primarily fueled by advancements in personalized medicine and the escalating prevalence of cancer, particularly B-cell malignancies and prostate cancer. The increasing focus on developing targeted therapies with fewer side effects compared to traditional treatments is a significant driver, propelling the adoption of innovative cell-based approaches. Companies are heavily investing in research and development for therapies like Chimeric Antigen Receptor (CAR) T-cell therapy and Dendritic Cell-based Vaccine Therapy, which are demonstrating significant efficacy in clinical trials. The growing demand for effective treatment modalities for hard-to-treat cancers such as liver cancer and renal cell carcinoma further bolsters market prospects. This burgeoning market is characterized by substantial innovation and a strategic focus on addressing unmet medical needs within oncology.

Cell-based Immunotherapies Industry Market Size (In Billion)
The competitive landscape is dynamic, with major players like Novartis AG, Gilead Sciences Inc (Kite Pharma), and Bristol-Myers Squibb Company leading the charge through strategic partnerships, acquisitions, and robust product pipelines. North America currently dominates the market share, driven by early adoption of advanced therapies and significant R&D expenditure. However, the Asia Pacific region is anticipated to witness the fastest growth, attributed to the expanding healthcare infrastructure, increasing cancer incidence, and growing government initiatives to promote advanced therapies. Challenges such as high treatment costs and complex manufacturing processes remain, but ongoing technological innovations and a supportive regulatory environment are expected to mitigate these restraints. The market's segmentation, encompassing various therapy types and primary indications, highlights the diverse opportunities and the potential for tailored solutions to address a broad spectrum of oncological conditions, promising a transformative impact on cancer care.
Cell-based Immunotherapies Industry Company Market Share
Unlock the potential of cutting-edge cancer treatments with this in-depth analysis of the global cell-based immunotherapies market. This report provides actionable insights into the rapidly evolving landscape of chimeric antigen receptor (CAR) T-cell therapy, autologous cellular immunotherapy, and dendritic cell-based vaccine therapy. Delve into critical market dynamics, explore dominant segments in B-cell malignancies, prostate cancer, renal cell carcinoma, and liver cancer, and identify key growth drivers and emerging opportunities. This comprehensive study, covering the historical period 2019–2024, base year 2025, and forecast period 2025–2033, equips industry stakeholders with the knowledge to navigate this dynamic market.
Cell-based Immunotherapies Industry Market Concentration & Dynamics
The cell-based immunotherapies market exhibits a moderate to high level of concentration, with a few dominant players holding significant market share, particularly in the advanced CAR T-cell therapy space. Innovation ecosystems are characterized by robust R&D investment, strategic partnerships between academic institutions and pharmaceutical giants, and a growing pipeline of novel allogeneic CAR T (AlloCAR T) products aimed at improving accessibility and scalability. Regulatory frameworks, while stringent, are adapting to the unique challenges of cellular therapies, with expedited pathways for promising treatments. Substitute products, such as conventional chemotherapy and targeted therapies, still represent a significant portion of cancer treatment, but their limitations are driving the adoption of cell-based immunotherapies. End-user trends indicate a strong preference for personalized and less toxic treatment options, fueling demand for these advanced therapies. Mergers and acquisitions (M&A) activities are crucial for market consolidation and technology acquisition, with deal counts expected to rise as companies seek to expand their portfolios and geographical reach.
- Market Share Dynamics: Key players are focused on expanding indications and manufacturing capacities to capture larger market segments.
- Innovation Ecosystems: Collaborations between biotech startups and large pharmaceutical companies are driving rapid advancements.
- Regulatory Frameworks: Ongoing dialogue between industry and regulatory bodies is essential for streamlining approval processes for next-generation therapies.
- Substitute Products: Conventional treatments remain competitive, necessitating clear demonstration of superior efficacy and safety profiles for cell-based therapies.
- End-User Trends: Increasing patient awareness and physician advocacy are key drivers for adoption.
- M&A Activities: Strategic acquisitions of early-stage companies with promising pipelines are a recurring theme, aiming to accelerate market entry and gain competitive advantages.
Cell-based Immunotherapies Industry Industry Insights & Trends
The global cell-based immunotherapies market is poised for substantial growth, driven by an increasing global cancer burden, significant advancements in biotechnology, and a growing pipeline of innovative therapies. The market size is projected to reach hundreds of billions of dollars by the end of the forecast period, with a robust Compound Annual Growth Rate (CAGR) fueled by these intertwined factors. Technological disruptions are at the forefront, with continuous improvements in CAR T-cell engineering, the development of bispecific antibodies for enhanced targeting, and the exploration of novel cell types beyond T-cells. Evolving consumer behaviors, influenced by increasing patient advocacy groups and a greater understanding of personalized medicine, are pushing demand for highly effective and targeted treatments with improved safety profiles. The market is also witnessing a paradigm shift from treating advanced, refractory cancers to exploring earlier lines of therapy, thereby expanding the addressable patient population significantly. The integration of artificial intelligence (AI) and machine learning (ML) in drug discovery and development is further accelerating the pace of innovation, enabling more precise patient selection and treatment optimization.
Key Markets & Segments Leading Cell-based Immunotherapies Industry
The Chimeric Antigen Receptor (CAR) T-Cell Therapy segment is a dominant force within the cell-based immunotherapies market, primarily driven by its remarkable success in treating B-cell Malignancies, such as diffuse large B-cell lymphoma (DLBCL) and acute lymphoblastic leukemia (ALL). The approval and expanding use of CAR T-cell therapies in these indications, coupled with ongoing research into new targets and improved efficacy, positions this segment for sustained leadership.
Dominant Region/Country: North America, particularly the United States, currently leads the market due to a strong healthcare infrastructure, substantial R&D investments, a high prevalence of target cancers, and a favorable regulatory environment for novel therapeutics. Europe follows closely, with a growing number of approvals and clinical trials.
Dominant Segment (Therapy):
- Chimeric Antigen Receptor (CAR) T-Cell Therapy: Its proven efficacy in hematological malignancies and expanding pipeline for solid tumors make it a key growth engine. Factors driving its dominance include:
- Clinical Efficacy: Demonstrated high response rates and durable remissions in previously untreatable cancers.
- Technological Advancements: Continuous improvements in CAR construct design, gene editing techniques, and manufacturing processes.
- FDA Approvals: The increasing number of approved CAR T-cell therapies for various hematological cancers.
- Investment: Significant venture capital and pharmaceutical funding directed towards CAR T-cell therapy research and development.
- Chimeric Antigen Receptor (CAR) T-Cell Therapy: Its proven efficacy in hematological malignancies and expanding pipeline for solid tumors make it a key growth engine. Factors driving its dominance include:
Dominant Segment (Primary Indication):
- B-cell Malignancies: This segment represents the largest market due to the established success of CAR T-cell therapies.
- High Unmet Need: Significant portion of patients with relapsed or refractory B-cell malignancies who have limited treatment options.
- Targeted Therapies: Identification of specific antigens (e.g., CD19, BCMA) on B-cells for effective targeting.
- Expansion of Indications: Ongoing clinical trials exploring CAR T-cell therapy for earlier lines of treatment in B-cell malignancies.
- B-cell Malignancies: This segment represents the largest market due to the established success of CAR T-cell therapies.
While Autologous Cellular Immunotherapy remains a foundational element, and Dendritic Cell-based Vaccine Therapy shows promise for certain indications like Prostate Cancer, their market penetration and growth trajectories are currently outpaced by the rapid advancements and widespread adoption of CAR T-cell therapies for B-cell malignancies. However, research into these other modalities, particularly for solid tumors and as adjunct therapies, is critical for future market expansion. The Renal Cell Carcinoma and Liver Cancer markets are also emerging areas with significant potential, driven by ongoing clinical trials and the development of novel cell-based approaches to tackle these complex diseases.
Cell-based Immunotherapies Industry Product Developments
Product innovation in cell-based immunotherapies is characterized by the development of next-generation CAR T-cell therapies with improved safety profiles, enhanced efficacy against solid tumors, and the exploration of allogeneic ("off-the-shelf") approaches to increase accessibility. Companies are focusing on novel target antigens, advanced CAR designs (e.g., multi-specific CARs), and improved manufacturing techniques to reduce production times and costs. The market relevance of these developments lies in their potential to expand the therapeutic window, overcome tumor resistance, and make these life-saving treatments available to a broader patient population.
Challenges in the Cell-based Immunotherapies Industry Market
Despite its immense potential, the cell-based immunotherapies market faces significant challenges. The high cost of development and treatment remains a major barrier to widespread adoption, often exceeding hundreds of thousands of dollars per patient. Manufacturing complexity and scalability issues can lead to significant lead times and supply chain disruptions. Stringent and evolving regulatory hurdles require extensive clinical trials and robust post-market surveillance. Furthermore, the risk of severe side effects, such as cytokine release syndrome (CRS) and neurotoxicity, necessitates specialized management protocols and trained medical professionals, limiting treatment centers.
- High Treatment Costs: Exceeding $300,000 to $500,000 per patient.
- Manufacturing Complexity: Long production cycles, quality control challenges, and specialized infrastructure requirements.
- Regulatory Hurdles: Extensive data requirements for approvals and post-market surveillance.
- Adverse Events: Management of cytokine release syndrome (CRS) and immune effector cell-associated neurotoxicity syndrome (ICANS).
- Limited Treatment Centers: Requirement for highly specialized facilities and trained personnel.
Forces Driving Cell-based Immunotherapies Industry Growth
Several potent forces are propelling the growth of the cell-based immunotherapies industry. Technological advancements in gene editing, synthetic biology, and immunology are enabling the creation of more potent and targeted cellular therapies. A growing global cancer burden, coupled with an aging population, translates into an increasing demand for innovative and effective treatments. Favorable reimbursement policies and government initiatives supporting advanced therapies are also crucial growth accelerators. Moreover, the increasing success of CAR T-cell therapies in hematological malignancies is stimulating further investment and research across a wider spectrum of cancers.
Challenges in the Cell-based Immunotherapies Industry Market
Long-term growth catalysts for the cell-based immunotherapies market include the successful translation of CAR T-cell therapies into solid tumors, a significant unmet need that currently represents a vast, largely untapped market. The development of off-the-shelf allogeneic cell therapies will be pivotal in overcoming the manufacturing and logistical constraints of autologous approaches, drastically reducing treatment times and costs. Strategic partnerships and collaborations between academic research institutions, biotech companies, and large pharmaceutical firms are essential for fostering continuous innovation and expediting clinical development. Furthermore, the expansion of manufacturing capacity globally and the establishment of standardized protocols for quality control and patient management will be critical for sustained market expansion.
Emerging Opportunities in Cell-based Immunotherapies Industry
Emerging opportunities in the cell-based immunotherapies industry are vast and multifaceted. The expansion of cell therapies into solid tumor indications, which historically have been challenging, presents a significant growth avenue. The development of novel cell types beyond T-cells, such as NK cells and gamma delta T-cells, offers alternative mechanisms of action and potentially improved safety profiles. The integration of oncolytic viruses with cell-based therapies or the development of cell-drug conjugates could further enhance anti-cancer efficacy. Furthermore, the growing market for rare cancers and pediatric oncology presents niche but high-impact opportunities for specialized cell-based treatments. The increasing focus on preventative immunotherapies and early-stage disease intervention also opens new avenues for market penetration.
Leading Players in the Cell-based Immunotherapies Industry Sector
- Dendreon Pharmaceuticals LLC
- Gilead Sciences Inc (Kite Pharma)
- Novartis AG
- F Hoffmann-La Roche Ltd
- GC Biopharma Corporation
- GlaxoSmithKline plc
- Celyad
- Bristol-Myers Squibb Company
- JW CreaGene Co Ltd
- Johnson and Johnson (Janssen Global Services LLC)
- Pfizer Inc
Key Milestones in Cell-based Immunotherapies Industry Industry
- April 2022: Gilead Company's Yescarta received FDA approval as the first CAR T-cell therapy for the initial treatment of relapsed or refractory large B-cell lymphoma (LBCL).
- October 2022: Allogene Therapeutics, Inc. launched CAR T Together, a collaborative initiative to advance the development of allogeneic CAR T products, aiming to improve scalability and accessibility.
Strategic Outlook for Cell-based Immunotherapies Industry Market
The strategic outlook for the cell-based immunotherapies market is exceptionally promising, driven by an unrelenting pursuit of innovation and patient-centric solutions. Key growth accelerators include the aggressive expansion of indications for existing CAR T-cell therapies into earlier lines of treatment and a wider array of hematological malignancies, alongside significant progress in overcoming the challenges of solid tumor application. The continued development and eventual commercialization of allogeneic CAR T therapies represent a major strategic imperative, promising to democratize access to these life-changing treatments. Furthermore, strategic partnerships and licensing agreements will remain critical for leveraging external innovation and expanding global manufacturing capabilities. The market is poised for sustained growth, fueled by a commitment to addressing unmet medical needs and transforming cancer care.
Cell-based Immunotherapies Industry Segmentation
-
1. Therapy
- 1.1. Autologous Cellular Immunotherapy
- 1.2. Chimeric Antigen Receptor (CAR) T-Cell Therapy
- 1.3. Dendritic Cell-based Vaccine Therapy
-
2. Primary Indication
- 2.1. B-cell Malignancies
- 2.2. Prostate Cancer
- 2.3. Renal Cell Carcinoma
- 2.4. Liver Cancer
- 2.5. Other Primary Indications
Cell-based Immunotherapies Industry Segmentation By Geography
-
1. North America
- 1.1. United States
- 1.2. Canada
- 1.3. Mexico
-
2. Europe
- 2.1. Germany
- 2.2. United Kingdom
- 2.3. France
- 2.4. Italy
- 2.5. Spain
- 2.6. Rest of Europe
-
3. Asia Pacific
- 3.1. China
- 3.2. Japan
- 3.3. India
- 3.4. Australia
- 3.5. South Korea
- 3.6. Rest of Asia Pacific
-
4. Middle East and Africa
- 4.1. GCC
- 4.2. South Africa
- 4.3. Rest of Middle East and Africa
-
5. South America
- 5.1. Brazil
- 5.2. Argentina
- 5.3. Rest of South America
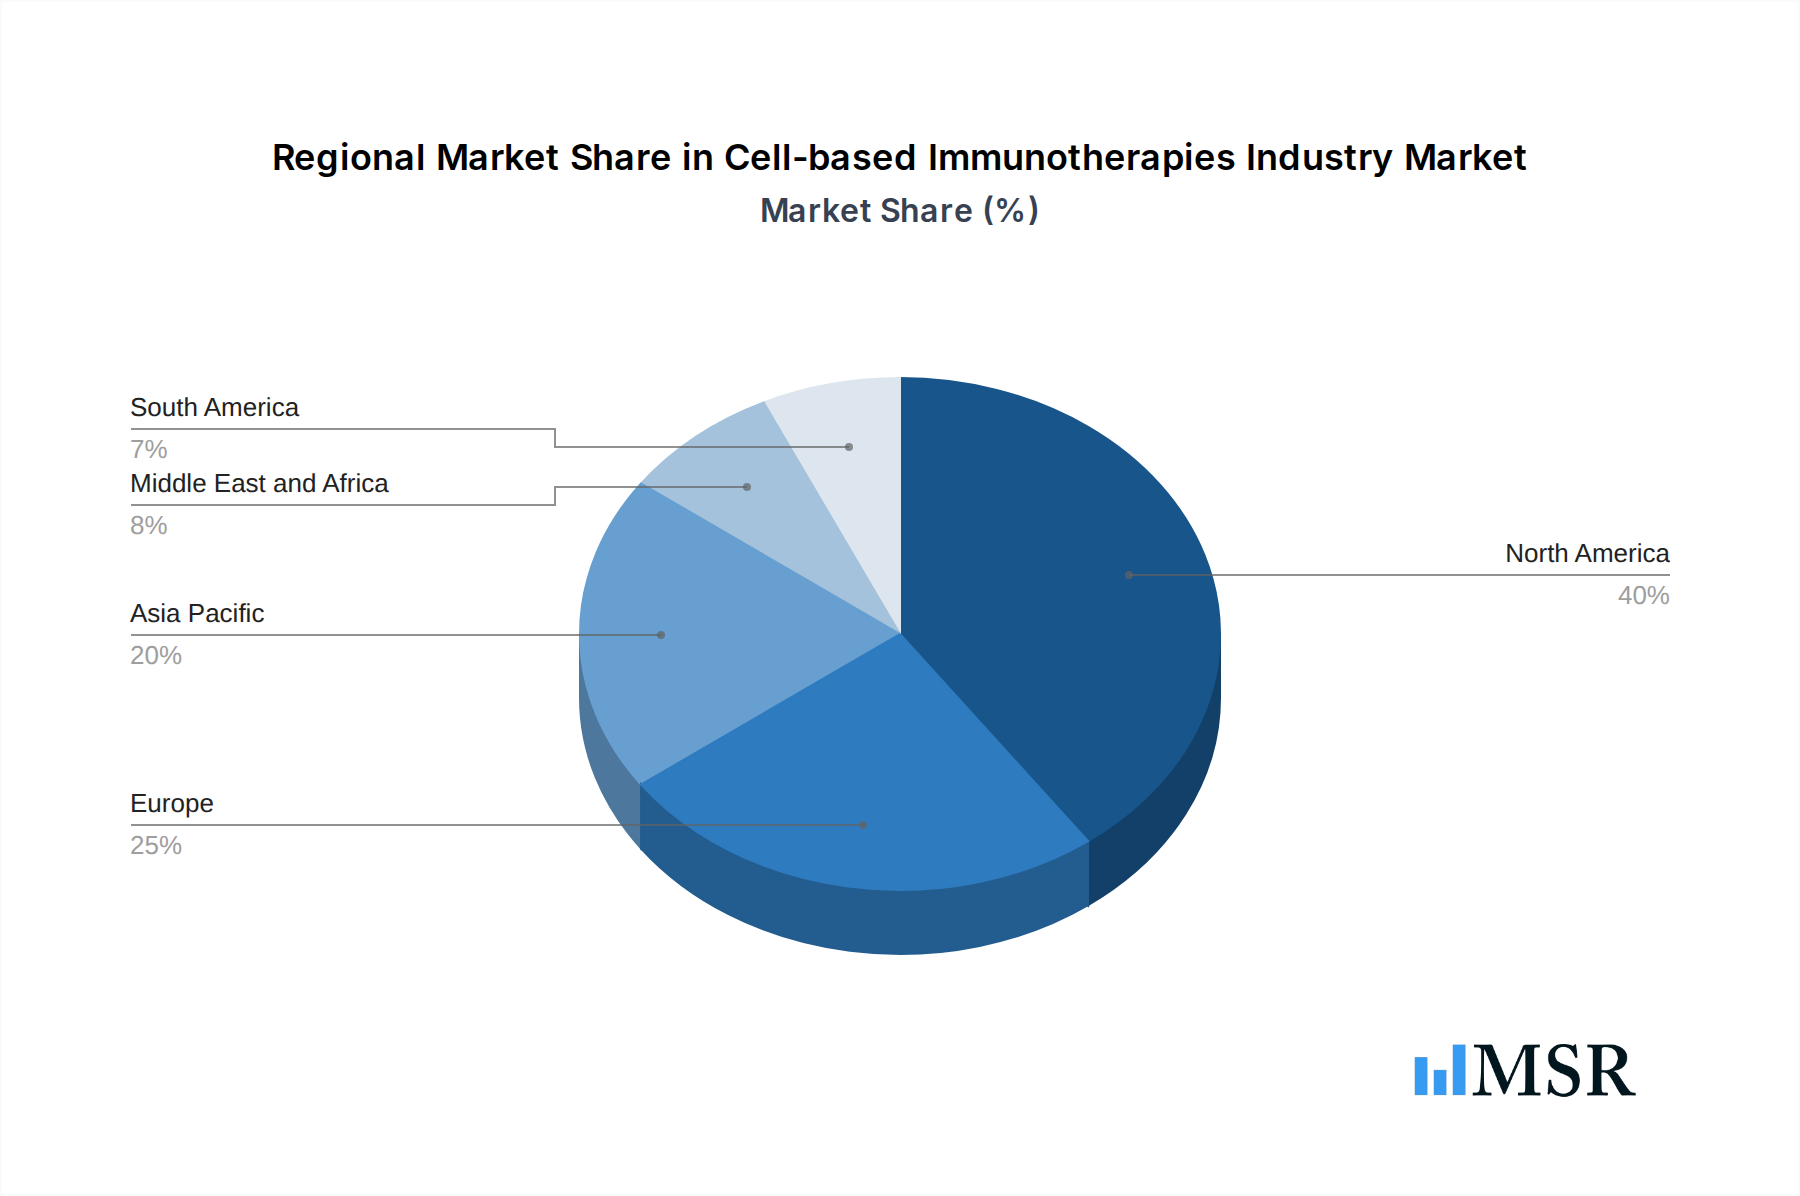
Cell-based Immunotherapies Industry Regional Market Share
Geographic Coverage of Cell-based Immunotherapies Industry
Cell-based Immunotherapies Industry REPORT HIGHLIGHTS
| Aspects | Details |
|---|---|
| Study Period | 2020-2034 |
| Base Year | 2025 |
| Estimated Year | 2026 |
| Forecast Period | 2026-2034 |
| Historical Period | 2020-2025 |
| Growth Rate | CAGR of 13.9% from 2020-2034 |
| Segmentation |
|
Table of Contents
- 1. Introduction
- 1.1. Research Scope
- 1.2. Market Segmentation
- 1.3. Research Objective
- 1.4. Definitions and Assumptions
- 2. Executive Summary
- 2.1. Market Snapshot
- 3. Market Dynamics
- 3.1. Market Drivers
- 3.2. Market Restrains
- 3.3. Market Trends
- 3.4. Market Opportunities
- 4. Market Factor Analysis
- 4.1. Porters Five Forces
- 4.1.1. Bargaining Power of Suppliers
- 4.1.2. Bargaining Power of Buyers
- 4.1.3. Threat of New Entrants
- 4.1.4. Threat of Substitutes
- 4.1.5. Competitive Rivalry
- 4.2. PESTEL analysis
- 4.3. BCG Analysis
- 4.3.1. Stars (High Growth, High Market Share)
- 4.3.2. Cash Cows (Low Growth, High Market Share)
- 4.3.3. Question Mark (High Growth, Low Market Share)
- 4.3.4. Dogs (Low Growth, Low Market Share)
- 4.4. Ansoff Matrix Analysis
- 4.5. Supply Chain Analysis
- 4.6. Regulatory Landscape
- 4.7. Current Market Potential and Opportunity Assessment (TAM–SAM–SOM Framework)
- 4.8. MSR Analyst Note
- 4.1. Porters Five Forces
- 5. Market Analysis, Insights and Forecast 2021-2033
- 5.1. Market Analysis, Insights and Forecast - by Therapy
- 5.1.1. Autologous Cellular Immunotherapy
- 5.1.2. Chimeric Antigen Receptor (CAR) T-Cell Therapy
- 5.1.3. Dendritic Cell-based Vaccine Therapy
- 5.2. Market Analysis, Insights and Forecast - by Primary Indication
- 5.2.1. B-cell Malignancies
- 5.2.2. Prostate Cancer
- 5.2.3. Renal Cell Carcinoma
- 5.2.4. Liver Cancer
- 5.2.5. Other Primary Indications
- 5.3. Market Analysis, Insights and Forecast - by Region
- 5.3.1. North America
- 5.3.2. Europe
- 5.3.3. Asia Pacific
- 5.3.4. Middle East and Africa
- 5.3.5. South America
- 5.1. Market Analysis, Insights and Forecast - by Therapy
- 6. Global Cell-based Immunotherapies Industry Analysis, Insights and Forecast, 2021-2033
- 6.1. Market Analysis, Insights and Forecast - by Therapy
- 6.1.1. Autologous Cellular Immunotherapy
- 6.1.2. Chimeric Antigen Receptor (CAR) T-Cell Therapy
- 6.1.3. Dendritic Cell-based Vaccine Therapy
- 6.2. Market Analysis, Insights and Forecast - by Primary Indication
- 6.2.1. B-cell Malignancies
- 6.2.2. Prostate Cancer
- 6.2.3. Renal Cell Carcinoma
- 6.2.4. Liver Cancer
- 6.2.5. Other Primary Indications
- 6.1. Market Analysis, Insights and Forecast - by Therapy
- 7. North America Cell-based Immunotherapies Industry Analysis, Insights and Forecast, 2020-2032
- 7.1. Market Analysis, Insights and Forecast - by Therapy
- 7.1.1. Autologous Cellular Immunotherapy
- 7.1.2. Chimeric Antigen Receptor (CAR) T-Cell Therapy
- 7.1.3. Dendritic Cell-based Vaccine Therapy
- 7.2. Market Analysis, Insights and Forecast - by Primary Indication
- 7.2.1. B-cell Malignancies
- 7.2.2. Prostate Cancer
- 7.2.3. Renal Cell Carcinoma
- 7.2.4. Liver Cancer
- 7.2.5. Other Primary Indications
- 7.1. Market Analysis, Insights and Forecast - by Therapy
- 8. Europe Cell-based Immunotherapies Industry Analysis, Insights and Forecast, 2020-2032
- 8.1. Market Analysis, Insights and Forecast - by Therapy
- 8.1.1. Autologous Cellular Immunotherapy
- 8.1.2. Chimeric Antigen Receptor (CAR) T-Cell Therapy
- 8.1.3. Dendritic Cell-based Vaccine Therapy
- 8.2. Market Analysis, Insights and Forecast - by Primary Indication
- 8.2.1. B-cell Malignancies
- 8.2.2. Prostate Cancer
- 8.2.3. Renal Cell Carcinoma
- 8.2.4. Liver Cancer
- 8.2.5. Other Primary Indications
- 8.1. Market Analysis, Insights and Forecast - by Therapy
- 9. Asia Pacific Cell-based Immunotherapies Industry Analysis, Insights and Forecast, 2020-2032
- 9.1. Market Analysis, Insights and Forecast - by Therapy
- 9.1.1. Autologous Cellular Immunotherapy
- 9.1.2. Chimeric Antigen Receptor (CAR) T-Cell Therapy
- 9.1.3. Dendritic Cell-based Vaccine Therapy
- 9.2. Market Analysis, Insights and Forecast - by Primary Indication
- 9.2.1. B-cell Malignancies
- 9.2.2. Prostate Cancer
- 9.2.3. Renal Cell Carcinoma
- 9.2.4. Liver Cancer
- 9.2.5. Other Primary Indications
- 9.1. Market Analysis, Insights and Forecast - by Therapy
- 10. Middle East and Africa Cell-based Immunotherapies Industry Analysis, Insights and Forecast, 2020-2032
- 10.1. Market Analysis, Insights and Forecast - by Therapy
- 10.1.1. Autologous Cellular Immunotherapy
- 10.1.2. Chimeric Antigen Receptor (CAR) T-Cell Therapy
- 10.1.3. Dendritic Cell-based Vaccine Therapy
- 10.2. Market Analysis, Insights and Forecast - by Primary Indication
- 10.2.1. B-cell Malignancies
- 10.2.2. Prostate Cancer
- 10.2.3. Renal Cell Carcinoma
- 10.2.4. Liver Cancer
- 10.2.5. Other Primary Indications
- 10.1. Market Analysis, Insights and Forecast - by Therapy
- 11. South America Cell-based Immunotherapies Industry Analysis, Insights and Forecast, 2020-2032
- 11.1. Market Analysis, Insights and Forecast - by Therapy
- 11.1.1. Autologous Cellular Immunotherapy
- 11.1.2. Chimeric Antigen Receptor (CAR) T-Cell Therapy
- 11.1.3. Dendritic Cell-based Vaccine Therapy
- 11.2. Market Analysis, Insights and Forecast - by Primary Indication
- 11.2.1. B-cell Malignancies
- 11.2.2. Prostate Cancer
- 11.2.3. Renal Cell Carcinoma
- 11.2.4. Liver Cancer
- 11.2.5. Other Primary Indications
- 11.1. Market Analysis, Insights and Forecast - by Therapy
- 12. Competitive Analysis
- 12.1. Company Profiles
- 12.1.1 Dendreon Pharmaceuticals LLC
- 12.1.1.1. Company Overview
- 12.1.1.2. Products
- 12.1.1.3. Company Financials
- 12.1.1.4. SWOT Analysis
- 12.1.2 Gilead Sciences Inc (Kite Pharma)
- 12.1.2.1. Company Overview
- 12.1.2.2. Products
- 12.1.2.3. Company Financials
- 12.1.2.4. SWOT Analysis
- 12.1.3 Novartis AG
- 12.1.3.1. Company Overview
- 12.1.3.2. Products
- 12.1.3.3. Company Financials
- 12.1.3.4. SWOT Analysis
- 12.1.4 F Hoffmann-La Roche Ltd
- 12.1.4.1. Company Overview
- 12.1.4.2. Products
- 12.1.4.3. Company Financials
- 12.1.4.4. SWOT Analysis
- 12.1.5 GC Biopharma Corporation
- 12.1.5.1. Company Overview
- 12.1.5.2. Products
- 12.1.5.3. Company Financials
- 12.1.5.4. SWOT Analysis
- 12.1.6 GlaxoSmithKline plc
- 12.1.6.1. Company Overview
- 12.1.6.2. Products
- 12.1.6.3. Company Financials
- 12.1.6.4. SWOT Analysis
- 12.1.7 Celyad
- 12.1.7.1. Company Overview
- 12.1.7.2. Products
- 12.1.7.3. Company Financials
- 12.1.7.4. SWOT Analysis
- 12.1.8 Bristol-Myers Squibb Company
- 12.1.8.1. Company Overview
- 12.1.8.2. Products
- 12.1.8.3. Company Financials
- 12.1.8.4. SWOT Analysis
- 12.1.9 JW CreaGene Co Ltd
- 12.1.9.1. Company Overview
- 12.1.9.2. Products
- 12.1.9.3. Company Financials
- 12.1.9.4. SWOT Analysis
- 12.1.10 Johnson and Johnson (Janssen Global Services LLC)
- 12.1.10.1. Company Overview
- 12.1.10.2. Products
- 12.1.10.3. Company Financials
- 12.1.10.4. SWOT Analysis
- 12.1.11 Pfizer Inc
- 12.1.11.1. Company Overview
- 12.1.11.2. Products
- 12.1.11.3. Company Financials
- 12.1.11.4. SWOT Analysis
- 12.1.1 Dendreon Pharmaceuticals LLC
- 12.2. Market Entropy
- 12.2.1 Company's Key Areas Served
- 12.2.2 Recent Developments
- 12.3. Company Market Share Analysis 2025
- 12.3.1 Top 5 Companies Market Share Analysis
- 12.3.2 Top 3 Companies Market Share Analysis
- 12.4. List of Potential Customers
- 13. Research Methodology
List of Figures
- Figure 1: Global Cell-based Immunotherapies Industry Revenue Breakdown (billion, %) by Region 2025 & 2033
- Figure 2: Global Cell-based Immunotherapies Industry Volume Breakdown (K Unit, %) by Region 2025 & 2033
- Figure 3: North America Cell-based Immunotherapies Industry Revenue (billion), by Therapy 2025 & 2033
- Figure 4: North America Cell-based Immunotherapies Industry Volume (K Unit), by Therapy 2025 & 2033
- Figure 5: North America Cell-based Immunotherapies Industry Revenue Share (%), by Therapy 2025 & 2033
- Figure 6: North America Cell-based Immunotherapies Industry Volume Share (%), by Therapy 2025 & 2033
- Figure 7: North America Cell-based Immunotherapies Industry Revenue (billion), by Primary Indication 2025 & 2033
- Figure 8: North America Cell-based Immunotherapies Industry Volume (K Unit), by Primary Indication 2025 & 2033
- Figure 9: North America Cell-based Immunotherapies Industry Revenue Share (%), by Primary Indication 2025 & 2033
- Figure 10: North America Cell-based Immunotherapies Industry Volume Share (%), by Primary Indication 2025 & 2033
- Figure 11: North America Cell-based Immunotherapies Industry Revenue (billion), by Country 2025 & 2033
- Figure 12: North America Cell-based Immunotherapies Industry Volume (K Unit), by Country 2025 & 2033
- Figure 13: North America Cell-based Immunotherapies Industry Revenue Share (%), by Country 2025 & 2033
- Figure 14: North America Cell-based Immunotherapies Industry Volume Share (%), by Country 2025 & 2033
- Figure 15: Europe Cell-based Immunotherapies Industry Revenue (billion), by Therapy 2025 & 2033
- Figure 16: Europe Cell-based Immunotherapies Industry Volume (K Unit), by Therapy 2025 & 2033
- Figure 17: Europe Cell-based Immunotherapies Industry Revenue Share (%), by Therapy 2025 & 2033
- Figure 18: Europe Cell-based Immunotherapies Industry Volume Share (%), by Therapy 2025 & 2033
- Figure 19: Europe Cell-based Immunotherapies Industry Revenue (billion), by Primary Indication 2025 & 2033
- Figure 20: Europe Cell-based Immunotherapies Industry Volume (K Unit), by Primary Indication 2025 & 2033
- Figure 21: Europe Cell-based Immunotherapies Industry Revenue Share (%), by Primary Indication 2025 & 2033
- Figure 22: Europe Cell-based Immunotherapies Industry Volume Share (%), by Primary Indication 2025 & 2033
- Figure 23: Europe Cell-based Immunotherapies Industry Revenue (billion), by Country 2025 & 2033
- Figure 24: Europe Cell-based Immunotherapies Industry Volume (K Unit), by Country 2025 & 2033
- Figure 25: Europe Cell-based Immunotherapies Industry Revenue Share (%), by Country 2025 & 2033
- Figure 26: Europe Cell-based Immunotherapies Industry Volume Share (%), by Country 2025 & 2033
- Figure 27: Asia Pacific Cell-based Immunotherapies Industry Revenue (billion), by Therapy 2025 & 2033
- Figure 28: Asia Pacific Cell-based Immunotherapies Industry Volume (K Unit), by Therapy 2025 & 2033
- Figure 29: Asia Pacific Cell-based Immunotherapies Industry Revenue Share (%), by Therapy 2025 & 2033
- Figure 30: Asia Pacific Cell-based Immunotherapies Industry Volume Share (%), by Therapy 2025 & 2033
- Figure 31: Asia Pacific Cell-based Immunotherapies Industry Revenue (billion), by Primary Indication 2025 & 2033
- Figure 32: Asia Pacific Cell-based Immunotherapies Industry Volume (K Unit), by Primary Indication 2025 & 2033
- Figure 33: Asia Pacific Cell-based Immunotherapies Industry Revenue Share (%), by Primary Indication 2025 & 2033
- Figure 34: Asia Pacific Cell-based Immunotherapies Industry Volume Share (%), by Primary Indication 2025 & 2033
- Figure 35: Asia Pacific Cell-based Immunotherapies Industry Revenue (billion), by Country 2025 & 2033
- Figure 36: Asia Pacific Cell-based Immunotherapies Industry Volume (K Unit), by Country 2025 & 2033
- Figure 37: Asia Pacific Cell-based Immunotherapies Industry Revenue Share (%), by Country 2025 & 2033
- Figure 38: Asia Pacific Cell-based Immunotherapies Industry Volume Share (%), by Country 2025 & 2033
- Figure 39: Middle East and Africa Cell-based Immunotherapies Industry Revenue (billion), by Therapy 2025 & 2033
- Figure 40: Middle East and Africa Cell-based Immunotherapies Industry Volume (K Unit), by Therapy 2025 & 2033
- Figure 41: Middle East and Africa Cell-based Immunotherapies Industry Revenue Share (%), by Therapy 2025 & 2033
- Figure 42: Middle East and Africa Cell-based Immunotherapies Industry Volume Share (%), by Therapy 2025 & 2033
- Figure 43: Middle East and Africa Cell-based Immunotherapies Industry Revenue (billion), by Primary Indication 2025 & 2033
- Figure 44: Middle East and Africa Cell-based Immunotherapies Industry Volume (K Unit), by Primary Indication 2025 & 2033
- Figure 45: Middle East and Africa Cell-based Immunotherapies Industry Revenue Share (%), by Primary Indication 2025 & 2033
- Figure 46: Middle East and Africa Cell-based Immunotherapies Industry Volume Share (%), by Primary Indication 2025 & 2033
- Figure 47: Middle East and Africa Cell-based Immunotherapies Industry Revenue (billion), by Country 2025 & 2033
- Figure 48: Middle East and Africa Cell-based Immunotherapies Industry Volume (K Unit), by Country 2025 & 2033
- Figure 49: Middle East and Africa Cell-based Immunotherapies Industry Revenue Share (%), by Country 2025 & 2033
- Figure 50: Middle East and Africa Cell-based Immunotherapies Industry Volume Share (%), by Country 2025 & 2033
- Figure 51: South America Cell-based Immunotherapies Industry Revenue (billion), by Therapy 2025 & 2033
- Figure 52: South America Cell-based Immunotherapies Industry Volume (K Unit), by Therapy 2025 & 2033
- Figure 53: South America Cell-based Immunotherapies Industry Revenue Share (%), by Therapy 2025 & 2033
- Figure 54: South America Cell-based Immunotherapies Industry Volume Share (%), by Therapy 2025 & 2033
- Figure 55: South America Cell-based Immunotherapies Industry Revenue (billion), by Primary Indication 2025 & 2033
- Figure 56: South America Cell-based Immunotherapies Industry Volume (K Unit), by Primary Indication 2025 & 2033
- Figure 57: South America Cell-based Immunotherapies Industry Revenue Share (%), by Primary Indication 2025 & 2033
- Figure 58: South America Cell-based Immunotherapies Industry Volume Share (%), by Primary Indication 2025 & 2033
- Figure 59: South America Cell-based Immunotherapies Industry Revenue (billion), by Country 2025 & 2033
- Figure 60: South America Cell-based Immunotherapies Industry Volume (K Unit), by Country 2025 & 2033
- Figure 61: South America Cell-based Immunotherapies Industry Revenue Share (%), by Country 2025 & 2033
- Figure 62: South America Cell-based Immunotherapies Industry Volume Share (%), by Country 2025 & 2033
List of Tables
- Table 1: Global Cell-based Immunotherapies Industry Revenue billion Forecast, by Therapy 2020 & 2033
- Table 2: Global Cell-based Immunotherapies Industry Volume K Unit Forecast, by Therapy 2020 & 2033
- Table 3: Global Cell-based Immunotherapies Industry Revenue billion Forecast, by Primary Indication 2020 & 2033
- Table 4: Global Cell-based Immunotherapies Industry Volume K Unit Forecast, by Primary Indication 2020 & 2033
- Table 5: Global Cell-based Immunotherapies Industry Revenue billion Forecast, by Region 2020 & 2033
- Table 6: Global Cell-based Immunotherapies Industry Volume K Unit Forecast, by Region 2020 & 2033
- Table 7: Global Cell-based Immunotherapies Industry Revenue billion Forecast, by Therapy 2020 & 2033
- Table 8: Global Cell-based Immunotherapies Industry Volume K Unit Forecast, by Therapy 2020 & 2033
- Table 9: Global Cell-based Immunotherapies Industry Revenue billion Forecast, by Primary Indication 2020 & 2033
- Table 10: Global Cell-based Immunotherapies Industry Volume K Unit Forecast, by Primary Indication 2020 & 2033
- Table 11: Global Cell-based Immunotherapies Industry Revenue billion Forecast, by Country 2020 & 2033
- Table 12: Global Cell-based Immunotherapies Industry Volume K Unit Forecast, by Country 2020 & 2033
- Table 13: United States Cell-based Immunotherapies Industry Revenue (billion) Forecast, by Application 2020 & 2033
- Table 14: United States Cell-based Immunotherapies Industry Volume (K Unit) Forecast, by Application 2020 & 2033
- Table 15: Canada Cell-based Immunotherapies Industry Revenue (billion) Forecast, by Application 2020 & 2033
- Table 16: Canada Cell-based Immunotherapies Industry Volume (K Unit) Forecast, by Application 2020 & 2033
- Table 17: Mexico Cell-based Immunotherapies Industry Revenue (billion) Forecast, by Application 2020 & 2033
- Table 18: Mexico Cell-based Immunotherapies Industry Volume (K Unit) Forecast, by Application 2020 & 2033
- Table 19: Global Cell-based Immunotherapies Industry Revenue billion Forecast, by Therapy 2020 & 2033
- Table 20: Global Cell-based Immunotherapies Industry Volume K Unit Forecast, by Therapy 2020 & 2033
- Table 21: Global Cell-based Immunotherapies Industry Revenue billion Forecast, by Primary Indication 2020 & 2033
- Table 22: Global Cell-based Immunotherapies Industry Volume K Unit Forecast, by Primary Indication 2020 & 2033
- Table 23: Global Cell-based Immunotherapies Industry Revenue billion Forecast, by Country 2020 & 2033
- Table 24: Global Cell-based Immunotherapies Industry Volume K Unit Forecast, by Country 2020 & 2033
- Table 25: Germany Cell-based Immunotherapies Industry Revenue (billion) Forecast, by Application 2020 & 2033
- Table 26: Germany Cell-based Immunotherapies Industry Volume (K Unit) Forecast, by Application 2020 & 2033
- Table 27: United Kingdom Cell-based Immunotherapies Industry Revenue (billion) Forecast, by Application 2020 & 2033
- Table 28: United Kingdom Cell-based Immunotherapies Industry Volume (K Unit) Forecast, by Application 2020 & 2033
- Table 29: France Cell-based Immunotherapies Industry Revenue (billion) Forecast, by Application 2020 & 2033
- Table 30: France Cell-based Immunotherapies Industry Volume (K Unit) Forecast, by Application 2020 & 2033
- Table 31: Italy Cell-based Immunotherapies Industry Revenue (billion) Forecast, by Application 2020 & 2033
- Table 32: Italy Cell-based Immunotherapies Industry Volume (K Unit) Forecast, by Application 2020 & 2033
- Table 33: Spain Cell-based Immunotherapies Industry Revenue (billion) Forecast, by Application 2020 & 2033
- Table 34: Spain Cell-based Immunotherapies Industry Volume (K Unit) Forecast, by Application 2020 & 2033
- Table 35: Rest of Europe Cell-based Immunotherapies Industry Revenue (billion) Forecast, by Application 2020 & 2033
- Table 36: Rest of Europe Cell-based Immunotherapies Industry Volume (K Unit) Forecast, by Application 2020 & 2033
- Table 37: Global Cell-based Immunotherapies Industry Revenue billion Forecast, by Therapy 2020 & 2033
- Table 38: Global Cell-based Immunotherapies Industry Volume K Unit Forecast, by Therapy 2020 & 2033
- Table 39: Global Cell-based Immunotherapies Industry Revenue billion Forecast, by Primary Indication 2020 & 2033
- Table 40: Global Cell-based Immunotherapies Industry Volume K Unit Forecast, by Primary Indication 2020 & 2033
- Table 41: Global Cell-based Immunotherapies Industry Revenue billion Forecast, by Country 2020 & 2033
- Table 42: Global Cell-based Immunotherapies Industry Volume K Unit Forecast, by Country 2020 & 2033
- Table 43: China Cell-based Immunotherapies Industry Revenue (billion) Forecast, by Application 2020 & 2033
- Table 44: China Cell-based Immunotherapies Industry Volume (K Unit) Forecast, by Application 2020 & 2033
- Table 45: Japan Cell-based Immunotherapies Industry Revenue (billion) Forecast, by Application 2020 & 2033
- Table 46: Japan Cell-based Immunotherapies Industry Volume (K Unit) Forecast, by Application 2020 & 2033
- Table 47: India Cell-based Immunotherapies Industry Revenue (billion) Forecast, by Application 2020 & 2033
- Table 48: India Cell-based Immunotherapies Industry Volume (K Unit) Forecast, by Application 2020 & 2033
- Table 49: Australia Cell-based Immunotherapies Industry Revenue (billion) Forecast, by Application 2020 & 2033
- Table 50: Australia Cell-based Immunotherapies Industry Volume (K Unit) Forecast, by Application 2020 & 2033
- Table 51: South Korea Cell-based Immunotherapies Industry Revenue (billion) Forecast, by Application 2020 & 2033
- Table 52: South Korea Cell-based Immunotherapies Industry Volume (K Unit) Forecast, by Application 2020 & 2033
- Table 53: Rest of Asia Pacific Cell-based Immunotherapies Industry Revenue (billion) Forecast, by Application 2020 & 2033
- Table 54: Rest of Asia Pacific Cell-based Immunotherapies Industry Volume (K Unit) Forecast, by Application 2020 & 2033
- Table 55: Global Cell-based Immunotherapies Industry Revenue billion Forecast, by Therapy 2020 & 2033
- Table 56: Global Cell-based Immunotherapies Industry Volume K Unit Forecast, by Therapy 2020 & 2033
- Table 57: Global Cell-based Immunotherapies Industry Revenue billion Forecast, by Primary Indication 2020 & 2033
- Table 58: Global Cell-based Immunotherapies Industry Volume K Unit Forecast, by Primary Indication 2020 & 2033
- Table 59: Global Cell-based Immunotherapies Industry Revenue billion Forecast, by Country 2020 & 2033
- Table 60: Global Cell-based Immunotherapies Industry Volume K Unit Forecast, by Country 2020 & 2033
- Table 61: GCC Cell-based Immunotherapies Industry Revenue (billion) Forecast, by Application 2020 & 2033
- Table 62: GCC Cell-based Immunotherapies Industry Volume (K Unit) Forecast, by Application 2020 & 2033
- Table 63: South Africa Cell-based Immunotherapies Industry Revenue (billion) Forecast, by Application 2020 & 2033
- Table 64: South Africa Cell-based Immunotherapies Industry Volume (K Unit) Forecast, by Application 2020 & 2033
- Table 65: Rest of Middle East and Africa Cell-based Immunotherapies Industry Revenue (billion) Forecast, by Application 2020 & 2033
- Table 66: Rest of Middle East and Africa Cell-based Immunotherapies Industry Volume (K Unit) Forecast, by Application 2020 & 2033
- Table 67: Global Cell-based Immunotherapies Industry Revenue billion Forecast, by Therapy 2020 & 2033
- Table 68: Global Cell-based Immunotherapies Industry Volume K Unit Forecast, by Therapy 2020 & 2033
- Table 69: Global Cell-based Immunotherapies Industry Revenue billion Forecast, by Primary Indication 2020 & 2033
- Table 70: Global Cell-based Immunotherapies Industry Volume K Unit Forecast, by Primary Indication 2020 & 2033
- Table 71: Global Cell-based Immunotherapies Industry Revenue billion Forecast, by Country 2020 & 2033
- Table 72: Global Cell-based Immunotherapies Industry Volume K Unit Forecast, by Country 2020 & 2033
- Table 73: Brazil Cell-based Immunotherapies Industry Revenue (billion) Forecast, by Application 2020 & 2033
- Table 74: Brazil Cell-based Immunotherapies Industry Volume (K Unit) Forecast, by Application 2020 & 2033
- Table 75: Argentina Cell-based Immunotherapies Industry Revenue (billion) Forecast, by Application 2020 & 2033
- Table 76: Argentina Cell-based Immunotherapies Industry Volume (K Unit) Forecast, by Application 2020 & 2033
- Table 77: Rest of South America Cell-based Immunotherapies Industry Revenue (billion) Forecast, by Application 2020 & 2033
- Table 78: Rest of South America Cell-based Immunotherapies Industry Volume (K Unit) Forecast, by Application 2020 & 2033
Frequently Asked Questions
1. What is the projected Compound Annual Growth Rate (CAGR) of the Cell-based Immunotherapies Industry?
The projected CAGR is approximately 13.9%.
2. Which companies are prominent players in the Cell-based Immunotherapies Industry?
Key companies in the market include Dendreon Pharmaceuticals LLC, Gilead Sciences Inc (Kite Pharma), Novartis AG, F Hoffmann-La Roche Ltd, GC Biopharma Corporation, GlaxoSmithKline plc, Celyad, Bristol-Myers Squibb Company, JW CreaGene Co Ltd, Johnson and Johnson (Janssen Global Services LLC), Pfizer Inc.
3. What are the main segments of the Cell-based Immunotherapies Industry?
The market segments include Therapy, Primary Indication.
4. Can you provide details about the market size?
The market size is estimated to be USD 6.56 billion as of 2022.
5. What are some drivers contributing to market growth?
Rising Prevalence of Cancer; Technological Advancement in Developing Target Based Anti-Cancer Therapies; Launches and Approval of Different Cell-based Immunotherapy Drugs.
6. What are the notable trends driving market growth?
Chimeric Antigen Receptor (CAR) T-Cell Therapy Is Expected To Witness Significant Growth Over The Forecast Period.
7. Are there any restraints impacting market growth?
High Cost of Technology; Lack of Awareness in the Developing Markets.
8. Can you provide examples of recent developments in the market?
In October 2022, Allogene Therapeutics, Inc., a clinical-stage biotechnology company pioneering the development of allogeneic CAR T (AlloCAR T) products for cancer, launched CAR T Together, a first-of-its-kind effort comprised of clinical trial investigators who represent the field of clinicians committed to supporting the development of 'off-the-shelf' (allogeneic) chimeric antigen receptor (CAR) T products to make CAR T therapy scalable and more accessible to patients with certain cancers.
9. What pricing options are available for accessing the report?
Pricing options include single-user, multi-user, and enterprise licenses priced at USD 4750, USD 5250, and USD 8750 respectively.
10. Is the market size provided in terms of value or volume?
The market size is provided in terms of value, measured in billion and volume, measured in K Unit.
11. Are there any specific market keywords associated with the report?
Yes, the market keyword associated with the report is "Cell-based Immunotherapies Industry," which aids in identifying and referencing the specific market segment covered.
12. How do I determine which pricing option suits my needs best?
The pricing options vary based on user requirements and access needs. Individual users may opt for single-user licenses, while businesses requiring broader access may choose multi-user or enterprise licenses for cost-effective access to the report.
13. Are there any additional resources or data provided in the Cell-based Immunotherapies Industry report?
While the report offers comprehensive insights, it's advisable to review the specific contents or supplementary materials provided to ascertain if additional resources or data are available.
14. How can I stay updated on further developments or reports in the Cell-based Immunotherapies Industry?
To stay informed about further developments, trends, and reports in the Cell-based Immunotherapies Industry, consider subscribing to industry newsletters, following relevant companies and organizations, or regularly checking reputable industry news sources and publications.
Methodology
Step 1 - Identification of Relevant Samples Size from Population Database


Step 2 - Approaches for Defining Global Market Size (Value, Volume* & Price*)

Note*: In applicable scenarios
Step 3 - Data Sources
Primary Research
- Web Analytics
- Survey Reports
- Research Institute
- Latest Research Reports
- Opinion Leaders
Secondary Research
- Annual Reports
- White Paper
- Latest Press Release
- Industry Association
- Paid Database
- Investor Presentations

Step 4 - Data Triangulation
Involves using different sources of information in order to increase the validity of a study
These sources are likely to be stakeholders in a program - participants, other researchers, program staff, other community members, and so on.
Then we put all data in single framework & apply various statistical tools to find out the dynamic on the market.
During the analysis stage, feedback from the stakeholder groups would be compared to determine areas of agreement as well as areas of divergence