

Key Insights
The global Cancer Immunotherapy market is poised for robust expansion, projected to reach $153.27 billion by 2025, driven by a compelling Compound Annual Growth Rate (CAGR) of 9.02% throughout the forecast period of 2025-2033. This significant growth is underpinned by the increasing prevalence of various cancers, advancements in scientific understanding of the immune system's role in combating malignancies, and a strong pipeline of innovative immunotherapeutic agents. The development and approval of novel monoclonal antibodies, cancer vaccines, immunomodulators, and immune checkpoint inhibitors are at the forefront of this market surge. These therapies offer a paradigm shift from traditional treatments, focusing on harnessing the patient's own immune system to recognize and destroy cancer cells, leading to improved patient outcomes and fewer side effects. Key applications driving this growth include prostate cancer, breast cancer, skin cancer, and lung cancer, reflecting the broad applicability of immunotherapy across diverse oncological landscapes.
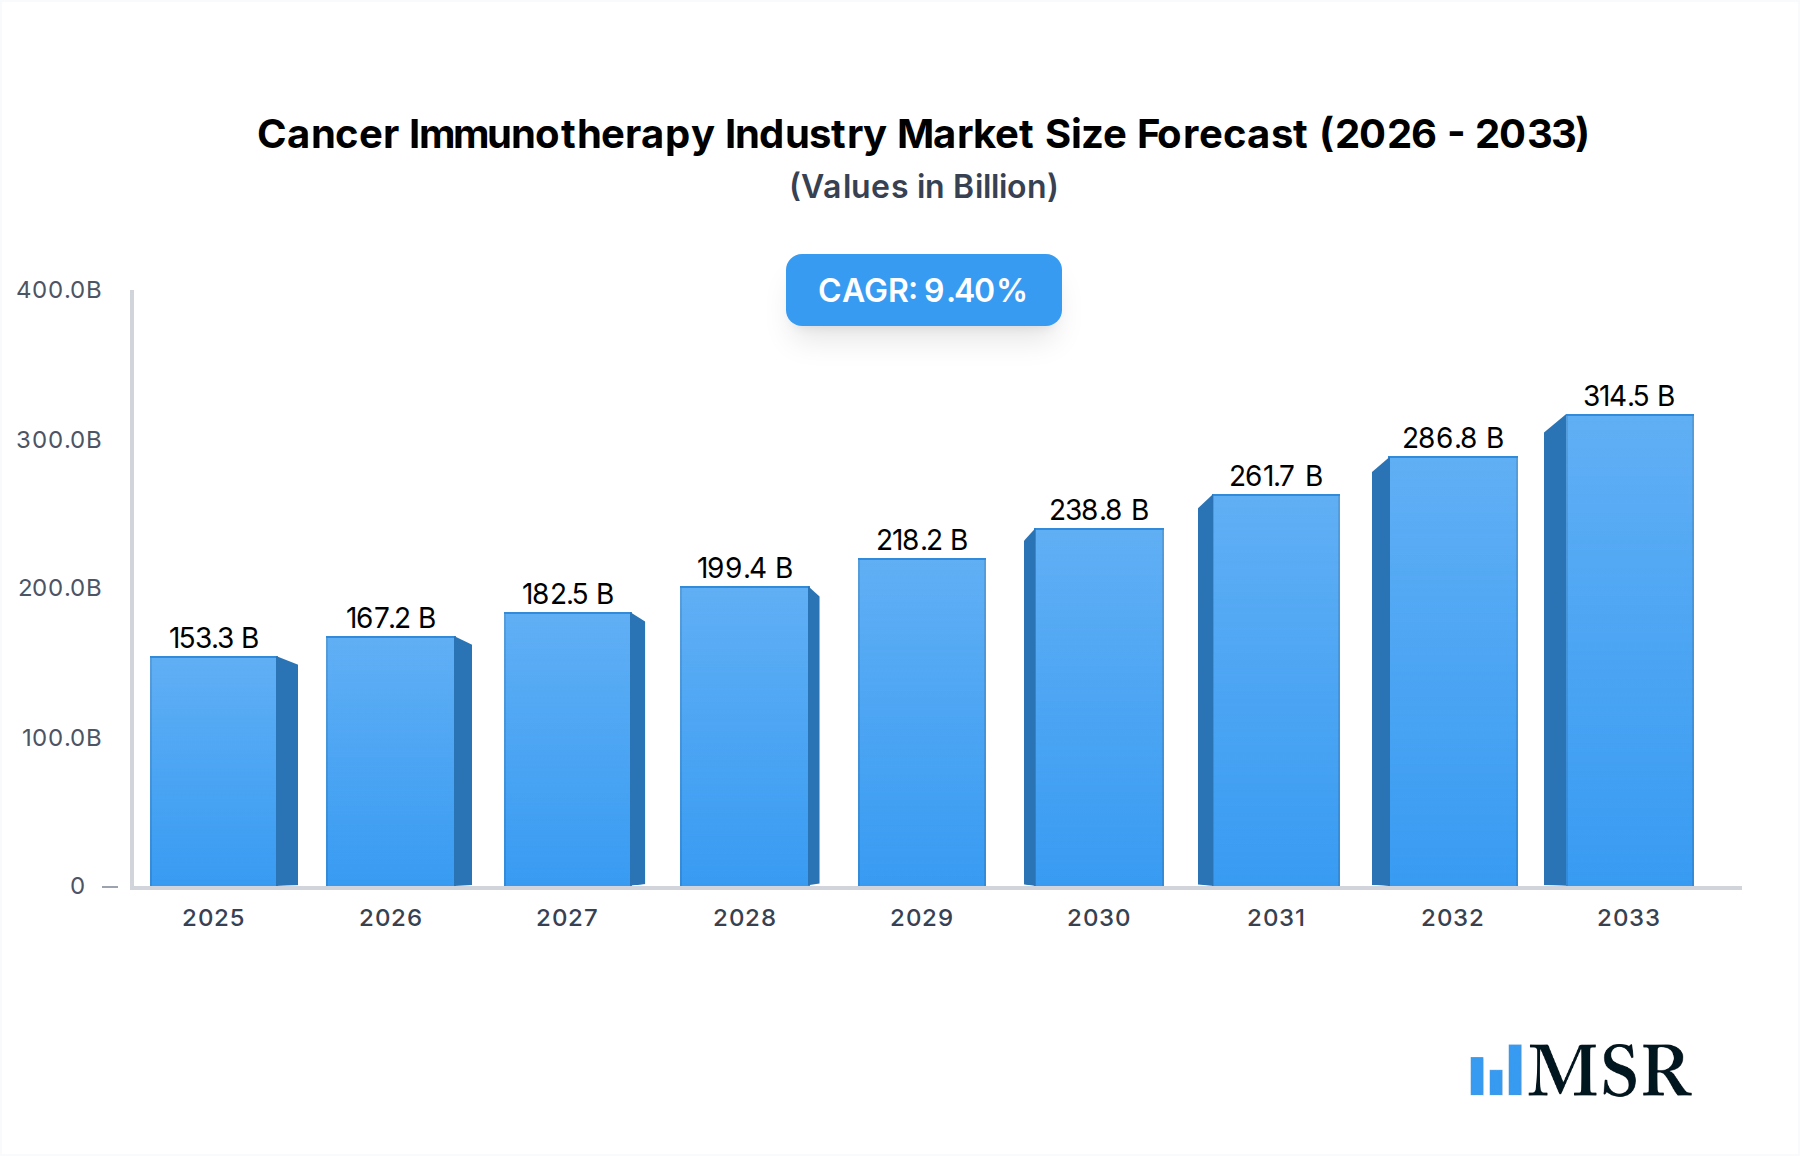
Cancer Immunotherapy Industry Market Size (In Billion)
The market's trajectory is further fueled by strategic investments in research and development by leading pharmaceutical and biotechnology companies, fostering continuous innovation. Hospitals and clinics, alongside dedicated cancer research centers, are expanding their adoption of these advanced treatments, thereby increasing accessibility. Emerging economies in the Asia Pacific region, particularly China and India, are anticipated to witness substantial growth due to rising healthcare expenditure, increasing cancer incidence, and growing awareness of immunotherapy options. While the market exhibits immense potential, factors such as high treatment costs and the need for specialized expertise for administration and patient monitoring present ongoing challenges. Nevertheless, the relentless pursuit of more effective and personalized cancer treatments, coupled with supportive regulatory frameworks, ensures a dynamic and expanding future for the Cancer Immunotherapy industry.

Cancer Immunotherapy Industry Company Market Share
Unlocking the Future of Oncology: Comprehensive Cancer Immunotherapy Industry Market Report (2019-2033)
Gain unparalleled insights into the rapidly evolving Cancer Immunotherapy Industry with this in-depth market analysis. Covering the historical period of 2019-2024 and projecting growth through 2033, this report provides critical data and actionable intelligence for pharmaceutical giants, biotech innovators, investors, and healthcare providers.
Keywords: Cancer Immunotherapy Market, Oncology Market, Monoclonal Antibodies, Cancer Vaccines, Immune Check Point Inhibitors, Immuno-oncology, Pharmaceutical Market, Biotechnology Market, Prostate Cancer Treatment, Breast Cancer Treatment, Lung Cancer Treatment, Pharmaceutical M&A, Healthcare Investment, Oncology Drug Development, Cancer Research, Bayer AG, Novartis AG, Astellas Pharma Inc, Amgen Inc, Gilead Sciences, OSE Immunotherapeutics, Seattle Genetics Inc, AstraZeneca PLC, Eli Lilly and Company, Bristol-Myers Squibb, Merck and Co Inc, GlaxoSmithKline PLC, F Hoffman La Roche Ltd, Pfizer Inc.
Cancer Immunotherapy Industry Market Concentration & Dynamics
The Cancer Immunotherapy Industry is characterized by a moderate to high level of market concentration, with a few dominant players controlling significant market share. Key companies like Bristol-Myers Squibb, Merck and Co Inc, F Hoffman La Roche Ltd, and Pfizer Inc consistently lead in the development and commercialization of cutting-edge immuno-oncology treatments, particularly immune check point inhibitors. The innovation ecosystem is vibrant, fueled by substantial R&D investments and strategic collaborations between pharmaceutical giants and agile biotechnology firms. Regulatory frameworks, while rigorous, are adapting to expedite the approval of novel immunotherapies, fostering a dynamic landscape. Substitute products, primarily traditional chemotherapy and radiation, are gradually being displaced by the efficacy and improved patient outcomes offered by immunotherapies. End-user trends show an increasing demand for personalized treatment options and therapies with fewer side effects. Merger and acquisition (M&A) activities are prevalent, with an estimated XX deal counts observed in the historical period, signaling consolidation and strategic expansion by larger entities seeking to bolster their portfolios and gain access to promising pipeline assets. For instance, prominent M&A activities have been noted involving companies like Astellas Pharma Inc and Seattle Genetics Inc, aimed at acquiring innovative technologies. The market share distribution, with major players holding an estimated XX% of the total market, underscores the competitive intensity and the significant investment required to maintain a leading position.
Cancer Immunotherapy Industry Industry Insights & Trends
The Cancer Immunotherapy Industry is poised for exceptional growth, driven by a confluence of factors including an increasing global cancer incidence, significant advancements in understanding the human immune system's role in combating malignancies, and a robust pipeline of innovative therapeutic candidates. The market size is projected to reach an estimated USD 300 billion by 2033, exhibiting a Compound Annual Growth Rate (CAGR) of approximately 18% during the forecast period of 2025–2033. Technological disruptions, particularly in areas like CAR T-cell therapy, bispecific antibodies, and oncolytic viruses, are transforming treatment paradigms and expanding the therapeutic arsenal against a wider spectrum of cancers. Evolving consumer behaviors, influenced by increased patient awareness, demand for minimally invasive treatments, and a preference for therapies with improved quality of life, are further fueling the adoption of immunotherapies. The increasing prevalence of hard-to-treat cancers, such as advanced melanoma and certain types of lung cancer, where immunotherapies have demonstrated remarkable efficacy, acts as a significant growth catalyst. Furthermore, the ongoing research and development efforts by leading companies, including Novartis AG and Eli Lilly and Company, to develop next-generation immunotherapies with enhanced specificity and reduced toxicity, are crucial drivers. The integration of artificial intelligence and machine learning in drug discovery and patient stratification is accelerating the development cycle and improving treatment outcomes, contributing to the optimistic market outlook. The market is also witnessing a trend towards combination therapies, where immunotherapies are being combined with other treatment modalities to achieve synergistic effects and overcome treatment resistance, further expanding their application scope.
Key Markets & Segments Leading Cancer Immunotherapy Industry
The Immune Check Point Inhibitors segment is a dominant force within the Cancer Immunotherapy Industry, driven by their profound efficacy in treating various solid and hematological malignancies. This segment alone accounted for an estimated XX% of the total market revenue in the base year of 2025 and is projected to continue its leadership throughout the forecast period. The application of immune check point inhibitors in Lung Cancer and Breast Cancer has been particularly transformative, leading to improved survival rates and patient outcomes. For instance, the widespread adoption of these therapies in non-small cell lung cancer (NSCLC) has revolutionized its management, making it a key driver for market growth. Similarly, advancements in treating metastatic breast cancer with immunotherapies are expanding the addressable market.
- Therapy Type Dominance: Immune Check Point Inhibitors lead due to their well-established efficacy and broad applicability. Monoclonal Antibodies follow closely, with significant contributions in targeted therapy and direct immune cell activation. Cancer Vaccines and Immunomodulators are emerging segments with substantial future potential, especially in combination therapies and personalized medicine approaches.
- Application Leadership: Lung Cancer and Breast Cancer applications are at the forefront, owing to the high disease burden and the proven success of immunotherapies in these areas. Prostate Cancer and Skin Cancer (melanoma) also represent significant and growing application segments.
- End User Influence: Hospitals and Clinics constitute the primary end-user segment, driven by the inpatient and outpatient administration of immunotherapies and the need for specialized oncology care. Cancer Research Centers play a crucial role in driving innovation and clinical validation of new therapies.
- Regional Dynamics: North America, particularly the United States, leads the global market due to high healthcare spending, robust R&D infrastructure, and early adoption of novel therapies. Europe follows, with a strong presence of leading pharmaceutical companies like Bayer AG and GlaxoSmithKline PLC, and a growing focus on personalized medicine. The Asia-Pacific region is exhibiting the fastest growth, fueled by increasing cancer rates, improving healthcare infrastructure, and expanding access to advanced treatments, with countries like China and Japan emerging as key markets. Economic growth in these regions supports increased investment in advanced cancer treatments.
Cancer Immunotherapy Industry Product Developments
The Cancer Immunotherapy Industry is experiencing a surge in product innovation. Recent developments include the approval of novel CAR T-cell therapies for specific hematological cancers, the advancement of bispecific antibodies targeting multiple tumor-associated antigens, and the refinement of mRNA-based cancer vaccines for personalized treatment. These advancements, championed by companies like Gilead Sciences and OSE Immunotherapeutics, are expanding the therapeutic landscape, offering new hope for patients with limited treatment options. The market relevance of these products is directly tied to their improved efficacy, reduced toxicity profiles, and ability to address unmet clinical needs across various cancer types.
Challenges in the Cancer Immunotherapy Industry Market
Despite the immense promise, the Cancer Immunotherapy Industry faces significant challenges. High development costs and lengthy clinical trial durations, estimated to cost upwards of USD 2 billion per drug, present a substantial barrier. Regulatory hurdles, although evolving, can still delay market access for novel therapies. Supply chain complexities for biologics and cell therapies require robust infrastructure and stringent quality control, with potential disruptions impacting availability. Competitive pressures from both established players and emerging biotechs necessitate continuous innovation. Furthermore, the management of immune-related adverse events (irAEs) remains a critical concern, requiring specialized patient monitoring and management protocols, impacting an estimated XX% of treated patients.
Forces Driving Cancer Immunotherapy Industry Growth
Several powerful forces are propelling the growth of the Cancer Immunotherapy Industry. Technological advancements in immunology and molecular biology have unlocked new therapeutic targets and strategies. Growing global cancer incidence, coupled with an aging population, creates a persistent and expanding demand for effective treatments. Supportive government initiatives and regulatory pathways designed to expedite the approval of life-saving therapies further bolster growth. Significant R&D investments by major players like AstraZeneca PLC and Amgen Inc, alongside venture capital funding for biotech startups, fuel the innovation pipeline. Increased healthcare expenditure globally, particularly in emerging economies, enhances market access and affordability.
Challenges in the Cancer Immunotherapy Industry Market
Long-term growth catalysts in the Cancer Immunotherapy Industry are deeply rooted in sustained innovation and strategic market expansion. The continued exploration of novel immunotherapy combinations, synergistic approaches with targeted therapies and radiation, and the development of therapies for previously intractable cancers will be pivotal. Expansion into underserved patient populations and geographical markets, especially in the Asia-Pacific region, presents significant untapped potential. Furthermore, advancements in biomarkers for patient selection and treatment response prediction will optimize therapy utilization and improve patient outcomes, driving sustained market adoption and growth.
Emerging Opportunities in Cancer Immunotherapy Industry
Emerging opportunities in the Cancer Immunotherapy Industry are abundant. The development of off-the-shelf (allogeneic) cell therapies promises to overcome the manufacturing and cost limitations of autologous approaches. The exploration of the tumor microenvironment and the gut microbiome's influence on immunotherapy response opens avenues for novel therapeutic strategies. Personalized cancer vaccines, leveraging individual tumor neoantigens, are gaining traction. Furthermore, the application of immunotherapies in earlier stages of cancer treatment, including adjuvant and neoadjuvant settings, represents a significant expansion of the market. The increasing use of AI in drug discovery and patient stratification presents a transformative opportunity for more efficient and effective treatment development.
Leading Players in the Cancer Immunotherapy Industry Sector
- Bayer AG
- Novartis AG
- Astellas Pharma Inc
- Amgen Inc
- Gilead Sciences
- OSE Immunotherapeutics
- Seattle Genetics Inc
- AstraZeneca PLC
- Eli Lilly and Company
- Bristol-Myers Squibb
- Merck and Co Inc
- GlaxoSmithKline PLC
- F Hoffman La Roche Ltd
- Pfizer Inc
Key Milestones in Cancer Immunotherapy Industry Industry
- 2019: FDA approval of new indications for existing immune check point inhibitors, expanding their use in earlier stages of cancer.
- 2020: Significant advancements in CAR T-cell therapy research, with promising clinical trial data for new targets.
- 2021: Increased M&A activity, with several acquisitions of early-stage immuno-oncology companies by larger pharmaceutical firms.
- 2022: Introduction of novel bispecific antibodies demonstrating enhanced efficacy and safety profiles.
- 2023: Growing interest and investment in mRNA-based cancer vaccines, with promising preclinical and early-stage clinical results.
- 2024: Emergence of combination therapies involving immunotherapies with targeted agents showing synergistic effects.
Strategic Outlook for Cancer Immunotherapy Industry Market
The strategic outlook for the Cancer Immunotherapy Industry is exceptionally strong, driven by continuous innovation and expanding therapeutic applications. Key growth accelerators will include the development of next-generation immunotherapies with improved precision and reduced toxicity, the widespread adoption of combination strategies, and the successful penetration of emerging markets. Strategic partnerships between pharmaceutical companies, academic institutions, and biotech firms will remain crucial for fostering innovation and accelerating drug development. Furthermore, the focus on personalized medicine, supported by advancements in diagnostics and predictive biomarkers, will optimize treatment outcomes and drive market growth. The industry's trajectory points towards increasingly effective and patient-centric cancer care solutions.
Cancer Immunotherapy Industry Segmentation
-
1. Therapy Type
- 1.1. Monoclonal Antibodies
- 1.2. Cancer Vaccines
- 1.3. Immunomodulators
- 1.4. Immune Check Point Inhibitors
- 1.5. Other Therapy Types
-
2. Application
- 2.1. Prostate Cancer
- 2.2. Breast Cancer
- 2.3. Skin Cancer
- 2.4. Lung Cancer
- 2.5. Other Applications
-
3. End Users
- 3.1. Hospitals and Clinics
- 3.2. Cancer Research Centers
- 3.3. Other End Users
Cancer Immunotherapy Industry Segmentation By Geography
-
1. North America
- 1.1. United States
- 1.2. Canada
- 1.3. Mexico
-
2. Europe
- 2.1. Germany
- 2.2. United Kingdom
- 2.3. France
- 2.4. Italy
- 2.5. Spain
- 2.6. Rest of Europe
-
3. Asia Pacific
- 3.1. China
- 3.2. Japan
- 3.3. India
- 3.4. Australia
- 3.5. South Korea
- 3.6. Rest of Asia Pacific
-
4. Middle East and Africa
- 4.1. GCC
- 4.2. South Africa
- 4.3. Rest of Middle East and Africa
-
5. South America
- 5.1. Brazil
- 5.2. Argentina
- 5.3. Rest of South America
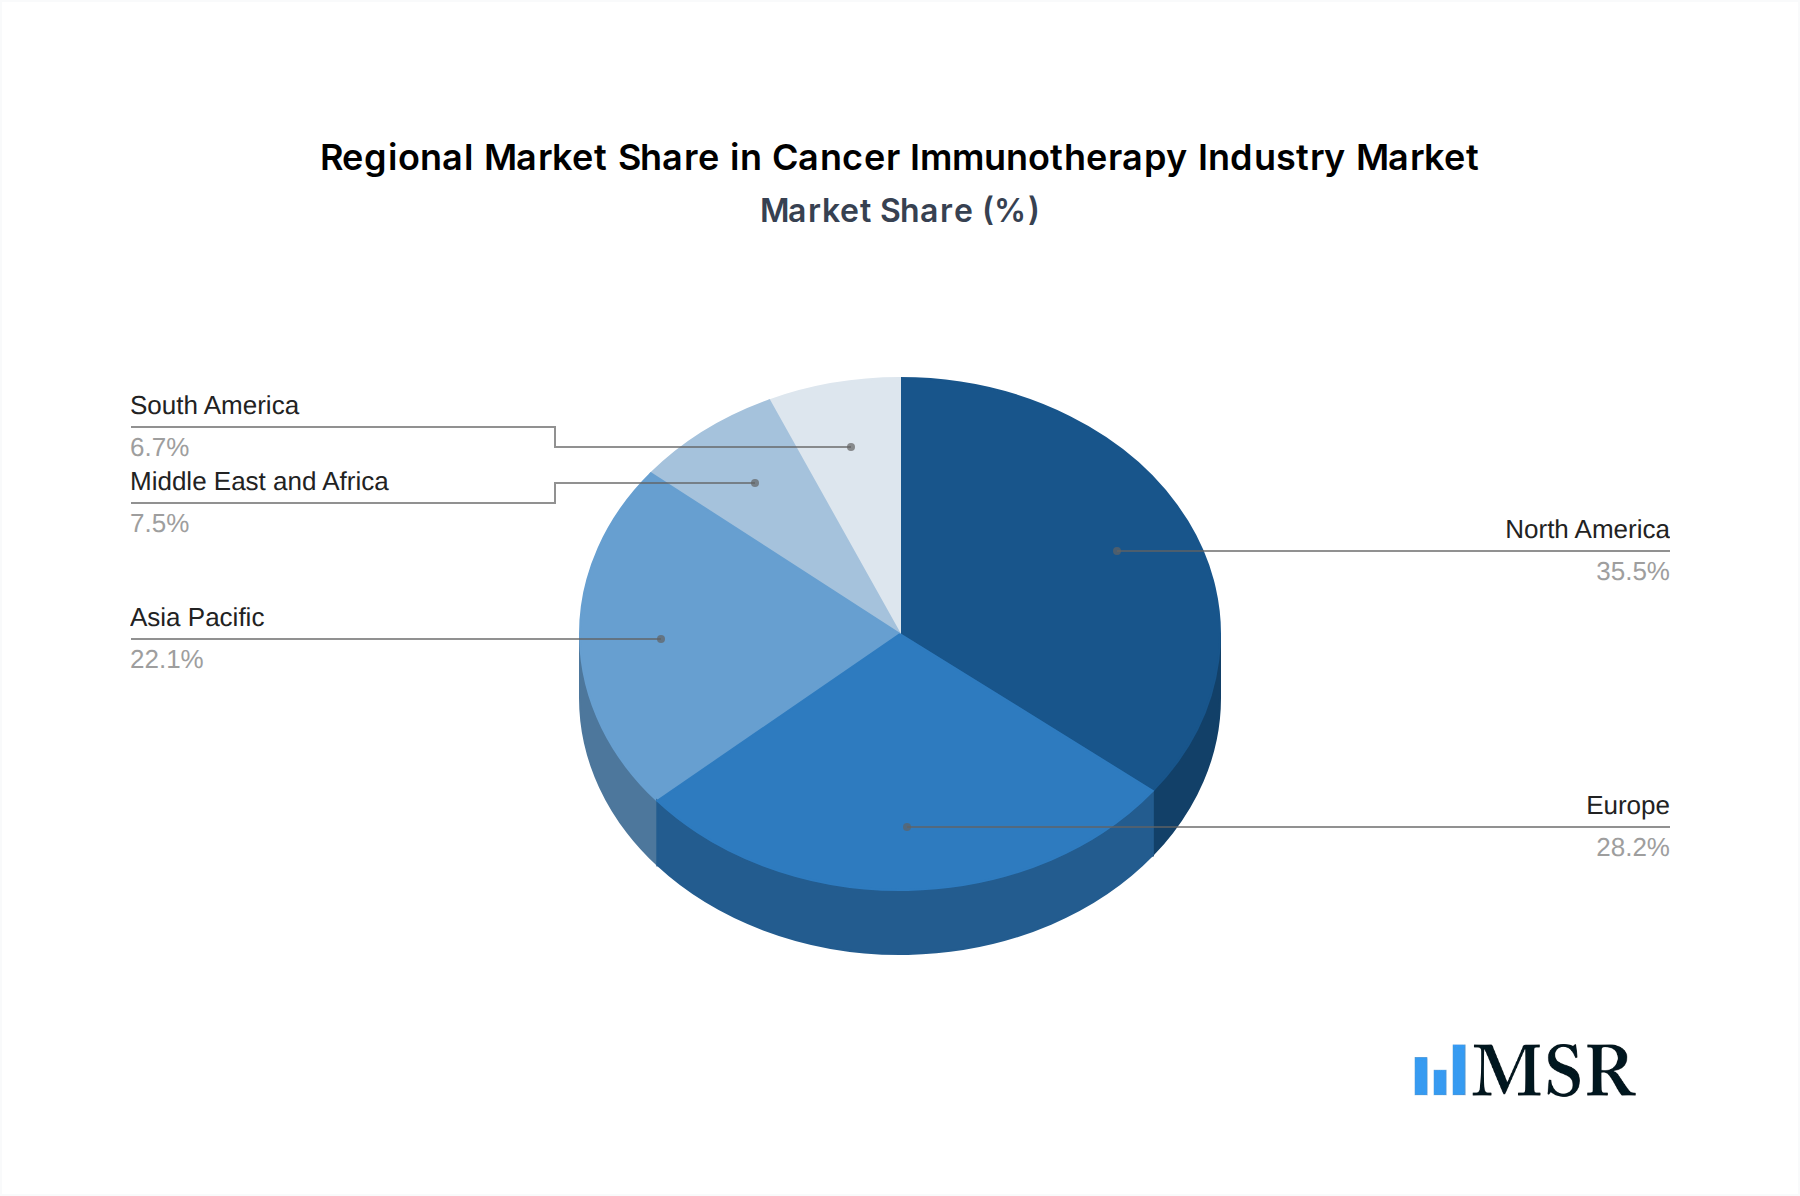
Cancer Immunotherapy Industry Regional Market Share
Geographic Coverage of Cancer Immunotherapy Industry
Cancer Immunotherapy Industry REPORT HIGHLIGHTS
| Aspects | Details |
|---|---|
| Study Period | 2020-2034 |
| Base Year | 2025 |
| Estimated Year | 2026 |
| Forecast Period | 2026-2034 |
| Historical Period | 2020-2025 |
| Growth Rate | CAGR of 9.02% from 2020-2034 |
| Segmentation |
|
Table of Contents
- 1. Introduction
- 1.1. Research Scope
- 1.2. Market Segmentation
- 1.3. Research Objective
- 1.4. Definitions and Assumptions
- 2. Executive Summary
- 2.1. Market Snapshot
- 3. Market Dynamics
- 3.1. Market Drivers
- 3.2. Market Restrains
- 3.3. Market Trends
- 3.4. Market Opportunities
- 4. Market Factor Analysis
- 4.1. Porters Five Forces
- 4.1.1. Bargaining Power of Suppliers
- 4.1.2. Bargaining Power of Buyers
- 4.1.3. Threat of New Entrants
- 4.1.4. Threat of Substitutes
- 4.1.5. Competitive Rivalry
- 4.2. PESTEL analysis
- 4.3. BCG Analysis
- 4.3.1. Stars (High Growth, High Market Share)
- 4.3.2. Cash Cows (Low Growth, High Market Share)
- 4.3.3. Question Mark (High Growth, Low Market Share)
- 4.3.4. Dogs (Low Growth, Low Market Share)
- 4.4. Ansoff Matrix Analysis
- 4.5. Supply Chain Analysis
- 4.6. Regulatory Landscape
- 4.7. Current Market Potential and Opportunity Assessment (TAM–SAM–SOM Framework)
- 4.8. MSR Analyst Note
- 4.1. Porters Five Forces
- 5. Market Analysis, Insights and Forecast 2021-2033
- 5.1. Market Analysis, Insights and Forecast - by Therapy Type
- 5.1.1. Monoclonal Antibodies
- 5.1.2. Cancer Vaccines
- 5.1.3. Immunomodulators
- 5.1.4. Immune Check Point Inhibitors
- 5.1.5. Other Therapy Types
- 5.2. Market Analysis, Insights and Forecast - by Application
- 5.2.1. Prostate Cancer
- 5.2.2. Breast Cancer
- 5.2.3. Skin Cancer
- 5.2.4. Lung Cancer
- 5.2.5. Other Applications
- 5.3. Market Analysis, Insights and Forecast - by End Users
- 5.3.1. Hospitals and Clinics
- 5.3.2. Cancer Research Centers
- 5.3.3. Other End Users
- 5.4. Market Analysis, Insights and Forecast - by Region
- 5.4.1. North America
- 5.4.2. Europe
- 5.4.3. Asia Pacific
- 5.4.4. Middle East and Africa
- 5.4.5. South America
- 5.1. Market Analysis, Insights and Forecast - by Therapy Type
- 6. Global Cancer Immunotherapy Industry Analysis, Insights and Forecast, 2021-2033
- 6.1. Market Analysis, Insights and Forecast - by Therapy Type
- 6.1.1. Monoclonal Antibodies
- 6.1.2. Cancer Vaccines
- 6.1.3. Immunomodulators
- 6.1.4. Immune Check Point Inhibitors
- 6.1.5. Other Therapy Types
- 6.2. Market Analysis, Insights and Forecast - by Application
- 6.2.1. Prostate Cancer
- 6.2.2. Breast Cancer
- 6.2.3. Skin Cancer
- 6.2.4. Lung Cancer
- 6.2.5. Other Applications
- 6.3. Market Analysis, Insights and Forecast - by End Users
- 6.3.1. Hospitals and Clinics
- 6.3.2. Cancer Research Centers
- 6.3.3. Other End Users
- 6.1. Market Analysis, Insights and Forecast - by Therapy Type
- 7. North America Cancer Immunotherapy Industry Analysis, Insights and Forecast, 2020-2032
- 7.1. Market Analysis, Insights and Forecast - by Therapy Type
- 7.1.1. Monoclonal Antibodies
- 7.1.2. Cancer Vaccines
- 7.1.3. Immunomodulators
- 7.1.4. Immune Check Point Inhibitors
- 7.1.5. Other Therapy Types
- 7.2. Market Analysis, Insights and Forecast - by Application
- 7.2.1. Prostate Cancer
- 7.2.2. Breast Cancer
- 7.2.3. Skin Cancer
- 7.2.4. Lung Cancer
- 7.2.5. Other Applications
- 7.3. Market Analysis, Insights and Forecast - by End Users
- 7.3.1. Hospitals and Clinics
- 7.3.2. Cancer Research Centers
- 7.3.3. Other End Users
- 7.1. Market Analysis, Insights and Forecast - by Therapy Type
- 8. Europe Cancer Immunotherapy Industry Analysis, Insights and Forecast, 2020-2032
- 8.1. Market Analysis, Insights and Forecast - by Therapy Type
- 8.1.1. Monoclonal Antibodies
- 8.1.2. Cancer Vaccines
- 8.1.3. Immunomodulators
- 8.1.4. Immune Check Point Inhibitors
- 8.1.5. Other Therapy Types
- 8.2. Market Analysis, Insights and Forecast - by Application
- 8.2.1. Prostate Cancer
- 8.2.2. Breast Cancer
- 8.2.3. Skin Cancer
- 8.2.4. Lung Cancer
- 8.2.5. Other Applications
- 8.3. Market Analysis, Insights and Forecast - by End Users
- 8.3.1. Hospitals and Clinics
- 8.3.2. Cancer Research Centers
- 8.3.3. Other End Users
- 8.1. Market Analysis, Insights and Forecast - by Therapy Type
- 9. Asia Pacific Cancer Immunotherapy Industry Analysis, Insights and Forecast, 2020-2032
- 9.1. Market Analysis, Insights and Forecast - by Therapy Type
- 9.1.1. Monoclonal Antibodies
- 9.1.2. Cancer Vaccines
- 9.1.3. Immunomodulators
- 9.1.4. Immune Check Point Inhibitors
- 9.1.5. Other Therapy Types
- 9.2. Market Analysis, Insights and Forecast - by Application
- 9.2.1. Prostate Cancer
- 9.2.2. Breast Cancer
- 9.2.3. Skin Cancer
- 9.2.4. Lung Cancer
- 9.2.5. Other Applications
- 9.3. Market Analysis, Insights and Forecast - by End Users
- 9.3.1. Hospitals and Clinics
- 9.3.2. Cancer Research Centers
- 9.3.3. Other End Users
- 9.1. Market Analysis, Insights and Forecast - by Therapy Type
- 10. Middle East and Africa Cancer Immunotherapy Industry Analysis, Insights and Forecast, 2020-2032
- 10.1. Market Analysis, Insights and Forecast - by Therapy Type
- 10.1.1. Monoclonal Antibodies
- 10.1.2. Cancer Vaccines
- 10.1.3. Immunomodulators
- 10.1.4. Immune Check Point Inhibitors
- 10.1.5. Other Therapy Types
- 10.2. Market Analysis, Insights and Forecast - by Application
- 10.2.1. Prostate Cancer
- 10.2.2. Breast Cancer
- 10.2.3. Skin Cancer
- 10.2.4. Lung Cancer
- 10.2.5. Other Applications
- 10.3. Market Analysis, Insights and Forecast - by End Users
- 10.3.1. Hospitals and Clinics
- 10.3.2. Cancer Research Centers
- 10.3.3. Other End Users
- 10.1. Market Analysis, Insights and Forecast - by Therapy Type
- 11. South America Cancer Immunotherapy Industry Analysis, Insights and Forecast, 2020-2032
- 11.1. Market Analysis, Insights and Forecast - by Therapy Type
- 11.1.1. Monoclonal Antibodies
- 11.1.2. Cancer Vaccines
- 11.1.3. Immunomodulators
- 11.1.4. Immune Check Point Inhibitors
- 11.1.5. Other Therapy Types
- 11.2. Market Analysis, Insights and Forecast - by Application
- 11.2.1. Prostate Cancer
- 11.2.2. Breast Cancer
- 11.2.3. Skin Cancer
- 11.2.4. Lung Cancer
- 11.2.5. Other Applications
- 11.3. Market Analysis, Insights and Forecast - by End Users
- 11.3.1. Hospitals and Clinics
- 11.3.2. Cancer Research Centers
- 11.3.3. Other End Users
- 11.1. Market Analysis, Insights and Forecast - by Therapy Type
- 12. Competitive Analysis
- 12.1. Company Profiles
- 12.1.1 Bayer AG
- 12.1.1.1. Company Overview
- 12.1.1.2. Products
- 12.1.1.3. Company Financials
- 12.1.1.4. SWOT Analysis
- 12.1.2 Novartis AG
- 12.1.2.1. Company Overview
- 12.1.2.2. Products
- 12.1.2.3. Company Financials
- 12.1.2.4. SWOT Analysis
- 12.1.3 Astellas Pharma Inc
- 12.1.3.1. Company Overview
- 12.1.3.2. Products
- 12.1.3.3. Company Financials
- 12.1.3.4. SWOT Analysis
- 12.1.4 Amgen Inc
- 12.1.4.1. Company Overview
- 12.1.4.2. Products
- 12.1.4.3. Company Financials
- 12.1.4.4. SWOT Analysis
- 12.1.5 Gilead Sciences
- 12.1.5.1. Company Overview
- 12.1.5.2. Products
- 12.1.5.3. Company Financials
- 12.1.5.4. SWOT Analysis
- 12.1.6 OSE Immunotherapeutics
- 12.1.6.1. Company Overview
- 12.1.6.2. Products
- 12.1.6.3. Company Financials
- 12.1.6.4. SWOT Analysis
- 12.1.7 Seattle Genetics Inc
- 12.1.7.1. Company Overview
- 12.1.7.2. Products
- 12.1.7.3. Company Financials
- 12.1.7.4. SWOT Analysis
- 12.1.8 AstraZeneca PLC
- 12.1.8.1. Company Overview
- 12.1.8.2. Products
- 12.1.8.3. Company Financials
- 12.1.8.4. SWOT Analysis
- 12.1.9 Eli Lilly and Company
- 12.1.9.1. Company Overview
- 12.1.9.2. Products
- 12.1.9.3. Company Financials
- 12.1.9.4. SWOT Analysis
- 12.1.10 Bristol-Myers Squibb
- 12.1.10.1. Company Overview
- 12.1.10.2. Products
- 12.1.10.3. Company Financials
- 12.1.10.4. SWOT Analysis
- 12.1.11 Merck and Co Inc
- 12.1.11.1. Company Overview
- 12.1.11.2. Products
- 12.1.11.3. Company Financials
- 12.1.11.4. SWOT Analysis
- 12.1.12 GlaxoSmithKline PLC
- 12.1.12.1. Company Overview
- 12.1.12.2. Products
- 12.1.12.3. Company Financials
- 12.1.12.4. SWOT Analysis
- 12.1.13 F Hoffman La Roche Ltd
- 12.1.13.1. Company Overview
- 12.1.13.2. Products
- 12.1.13.3. Company Financials
- 12.1.13.4. SWOT Analysis
- 12.1.14 Pfizer Inc
- 12.1.14.1. Company Overview
- 12.1.14.2. Products
- 12.1.14.3. Company Financials
- 12.1.14.4. SWOT Analysis
- 12.1.1 Bayer AG
- 12.2. Market Entropy
- 12.2.1 Company's Key Areas Served
- 12.2.2 Recent Developments
- 12.3. Company Market Share Analysis 2025
- 12.3.1 Top 5 Companies Market Share Analysis
- 12.3.2 Top 3 Companies Market Share Analysis
- 12.4. List of Potential Customers
- 13. Research Methodology
List of Figures
- Figure 1: Global Cancer Immunotherapy Industry Revenue Breakdown (billion, %) by Region 2025 & 2033
- Figure 2: Global Cancer Immunotherapy Industry Volume Breakdown (K Unit, %) by Region 2025 & 2033
- Figure 3: North America Cancer Immunotherapy Industry Revenue (billion), by Therapy Type 2025 & 2033
- Figure 4: North America Cancer Immunotherapy Industry Volume (K Unit), by Therapy Type 2025 & 2033
- Figure 5: North America Cancer Immunotherapy Industry Revenue Share (%), by Therapy Type 2025 & 2033
- Figure 6: North America Cancer Immunotherapy Industry Volume Share (%), by Therapy Type 2025 & 2033
- Figure 7: North America Cancer Immunotherapy Industry Revenue (billion), by Application 2025 & 2033
- Figure 8: North America Cancer Immunotherapy Industry Volume (K Unit), by Application 2025 & 2033
- Figure 9: North America Cancer Immunotherapy Industry Revenue Share (%), by Application 2025 & 2033
- Figure 10: North America Cancer Immunotherapy Industry Volume Share (%), by Application 2025 & 2033
- Figure 11: North America Cancer Immunotherapy Industry Revenue (billion), by End Users 2025 & 2033
- Figure 12: North America Cancer Immunotherapy Industry Volume (K Unit), by End Users 2025 & 2033
- Figure 13: North America Cancer Immunotherapy Industry Revenue Share (%), by End Users 2025 & 2033
- Figure 14: North America Cancer Immunotherapy Industry Volume Share (%), by End Users 2025 & 2033
- Figure 15: North America Cancer Immunotherapy Industry Revenue (billion), by Country 2025 & 2033
- Figure 16: North America Cancer Immunotherapy Industry Volume (K Unit), by Country 2025 & 2033
- Figure 17: North America Cancer Immunotherapy Industry Revenue Share (%), by Country 2025 & 2033
- Figure 18: North America Cancer Immunotherapy Industry Volume Share (%), by Country 2025 & 2033
- Figure 19: Europe Cancer Immunotherapy Industry Revenue (billion), by Therapy Type 2025 & 2033
- Figure 20: Europe Cancer Immunotherapy Industry Volume (K Unit), by Therapy Type 2025 & 2033
- Figure 21: Europe Cancer Immunotherapy Industry Revenue Share (%), by Therapy Type 2025 & 2033
- Figure 22: Europe Cancer Immunotherapy Industry Volume Share (%), by Therapy Type 2025 & 2033
- Figure 23: Europe Cancer Immunotherapy Industry Revenue (billion), by Application 2025 & 2033
- Figure 24: Europe Cancer Immunotherapy Industry Volume (K Unit), by Application 2025 & 2033
- Figure 25: Europe Cancer Immunotherapy Industry Revenue Share (%), by Application 2025 & 2033
- Figure 26: Europe Cancer Immunotherapy Industry Volume Share (%), by Application 2025 & 2033
- Figure 27: Europe Cancer Immunotherapy Industry Revenue (billion), by End Users 2025 & 2033
- Figure 28: Europe Cancer Immunotherapy Industry Volume (K Unit), by End Users 2025 & 2033
- Figure 29: Europe Cancer Immunotherapy Industry Revenue Share (%), by End Users 2025 & 2033
- Figure 30: Europe Cancer Immunotherapy Industry Volume Share (%), by End Users 2025 & 2033
- Figure 31: Europe Cancer Immunotherapy Industry Revenue (billion), by Country 2025 & 2033
- Figure 32: Europe Cancer Immunotherapy Industry Volume (K Unit), by Country 2025 & 2033
- Figure 33: Europe Cancer Immunotherapy Industry Revenue Share (%), by Country 2025 & 2033
- Figure 34: Europe Cancer Immunotherapy Industry Volume Share (%), by Country 2025 & 2033
- Figure 35: Asia Pacific Cancer Immunotherapy Industry Revenue (billion), by Therapy Type 2025 & 2033
- Figure 36: Asia Pacific Cancer Immunotherapy Industry Volume (K Unit), by Therapy Type 2025 & 2033
- Figure 37: Asia Pacific Cancer Immunotherapy Industry Revenue Share (%), by Therapy Type 2025 & 2033
- Figure 38: Asia Pacific Cancer Immunotherapy Industry Volume Share (%), by Therapy Type 2025 & 2033
- Figure 39: Asia Pacific Cancer Immunotherapy Industry Revenue (billion), by Application 2025 & 2033
- Figure 40: Asia Pacific Cancer Immunotherapy Industry Volume (K Unit), by Application 2025 & 2033
- Figure 41: Asia Pacific Cancer Immunotherapy Industry Revenue Share (%), by Application 2025 & 2033
- Figure 42: Asia Pacific Cancer Immunotherapy Industry Volume Share (%), by Application 2025 & 2033
- Figure 43: Asia Pacific Cancer Immunotherapy Industry Revenue (billion), by End Users 2025 & 2033
- Figure 44: Asia Pacific Cancer Immunotherapy Industry Volume (K Unit), by End Users 2025 & 2033
- Figure 45: Asia Pacific Cancer Immunotherapy Industry Revenue Share (%), by End Users 2025 & 2033
- Figure 46: Asia Pacific Cancer Immunotherapy Industry Volume Share (%), by End Users 2025 & 2033
- Figure 47: Asia Pacific Cancer Immunotherapy Industry Revenue (billion), by Country 2025 & 2033
- Figure 48: Asia Pacific Cancer Immunotherapy Industry Volume (K Unit), by Country 2025 & 2033
- Figure 49: Asia Pacific Cancer Immunotherapy Industry Revenue Share (%), by Country 2025 & 2033
- Figure 50: Asia Pacific Cancer Immunotherapy Industry Volume Share (%), by Country 2025 & 2033
- Figure 51: Middle East and Africa Cancer Immunotherapy Industry Revenue (billion), by Therapy Type 2025 & 2033
- Figure 52: Middle East and Africa Cancer Immunotherapy Industry Volume (K Unit), by Therapy Type 2025 & 2033
- Figure 53: Middle East and Africa Cancer Immunotherapy Industry Revenue Share (%), by Therapy Type 2025 & 2033
- Figure 54: Middle East and Africa Cancer Immunotherapy Industry Volume Share (%), by Therapy Type 2025 & 2033
- Figure 55: Middle East and Africa Cancer Immunotherapy Industry Revenue (billion), by Application 2025 & 2033
- Figure 56: Middle East and Africa Cancer Immunotherapy Industry Volume (K Unit), by Application 2025 & 2033
- Figure 57: Middle East and Africa Cancer Immunotherapy Industry Revenue Share (%), by Application 2025 & 2033
- Figure 58: Middle East and Africa Cancer Immunotherapy Industry Volume Share (%), by Application 2025 & 2033
- Figure 59: Middle East and Africa Cancer Immunotherapy Industry Revenue (billion), by End Users 2025 & 2033
- Figure 60: Middle East and Africa Cancer Immunotherapy Industry Volume (K Unit), by End Users 2025 & 2033
- Figure 61: Middle East and Africa Cancer Immunotherapy Industry Revenue Share (%), by End Users 2025 & 2033
- Figure 62: Middle East and Africa Cancer Immunotherapy Industry Volume Share (%), by End Users 2025 & 2033
- Figure 63: Middle East and Africa Cancer Immunotherapy Industry Revenue (billion), by Country 2025 & 2033
- Figure 64: Middle East and Africa Cancer Immunotherapy Industry Volume (K Unit), by Country 2025 & 2033
- Figure 65: Middle East and Africa Cancer Immunotherapy Industry Revenue Share (%), by Country 2025 & 2033
- Figure 66: Middle East and Africa Cancer Immunotherapy Industry Volume Share (%), by Country 2025 & 2033
- Figure 67: South America Cancer Immunotherapy Industry Revenue (billion), by Therapy Type 2025 & 2033
- Figure 68: South America Cancer Immunotherapy Industry Volume (K Unit), by Therapy Type 2025 & 2033
- Figure 69: South America Cancer Immunotherapy Industry Revenue Share (%), by Therapy Type 2025 & 2033
- Figure 70: South America Cancer Immunotherapy Industry Volume Share (%), by Therapy Type 2025 & 2033
- Figure 71: South America Cancer Immunotherapy Industry Revenue (billion), by Application 2025 & 2033
- Figure 72: South America Cancer Immunotherapy Industry Volume (K Unit), by Application 2025 & 2033
- Figure 73: South America Cancer Immunotherapy Industry Revenue Share (%), by Application 2025 & 2033
- Figure 74: South America Cancer Immunotherapy Industry Volume Share (%), by Application 2025 & 2033
- Figure 75: South America Cancer Immunotherapy Industry Revenue (billion), by End Users 2025 & 2033
- Figure 76: South America Cancer Immunotherapy Industry Volume (K Unit), by End Users 2025 & 2033
- Figure 77: South America Cancer Immunotherapy Industry Revenue Share (%), by End Users 2025 & 2033
- Figure 78: South America Cancer Immunotherapy Industry Volume Share (%), by End Users 2025 & 2033
- Figure 79: South America Cancer Immunotherapy Industry Revenue (billion), by Country 2025 & 2033
- Figure 80: South America Cancer Immunotherapy Industry Volume (K Unit), by Country 2025 & 2033
- Figure 81: South America Cancer Immunotherapy Industry Revenue Share (%), by Country 2025 & 2033
- Figure 82: South America Cancer Immunotherapy Industry Volume Share (%), by Country 2025 & 2033
List of Tables
- Table 1: Global Cancer Immunotherapy Industry Revenue billion Forecast, by Therapy Type 2020 & 2033
- Table 2: Global Cancer Immunotherapy Industry Volume K Unit Forecast, by Therapy Type 2020 & 2033
- Table 3: Global Cancer Immunotherapy Industry Revenue billion Forecast, by Application 2020 & 2033
- Table 4: Global Cancer Immunotherapy Industry Volume K Unit Forecast, by Application 2020 & 2033
- Table 5: Global Cancer Immunotherapy Industry Revenue billion Forecast, by End Users 2020 & 2033
- Table 6: Global Cancer Immunotherapy Industry Volume K Unit Forecast, by End Users 2020 & 2033
- Table 7: Global Cancer Immunotherapy Industry Revenue billion Forecast, by Region 2020 & 2033
- Table 8: Global Cancer Immunotherapy Industry Volume K Unit Forecast, by Region 2020 & 2033
- Table 9: Global Cancer Immunotherapy Industry Revenue billion Forecast, by Therapy Type 2020 & 2033
- Table 10: Global Cancer Immunotherapy Industry Volume K Unit Forecast, by Therapy Type 2020 & 2033
- Table 11: Global Cancer Immunotherapy Industry Revenue billion Forecast, by Application 2020 & 2033
- Table 12: Global Cancer Immunotherapy Industry Volume K Unit Forecast, by Application 2020 & 2033
- Table 13: Global Cancer Immunotherapy Industry Revenue billion Forecast, by End Users 2020 & 2033
- Table 14: Global Cancer Immunotherapy Industry Volume K Unit Forecast, by End Users 2020 & 2033
- Table 15: Global Cancer Immunotherapy Industry Revenue billion Forecast, by Country 2020 & 2033
- Table 16: Global Cancer Immunotherapy Industry Volume K Unit Forecast, by Country 2020 & 2033
- Table 17: United States Cancer Immunotherapy Industry Revenue (billion) Forecast, by Application 2020 & 2033
- Table 18: United States Cancer Immunotherapy Industry Volume (K Unit) Forecast, by Application 2020 & 2033
- Table 19: Canada Cancer Immunotherapy Industry Revenue (billion) Forecast, by Application 2020 & 2033
- Table 20: Canada Cancer Immunotherapy Industry Volume (K Unit) Forecast, by Application 2020 & 2033
- Table 21: Mexico Cancer Immunotherapy Industry Revenue (billion) Forecast, by Application 2020 & 2033
- Table 22: Mexico Cancer Immunotherapy Industry Volume (K Unit) Forecast, by Application 2020 & 2033
- Table 23: Global Cancer Immunotherapy Industry Revenue billion Forecast, by Therapy Type 2020 & 2033
- Table 24: Global Cancer Immunotherapy Industry Volume K Unit Forecast, by Therapy Type 2020 & 2033
- Table 25: Global Cancer Immunotherapy Industry Revenue billion Forecast, by Application 2020 & 2033
- Table 26: Global Cancer Immunotherapy Industry Volume K Unit Forecast, by Application 2020 & 2033
- Table 27: Global Cancer Immunotherapy Industry Revenue billion Forecast, by End Users 2020 & 2033
- Table 28: Global Cancer Immunotherapy Industry Volume K Unit Forecast, by End Users 2020 & 2033
- Table 29: Global Cancer Immunotherapy Industry Revenue billion Forecast, by Country 2020 & 2033
- Table 30: Global Cancer Immunotherapy Industry Volume K Unit Forecast, by Country 2020 & 2033
- Table 31: Germany Cancer Immunotherapy Industry Revenue (billion) Forecast, by Application 2020 & 2033
- Table 32: Germany Cancer Immunotherapy Industry Volume (K Unit) Forecast, by Application 2020 & 2033
- Table 33: United Kingdom Cancer Immunotherapy Industry Revenue (billion) Forecast, by Application 2020 & 2033
- Table 34: United Kingdom Cancer Immunotherapy Industry Volume (K Unit) Forecast, by Application 2020 & 2033
- Table 35: France Cancer Immunotherapy Industry Revenue (billion) Forecast, by Application 2020 & 2033
- Table 36: France Cancer Immunotherapy Industry Volume (K Unit) Forecast, by Application 2020 & 2033
- Table 37: Italy Cancer Immunotherapy Industry Revenue (billion) Forecast, by Application 2020 & 2033
- Table 38: Italy Cancer Immunotherapy Industry Volume (K Unit) Forecast, by Application 2020 & 2033
- Table 39: Spain Cancer Immunotherapy Industry Revenue (billion) Forecast, by Application 2020 & 2033
- Table 40: Spain Cancer Immunotherapy Industry Volume (K Unit) Forecast, by Application 2020 & 2033
- Table 41: Rest of Europe Cancer Immunotherapy Industry Revenue (billion) Forecast, by Application 2020 & 2033
- Table 42: Rest of Europe Cancer Immunotherapy Industry Volume (K Unit) Forecast, by Application 2020 & 2033
- Table 43: Global Cancer Immunotherapy Industry Revenue billion Forecast, by Therapy Type 2020 & 2033
- Table 44: Global Cancer Immunotherapy Industry Volume K Unit Forecast, by Therapy Type 2020 & 2033
- Table 45: Global Cancer Immunotherapy Industry Revenue billion Forecast, by Application 2020 & 2033
- Table 46: Global Cancer Immunotherapy Industry Volume K Unit Forecast, by Application 2020 & 2033
- Table 47: Global Cancer Immunotherapy Industry Revenue billion Forecast, by End Users 2020 & 2033
- Table 48: Global Cancer Immunotherapy Industry Volume K Unit Forecast, by End Users 2020 & 2033
- Table 49: Global Cancer Immunotherapy Industry Revenue billion Forecast, by Country 2020 & 2033
- Table 50: Global Cancer Immunotherapy Industry Volume K Unit Forecast, by Country 2020 & 2033
- Table 51: China Cancer Immunotherapy Industry Revenue (billion) Forecast, by Application 2020 & 2033
- Table 52: China Cancer Immunotherapy Industry Volume (K Unit) Forecast, by Application 2020 & 2033
- Table 53: Japan Cancer Immunotherapy Industry Revenue (billion) Forecast, by Application 2020 & 2033
- Table 54: Japan Cancer Immunotherapy Industry Volume (K Unit) Forecast, by Application 2020 & 2033
- Table 55: India Cancer Immunotherapy Industry Revenue (billion) Forecast, by Application 2020 & 2033
- Table 56: India Cancer Immunotherapy Industry Volume (K Unit) Forecast, by Application 2020 & 2033
- Table 57: Australia Cancer Immunotherapy Industry Revenue (billion) Forecast, by Application 2020 & 2033
- Table 58: Australia Cancer Immunotherapy Industry Volume (K Unit) Forecast, by Application 2020 & 2033
- Table 59: South Korea Cancer Immunotherapy Industry Revenue (billion) Forecast, by Application 2020 & 2033
- Table 60: South Korea Cancer Immunotherapy Industry Volume (K Unit) Forecast, by Application 2020 & 2033
- Table 61: Rest of Asia Pacific Cancer Immunotherapy Industry Revenue (billion) Forecast, by Application 2020 & 2033
- Table 62: Rest of Asia Pacific Cancer Immunotherapy Industry Volume (K Unit) Forecast, by Application 2020 & 2033
- Table 63: Global Cancer Immunotherapy Industry Revenue billion Forecast, by Therapy Type 2020 & 2033
- Table 64: Global Cancer Immunotherapy Industry Volume K Unit Forecast, by Therapy Type 2020 & 2033
- Table 65: Global Cancer Immunotherapy Industry Revenue billion Forecast, by Application 2020 & 2033
- Table 66: Global Cancer Immunotherapy Industry Volume K Unit Forecast, by Application 2020 & 2033
- Table 67: Global Cancer Immunotherapy Industry Revenue billion Forecast, by End Users 2020 & 2033
- Table 68: Global Cancer Immunotherapy Industry Volume K Unit Forecast, by End Users 2020 & 2033
- Table 69: Global Cancer Immunotherapy Industry Revenue billion Forecast, by Country 2020 & 2033
- Table 70: Global Cancer Immunotherapy Industry Volume K Unit Forecast, by Country 2020 & 2033
- Table 71: GCC Cancer Immunotherapy Industry Revenue (billion) Forecast, by Application 2020 & 2033
- Table 72: GCC Cancer Immunotherapy Industry Volume (K Unit) Forecast, by Application 2020 & 2033
- Table 73: South Africa Cancer Immunotherapy Industry Revenue (billion) Forecast, by Application 2020 & 2033
- Table 74: South Africa Cancer Immunotherapy Industry Volume (K Unit) Forecast, by Application 2020 & 2033
- Table 75: Rest of Middle East and Africa Cancer Immunotherapy Industry Revenue (billion) Forecast, by Application 2020 & 2033
- Table 76: Rest of Middle East and Africa Cancer Immunotherapy Industry Volume (K Unit) Forecast, by Application 2020 & 2033
- Table 77: Global Cancer Immunotherapy Industry Revenue billion Forecast, by Therapy Type 2020 & 2033
- Table 78: Global Cancer Immunotherapy Industry Volume K Unit Forecast, by Therapy Type 2020 & 2033
- Table 79: Global Cancer Immunotherapy Industry Revenue billion Forecast, by Application 2020 & 2033
- Table 80: Global Cancer Immunotherapy Industry Volume K Unit Forecast, by Application 2020 & 2033
- Table 81: Global Cancer Immunotherapy Industry Revenue billion Forecast, by End Users 2020 & 2033
- Table 82: Global Cancer Immunotherapy Industry Volume K Unit Forecast, by End Users 2020 & 2033
- Table 83: Global Cancer Immunotherapy Industry Revenue billion Forecast, by Country 2020 & 2033
- Table 84: Global Cancer Immunotherapy Industry Volume K Unit Forecast, by Country 2020 & 2033
- Table 85: Brazil Cancer Immunotherapy Industry Revenue (billion) Forecast, by Application 2020 & 2033
- Table 86: Brazil Cancer Immunotherapy Industry Volume (K Unit) Forecast, by Application 2020 & 2033
- Table 87: Argentina Cancer Immunotherapy Industry Revenue (billion) Forecast, by Application 2020 & 2033
- Table 88: Argentina Cancer Immunotherapy Industry Volume (K Unit) Forecast, by Application 2020 & 2033
- Table 89: Rest of South America Cancer Immunotherapy Industry Revenue (billion) Forecast, by Application 2020 & 2033
- Table 90: Rest of South America Cancer Immunotherapy Industry Volume (K Unit) Forecast, by Application 2020 & 2033
Frequently Asked Questions
1. What is the projected Compound Annual Growth Rate (CAGR) of the Cancer Immunotherapy Industry?
The projected CAGR is approximately 9.02%.
2. Which companies are prominent players in the Cancer Immunotherapy Industry?
Key companies in the market include Bayer AG, Novartis AG, Astellas Pharma Inc, Amgen Inc, Gilead Sciences, OSE Immunotherapeutics, Seattle Genetics Inc, AstraZeneca PLC, Eli Lilly and Company, Bristol-Myers Squibb, Merck and Co Inc, GlaxoSmithKline PLC, F Hoffman La Roche Ltd, Pfizer Inc.
3. What are the main segments of the Cancer Immunotherapy Industry?
The market segments include Therapy Type, Application, End Users.
4. Can you provide details about the market size?
The market size is estimated to be USD 153.27 billion as of 2022.
5. What are some drivers contributing to market growth?
Rising R&D Activities; Increasing Effectivity and Accuracy Of Newer Therapies; Growing Prevalence of Cancer.
6. What are the notable trends driving market growth?
Breast Cancer Segment Expected to Hold a Major Share in the Cancer Immunotherapy Market.
7. Are there any restraints impacting market growth?
High Cost Coupled with Expensive Development; Stringent Regulatory Factors.
8. Can you provide examples of recent developments in the market?
N/A
9. What pricing options are available for accessing the report?
Pricing options include single-user, multi-user, and enterprise licenses priced at USD 4750, USD 5250, and USD 8750 respectively.
10. Is the market size provided in terms of value or volume?
The market size is provided in terms of value, measured in billion and volume, measured in K Unit.
11. Are there any specific market keywords associated with the report?
Yes, the market keyword associated with the report is "Cancer Immunotherapy Industry," which aids in identifying and referencing the specific market segment covered.
12. How do I determine which pricing option suits my needs best?
The pricing options vary based on user requirements and access needs. Individual users may opt for single-user licenses, while businesses requiring broader access may choose multi-user or enterprise licenses for cost-effective access to the report.
13. Are there any additional resources or data provided in the Cancer Immunotherapy Industry report?
While the report offers comprehensive insights, it's advisable to review the specific contents or supplementary materials provided to ascertain if additional resources or data are available.
14. How can I stay updated on further developments or reports in the Cancer Immunotherapy Industry?
To stay informed about further developments, trends, and reports in the Cancer Immunotherapy Industry, consider subscribing to industry newsletters, following relevant companies and organizations, or regularly checking reputable industry news sources and publications.
Methodology
Step 1 - Identification of Relevant Samples Size from Population Database


Step 2 - Approaches for Defining Global Market Size (Value, Volume* & Price*)

Note*: In applicable scenarios
Step 3 - Data Sources
Primary Research
- Web Analytics
- Survey Reports
- Research Institute
- Latest Research Reports
- Opinion Leaders
Secondary Research
- Annual Reports
- White Paper
- Latest Press Release
- Industry Association
- Paid Database
- Investor Presentations

Step 4 - Data Triangulation
Involves using different sources of information in order to increase the validity of a study
These sources are likely to be stakeholders in a program - participants, other researchers, program staff, other community members, and so on.
Then we put all data in single framework & apply various statistical tools to find out the dynamic on the market.
During the analysis stage, feedback from the stakeholder groups would be compared to determine areas of agreement as well as areas of divergence