

Key Insights
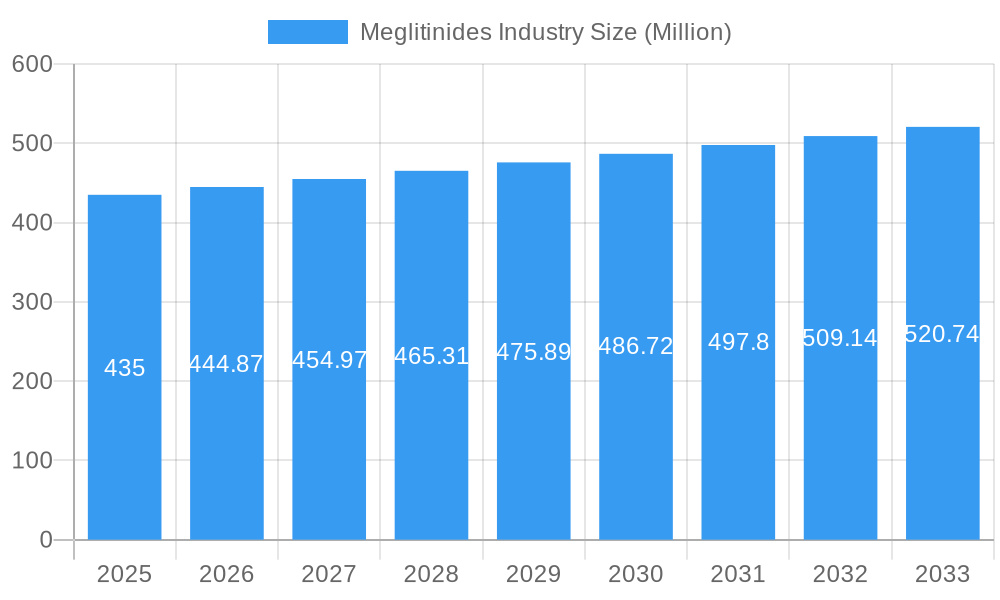
The global Meglitinides market is poised for steady growth, projected to reach USD 435 Million by 2025, with a Compound Annual Growth Rate (CAGR) of 2.21% during the forecast period of 2025-2033. This expansion is primarily driven by the increasing prevalence of type 2 diabetes globally, a condition that Meglitinides are a crucial treatment option for. Advancements in pharmaceutical research leading to improved formulations and greater accessibility of these medications are further fueling market demand. The market's trajectory is also influenced by a growing awareness among healthcare providers and patients regarding the efficacy of Meglitinides in managing postprandial hyperglycemia. Key market players are focusing on strategic collaborations and product development to cater to the evolving needs of the diabetes management landscape, contributing to a dynamic and competitive environment.
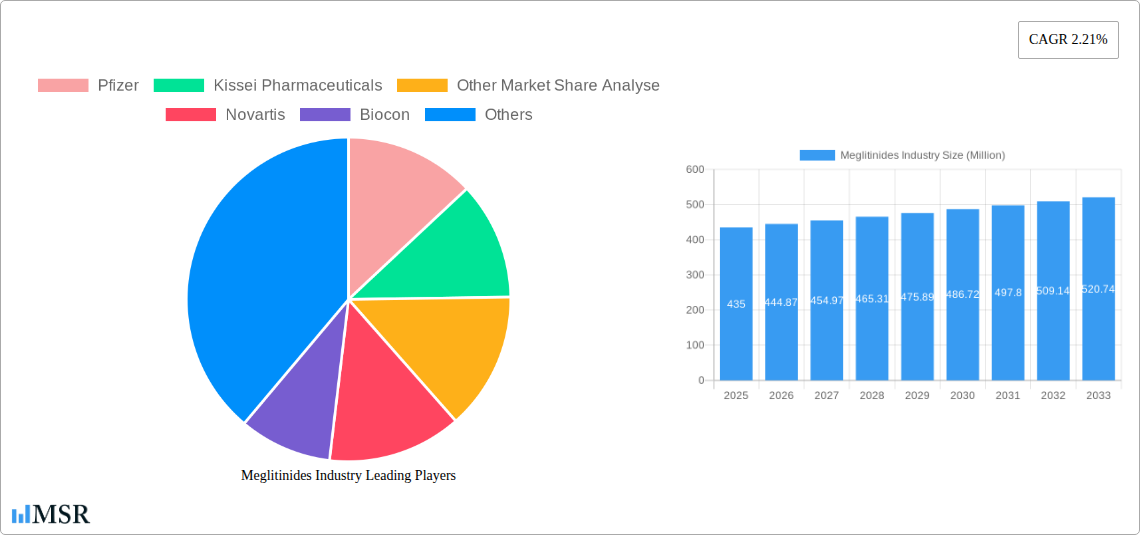
Meglitinides Industry Market Size (In Million)
However, the growth trajectory of the Meglitinides market is not without its challenges. While the drivers of increasing diabetes rates and technological advancements are strong, potential restraints such as the rising adoption of alternative diabetes treatment options, including newer classes of antidiabetic drugs and advancements in insulin therapies, could moderate the market's pace. Stringent regulatory approvals and pricing pressures in various regions also present hurdles for manufacturers. Despite these factors, the segmentation of the market across production, consumption, import/export, and price trends indicates a mature yet evolving industry. The competitive landscape, featuring major pharmaceutical giants like Pfizer, Novartis, and Novo Nordisk, alongside emerging players, underscores a concentrated market with significant investment in research and development to maintain market share and introduce innovative solutions.
Meglitinides Industry Company Market Share
This in-depth report offers an exhaustive analysis of the global Meglitinides industry, providing critical insights for stakeholders seeking to navigate this dynamic pharmaceutical sector. Covering a comprehensive study period from 2019 to 2033, with a base year of 2025 and a detailed forecast period of 2025–2033, this report delves into market concentration, key trends, leading markets, product developments, challenges, growth drivers, and emerging opportunities. It is an indispensable resource for pharmaceutical manufacturers, R&D professionals, investors, and policymakers.
Meglitinides Industry Market Concentration & Dynamics
The Meglitinides industry exhibits a moderate market concentration, with several prominent pharmaceutical giants and emerging players contributing to its competitive landscape. Innovation ecosystems are robust, driven by ongoing research into novel drug delivery systems and combination therapies for type 2 diabetes management. Regulatory frameworks, primarily governed by agencies like the FDA and EMA, are crucial in shaping market entry and product approvals. Substitute products, including other oral hypoglycemic agents and newer classes of diabetes medications, present a constant competitive pressure. End-user trends indicate a growing demand for convenient and effective oral antidiabetic drugs, particularly among aging populations and individuals seeking better glycemic control with fewer side effects. Mergers & Acquisitions (M&A) activities, though not currently at an extreme peak, are strategically important for consolidating market share and expanding product portfolios. The Meglitinides market share is influenced by the success of key players and the introduction of next-generation therapies. M&A deal counts are expected to see strategic plays for market consolidation and pipeline expansion.
Meglitinides Industry Industry Insights & Trends
The global Meglitinides market is poised for substantial growth, driven by the escalating prevalence of type 2 diabetes worldwide. This oral antidiabetic drugs market is projected to reach approximately USD 7,500 Million by 2033, expanding at a Compound Annual Growth Rate (CAGR) of 5.8% from the base year of 2025. Key growth drivers include an increasing global diabetic population, a rise in obesity rates, and a growing awareness of diabetes complications. Technological disruptions, such as advancements in drug formulation and personalized medicine approaches, are enhancing the efficacy and patient compliance of meglitinide-based therapies. Evolving consumer behaviors, characterized by a preference for oral medications over injectables due to convenience and reduced patient burden, further propel market expansion. The Meglitinides market size is a testament to the ongoing need for effective and accessible diabetes treatments. Factors like improved diagnostic tools and proactive healthcare initiatives are also contributing to the positive market trajectory.
Key Markets & Segments Leading Meglitinides Industry
North America currently dominates the Meglitinides industry, owing to its high prevalence of type 2 diabetes, advanced healthcare infrastructure, and significant R&D investments. The United States, in particular, represents a lucrative market for meglitinide-based therapies.
- Production Analysis: Dominated by countries with robust pharmaceutical manufacturing capabilities and favorable regulatory environments. The Meglitinides production analysis highlights the concentration of manufacturing hubs.
- Consumption Analysis: Driven by regions with high diabetic populations and strong healthcare access. Asia Pacific is emerging as a significant consumption market.
- Import Market Analysis (Value & Volume): High-value imports are observed in developed economies with a demand for advanced formulations, while volume imports are significant in emerging markets. The Meglitinides import market value is substantial in North America and Europe.
- Export Market Analysis (Value & Volume): Leading pharmaceutical-exporting nations contribute significantly to the global supply of meglitinides. The Meglitinides export market volume is driven by demand from developing nations.
- Price Trend Analysis: Prices are influenced by patent expirations, generic competition, and the introduction of novel formulations. The Meglitinides price trend analysis indicates a stabilizing trend with potential for slight increases due to specialized formulations.
Meglitinides Industry Product Developments
Product developments in the Meglitinides industry focus on improving pharmacokinetic profiles, reducing dosing frequency, and combining meglitinides with other antidiabetic agents to achieve synergistic effects and enhanced glycemic control. Innovations are aimed at addressing patient adherence challenges and minimizing the risk of hypoglycemia. The market relevance of these developments lies in their ability to offer more convenient and effective treatment options for the growing type 2 diabetes population.
Challenges in the Meglitinides Industry Market
The Meglitinides industry faces several challenges, including stringent regulatory hurdles for new drug approvals, intense competition from other classes of antidiabetic drugs, and the growing threat of generic erosion. Supply chain disruptions, particularly in the aftermath of global events, can impact manufacturing and distribution. Furthermore, the increasing focus on lifestyle interventions and novel therapeutic approaches for diabetes management presents a competitive challenge.
Forces Driving Meglitinides Industry Growth
Key growth drivers for the Meglitinides industry include the escalating global prevalence of type 2 diabetes, driven by aging populations and lifestyle changes. Technological advancements in drug development and formulation are leading to more effective and patient-friendly meglitinide-based therapies. Supportive regulatory environments in key markets and increasing healthcare expenditure further bolster market growth.
Challenges in the Meglitinides Industry Market
Long-term growth catalysts for the Meglitinides industry are rooted in ongoing innovation and strategic market expansions. Continued research into combination therapies and novel delivery mechanisms will be crucial. Partnerships and collaborations between pharmaceutical companies and research institutions can accelerate the development of next-generation meglitinides. Expansion into emerging markets with a growing diabetic population also presents significant long-term opportunities.
Emerging Opportunities in Meglitinides Industry
Emerging opportunities within the Meglitinides industry lie in the development of personalized treatment regimens, catering to individual patient profiles and genetic predispositions. The growing demand for fixed-dose combination therapies that simplify treatment regimens and improve patient adherence offers a significant avenue for growth. Furthermore, the exploration of meglitinides in combination with newer classes of antidiabetic drugs, such as SGLT2 inhibitors and GLP-1 receptor agonists, presents a promising area for innovation and market expansion.
Leading Players in the Meglitinides Industry Sector
- Pfizer
- Kissei Pharmaceuticals
- Novartis
- Biocon
- Glenmark
- Bristol Myers Squibb
- Novo Nordisk
- Mylan
- Boehringer Ingelheim
- Teva Pharmaceuticals
Key Milestones in Meglitinides Industry Industry
- March 2023: A Randomized, Open-Label, Controlled, Parallel-group, Multicenter Trial was conducted to evaluate the efficacy and safety of INS068 once daily (QD) in subjects with type-2 diabetes not adequately controlled with oral antidiabetic drugs compared to insulin Glargine QD for 26+26 weeks.
- January 2023: OXJournal reviewed the effects of meglitinides as a class of oral medications for treating type 2 diabetes, especially in young adults.
Strategic Outlook for Meglitinides Industry Market
The strategic outlook for the Meglitinides industry market is characterized by a focus on innovation, strategic partnerships, and market expansion. Growth will be accelerated by the development of advanced meglitinide formulations, combination therapies, and a deeper understanding of patient needs. The market is expected to witness strategic collaborations to leverage R&D capabilities and expand market reach, particularly in emerging economies with a burgeoning diabetic population.
Meglitinides Industry Segmentation
- 1. Production Analysis
- 2. Consumption Analysis
- 3. Import Market Analysis (Value & Volume)
- 4. Export Market Analysis (Value & Volume)
- 5. Price Trend Analysis
Meglitinides Industry Segmentation By Geography
-
1. North America
- 1.1. United States
- 1.2. Canada
- 1.3. Rest of North America
-
2. Europe
- 2.1. Germany
- 2.2. Spain
- 2.3. Italy
- 2.4. France
- 2.5. United Kingdom
- 2.6. Russia
- 2.7. Rest of Europe
-
3. Asia Pacific
- 3.1. Japan
- 3.2. China
- 3.3. Australia
- 3.4. India
- 3.5. South Korea
- 3.6. Malaysia
- 3.7. Indonesia
- 3.8. Thailand
- 3.9. Vietnam
- 3.10. Philippines
- 3.11. Rest of Asia Pacific
-
4. Latin America
- 4.1. Brazil
- 4.2. Mexico
- 4.3. Rest of Latin America
-
5. Middle East and Africa
- 5.1. South Africa
- 5.2. Saudi Arabia
- 5.3. Oman
- 5.4. Egypt
- 5.5. Iran
- 5.6. Rest of Middle East and Africa
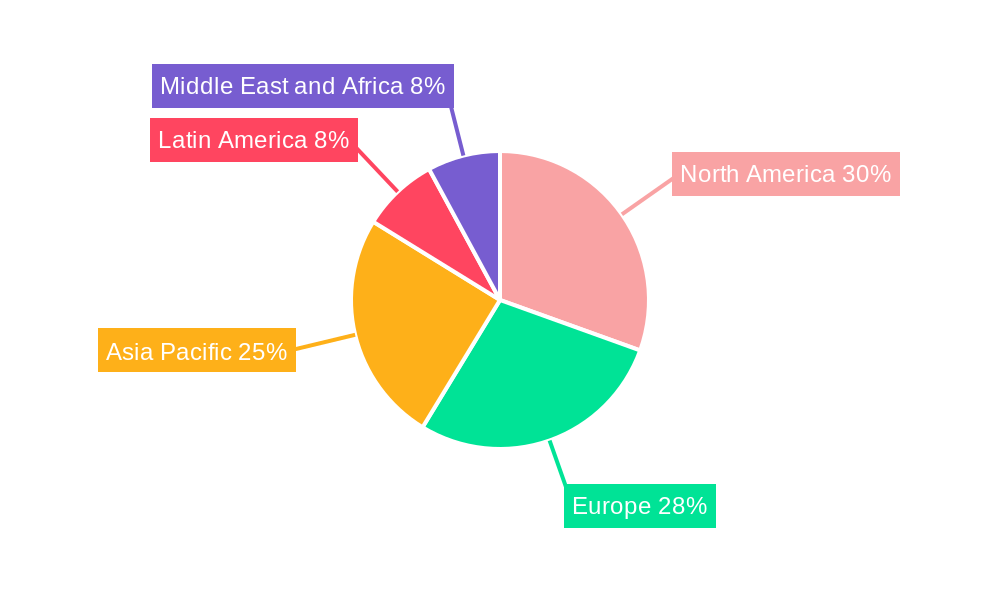
Meglitinides Industry Regional Market Share
Geographic Coverage of Meglitinides Industry
Meglitinides Industry REPORT HIGHLIGHTS
| Aspects | Details |
|---|---|
| Study Period | 2020-2034 |
| Base Year | 2025 |
| Estimated Year | 2026 |
| Forecast Period | 2026-2034 |
| Historical Period | 2020-2025 |
| Growth Rate | CAGR of 2.21% from 2020-2034 |
| Segmentation |
|
Table of Contents
- 1. Introduction
- 1.1. Research Scope
- 1.2. Market Segmentation
- 1.3. Research Objective
- 1.4. Definitions and Assumptions
- 2. Executive Summary
- 2.1. Market Snapshot
- 3. Market Dynamics
- 3.1. Market Drivers
- 3.2. Market Restrains
- 3.3. Market Trends
- 3.4. Market Opportunities
- 4. Market Factor Analysis
- 4.1. Porters Five Forces
- 4.1.1. Bargaining Power of Suppliers
- 4.1.2. Bargaining Power of Buyers
- 4.1.3. Threat of New Entrants
- 4.1.4. Threat of Substitutes
- 4.1.5. Competitive Rivalry
- 4.2. PESTEL analysis
- 4.3. BCG Analysis
- 4.3.1. Stars (High Growth, High Market Share)
- 4.3.2. Cash Cows (Low Growth, High Market Share)
- 4.3.3. Question Mark (High Growth, Low Market Share)
- 4.3.4. Dogs (Low Growth, Low Market Share)
- 4.4. Ansoff Matrix Analysis
- 4.5. Supply Chain Analysis
- 4.6. Regulatory Landscape
- 4.7. Current Market Potential and Opportunity Assessment (TAM–SAM–SOM Framework)
- 4.8. MSR Analyst Note
- 4.1. Porters Five Forces
- 5. Market Analysis, Insights and Forecast 2021-2033
- 5.1. Market Analysis, Insights and Forecast - by Production Analysis
- 5.2. Market Analysis, Insights and Forecast - by Consumption Analysis
- 5.3. Market Analysis, Insights and Forecast - by Import Market Analysis (Value & Volume)
- 5.4. Market Analysis, Insights and Forecast - by Export Market Analysis (Value & Volume)
- 5.5. Market Analysis, Insights and Forecast - by Price Trend Analysis
- 5.6. Market Analysis, Insights and Forecast - by Region
- 5.6.1. North America
- 5.6.2. Europe
- 5.6.3. Asia Pacific
- 5.6.4. Latin America
- 5.6.5. Middle East and Africa
- 6. Global Meglitinides Industry Analysis, Insights and Forecast, 2021-2033
- 6.1. Market Analysis, Insights and Forecast - by Production Analysis
- 6.2. Market Analysis, Insights and Forecast - by Consumption Analysis
- 6.3. Market Analysis, Insights and Forecast - by Import Market Analysis (Value & Volume)
- 6.4. Market Analysis, Insights and Forecast - by Export Market Analysis (Value & Volume)
- 6.5. Market Analysis, Insights and Forecast - by Price Trend Analysis
- 7. North America Meglitinides Industry Analysis, Insights and Forecast, 2020-2032
- 7.1. Market Analysis, Insights and Forecast - by Production Analysis
- 7.2. Market Analysis, Insights and Forecast - by Consumption Analysis
- 7.3. Market Analysis, Insights and Forecast - by Import Market Analysis (Value & Volume)
- 7.4. Market Analysis, Insights and Forecast - by Export Market Analysis (Value & Volume)
- 7.5. Market Analysis, Insights and Forecast - by Price Trend Analysis
- 8. Europe Meglitinides Industry Analysis, Insights and Forecast, 2020-2032
- 8.1. Market Analysis, Insights and Forecast - by Production Analysis
- 8.2. Market Analysis, Insights and Forecast - by Consumption Analysis
- 8.3. Market Analysis, Insights and Forecast - by Import Market Analysis (Value & Volume)
- 8.4. Market Analysis, Insights and Forecast - by Export Market Analysis (Value & Volume)
- 8.5. Market Analysis, Insights and Forecast - by Price Trend Analysis
- 9. Asia Pacific Meglitinides Industry Analysis, Insights and Forecast, 2020-2032
- 9.1. Market Analysis, Insights and Forecast - by Production Analysis
- 9.2. Market Analysis, Insights and Forecast - by Consumption Analysis
- 9.3. Market Analysis, Insights and Forecast - by Import Market Analysis (Value & Volume)
- 9.4. Market Analysis, Insights and Forecast - by Export Market Analysis (Value & Volume)
- 9.5. Market Analysis, Insights and Forecast - by Price Trend Analysis
- 10. Latin America Meglitinides Industry Analysis, Insights and Forecast, 2020-2032
- 10.1. Market Analysis, Insights and Forecast - by Production Analysis
- 10.2. Market Analysis, Insights and Forecast - by Consumption Analysis
- 10.3. Market Analysis, Insights and Forecast - by Import Market Analysis (Value & Volume)
- 10.4. Market Analysis, Insights and Forecast - by Export Market Analysis (Value & Volume)
- 10.5. Market Analysis, Insights and Forecast - by Price Trend Analysis
- 11. Middle East and Africa Meglitinides Industry Analysis, Insights and Forecast, 2020-2032
- 11.1. Market Analysis, Insights and Forecast - by Production Analysis
- 11.2. Market Analysis, Insights and Forecast - by Consumption Analysis
- 11.3. Market Analysis, Insights and Forecast - by Import Market Analysis (Value & Volume)
- 11.4. Market Analysis, Insights and Forecast - by Export Market Analysis (Value & Volume)
- 11.5. Market Analysis, Insights and Forecast - by Price Trend Analysis
- 12. Competitive Analysis
- 12.1. Company Profiles
- 12.1.1 Pfizer
- 12.1.1.1. Company Overview
- 12.1.1.2. Products
- 12.1.1.3. Company Financials
- 12.1.1.4. SWOT Analysis
- 12.1.2 Kissei Pharmaceuticals
- 12.1.2.1. Company Overview
- 12.1.2.2. Products
- 12.1.2.3. Company Financials
- 12.1.2.4. SWOT Analysis
- 12.1.3 Other Market Share Analyse
- 12.1.3.1. Company Overview
- 12.1.3.2. Products
- 12.1.3.3. Company Financials
- 12.1.3.4. SWOT Analysis
- 12.1.4 Novartis
- 12.1.4.1. Company Overview
- 12.1.4.2. Products
- 12.1.4.3. Company Financials
- 12.1.4.4. SWOT Analysis
- 12.1.5 Biocon
- 12.1.5.1. Company Overview
- 12.1.5.2. Products
- 12.1.5.3. Company Financials
- 12.1.5.4. SWOT Analysis
- 12.1.6 Glenmark
- 12.1.6.1. Company Overview
- 12.1.6.2. Products
- 12.1.6.3. Company Financials
- 12.1.6.4. SWOT Analysis
- 12.1.7 Bristol Myers Squibb
- 12.1.7.1. Company Overview
- 12.1.7.2. Products
- 12.1.7.3. Company Financials
- 12.1.7.4. SWOT Analysis
- 12.1.8 Novo Nordisk
- 12.1.8.1. Company Overview
- 12.1.8.2. Products
- 12.1.8.3. Company Financials
- 12.1.8.4. SWOT Analysis
- 12.1.9 Mylan
- 12.1.9.1. Company Overview
- 12.1.9.2. Products
- 12.1.9.3. Company Financials
- 12.1.9.4. SWOT Analysis
- 12.1.10 Boehringer Ingelheim
- 12.1.10.1. Company Overview
- 12.1.10.2. Products
- 12.1.10.3. Company Financials
- 12.1.10.4. SWOT Analysis
- 12.1.11 7 COMPETITIVE LANDSCAPE7 1 COMPANY PROFILES
- 12.1.11.1. Company Overview
- 12.1.11.2. Products
- 12.1.11.3. Company Financials
- 12.1.11.4. SWOT Analysis
- 12.1.12 Teva Pharmaceuticals*List Not Exhaustive 7 2 MARKET SHARE ANALYSIS
- 12.1.12.1. Company Overview
- 12.1.12.2. Products
- 12.1.12.3. Company Financials
- 12.1.12.4. SWOT Analysis
- 12.1.1 Pfizer
- 12.2. Market Entropy
- 12.2.1 Company's Key Areas Served
- 12.2.2 Recent Developments
- 12.3. Company Market Share Analysis 2025
- 12.3.1 Top 5 Companies Market Share Analysis
- 12.3.2 Top 3 Companies Market Share Analysis
- 12.4. List of Potential Customers
- 13. Research Methodology
List of Figures
- Figure 1: Global Meglitinides Industry Revenue Breakdown (Million, %) by Region 2025 & 2033
- Figure 2: North America Meglitinides Industry Revenue (Million), by Production Analysis 2025 & 2033
- Figure 3: North America Meglitinides Industry Revenue Share (%), by Production Analysis 2025 & 2033
- Figure 4: North America Meglitinides Industry Revenue (Million), by Consumption Analysis 2025 & 2033
- Figure 5: North America Meglitinides Industry Revenue Share (%), by Consumption Analysis 2025 & 2033
- Figure 6: North America Meglitinides Industry Revenue (Million), by Import Market Analysis (Value & Volume) 2025 & 2033
- Figure 7: North America Meglitinides Industry Revenue Share (%), by Import Market Analysis (Value & Volume) 2025 & 2033
- Figure 8: North America Meglitinides Industry Revenue (Million), by Export Market Analysis (Value & Volume) 2025 & 2033
- Figure 9: North America Meglitinides Industry Revenue Share (%), by Export Market Analysis (Value & Volume) 2025 & 2033
- Figure 10: North America Meglitinides Industry Revenue (Million), by Price Trend Analysis 2025 & 2033
- Figure 11: North America Meglitinides Industry Revenue Share (%), by Price Trend Analysis 2025 & 2033
- Figure 12: North America Meglitinides Industry Revenue (Million), by Country 2025 & 2033
- Figure 13: North America Meglitinides Industry Revenue Share (%), by Country 2025 & 2033
- Figure 14: Europe Meglitinides Industry Revenue (Million), by Production Analysis 2025 & 2033
- Figure 15: Europe Meglitinides Industry Revenue Share (%), by Production Analysis 2025 & 2033
- Figure 16: Europe Meglitinides Industry Revenue (Million), by Consumption Analysis 2025 & 2033
- Figure 17: Europe Meglitinides Industry Revenue Share (%), by Consumption Analysis 2025 & 2033
- Figure 18: Europe Meglitinides Industry Revenue (Million), by Import Market Analysis (Value & Volume) 2025 & 2033
- Figure 19: Europe Meglitinides Industry Revenue Share (%), by Import Market Analysis (Value & Volume) 2025 & 2033
- Figure 20: Europe Meglitinides Industry Revenue (Million), by Export Market Analysis (Value & Volume) 2025 & 2033
- Figure 21: Europe Meglitinides Industry Revenue Share (%), by Export Market Analysis (Value & Volume) 2025 & 2033
- Figure 22: Europe Meglitinides Industry Revenue (Million), by Price Trend Analysis 2025 & 2033
- Figure 23: Europe Meglitinides Industry Revenue Share (%), by Price Trend Analysis 2025 & 2033
- Figure 24: Europe Meglitinides Industry Revenue (Million), by Country 2025 & 2033
- Figure 25: Europe Meglitinides Industry Revenue Share (%), by Country 2025 & 2033
- Figure 26: Asia Pacific Meglitinides Industry Revenue (Million), by Production Analysis 2025 & 2033
- Figure 27: Asia Pacific Meglitinides Industry Revenue Share (%), by Production Analysis 2025 & 2033
- Figure 28: Asia Pacific Meglitinides Industry Revenue (Million), by Consumption Analysis 2025 & 2033
- Figure 29: Asia Pacific Meglitinides Industry Revenue Share (%), by Consumption Analysis 2025 & 2033
- Figure 30: Asia Pacific Meglitinides Industry Revenue (Million), by Import Market Analysis (Value & Volume) 2025 & 2033
- Figure 31: Asia Pacific Meglitinides Industry Revenue Share (%), by Import Market Analysis (Value & Volume) 2025 & 2033
- Figure 32: Asia Pacific Meglitinides Industry Revenue (Million), by Export Market Analysis (Value & Volume) 2025 & 2033
- Figure 33: Asia Pacific Meglitinides Industry Revenue Share (%), by Export Market Analysis (Value & Volume) 2025 & 2033
- Figure 34: Asia Pacific Meglitinides Industry Revenue (Million), by Price Trend Analysis 2025 & 2033
- Figure 35: Asia Pacific Meglitinides Industry Revenue Share (%), by Price Trend Analysis 2025 & 2033
- Figure 36: Asia Pacific Meglitinides Industry Revenue (Million), by Country 2025 & 2033
- Figure 37: Asia Pacific Meglitinides Industry Revenue Share (%), by Country 2025 & 2033
- Figure 38: Latin America Meglitinides Industry Revenue (Million), by Production Analysis 2025 & 2033
- Figure 39: Latin America Meglitinides Industry Revenue Share (%), by Production Analysis 2025 & 2033
- Figure 40: Latin America Meglitinides Industry Revenue (Million), by Consumption Analysis 2025 & 2033
- Figure 41: Latin America Meglitinides Industry Revenue Share (%), by Consumption Analysis 2025 & 2033
- Figure 42: Latin America Meglitinides Industry Revenue (Million), by Import Market Analysis (Value & Volume) 2025 & 2033
- Figure 43: Latin America Meglitinides Industry Revenue Share (%), by Import Market Analysis (Value & Volume) 2025 & 2033
- Figure 44: Latin America Meglitinides Industry Revenue (Million), by Export Market Analysis (Value & Volume) 2025 & 2033
- Figure 45: Latin America Meglitinides Industry Revenue Share (%), by Export Market Analysis (Value & Volume) 2025 & 2033
- Figure 46: Latin America Meglitinides Industry Revenue (Million), by Price Trend Analysis 2025 & 2033
- Figure 47: Latin America Meglitinides Industry Revenue Share (%), by Price Trend Analysis 2025 & 2033
- Figure 48: Latin America Meglitinides Industry Revenue (Million), by Country 2025 & 2033
- Figure 49: Latin America Meglitinides Industry Revenue Share (%), by Country 2025 & 2033
- Figure 50: Middle East and Africa Meglitinides Industry Revenue (Million), by Production Analysis 2025 & 2033
- Figure 51: Middle East and Africa Meglitinides Industry Revenue Share (%), by Production Analysis 2025 & 2033
- Figure 52: Middle East and Africa Meglitinides Industry Revenue (Million), by Consumption Analysis 2025 & 2033
- Figure 53: Middle East and Africa Meglitinides Industry Revenue Share (%), by Consumption Analysis 2025 & 2033
- Figure 54: Middle East and Africa Meglitinides Industry Revenue (Million), by Import Market Analysis (Value & Volume) 2025 & 2033
- Figure 55: Middle East and Africa Meglitinides Industry Revenue Share (%), by Import Market Analysis (Value & Volume) 2025 & 2033
- Figure 56: Middle East and Africa Meglitinides Industry Revenue (Million), by Export Market Analysis (Value & Volume) 2025 & 2033
- Figure 57: Middle East and Africa Meglitinides Industry Revenue Share (%), by Export Market Analysis (Value & Volume) 2025 & 2033
- Figure 58: Middle East and Africa Meglitinides Industry Revenue (Million), by Price Trend Analysis 2025 & 2033
- Figure 59: Middle East and Africa Meglitinides Industry Revenue Share (%), by Price Trend Analysis 2025 & 2033
- Figure 60: Middle East and Africa Meglitinides Industry Revenue (Million), by Country 2025 & 2033
- Figure 61: Middle East and Africa Meglitinides Industry Revenue Share (%), by Country 2025 & 2033
List of Tables
- Table 1: Global Meglitinides Industry Revenue Million Forecast, by Production Analysis 2020 & 2033
- Table 2: Global Meglitinides Industry Revenue Million Forecast, by Consumption Analysis 2020 & 2033
- Table 3: Global Meglitinides Industry Revenue Million Forecast, by Import Market Analysis (Value & Volume) 2020 & 2033
- Table 4: Global Meglitinides Industry Revenue Million Forecast, by Export Market Analysis (Value & Volume) 2020 & 2033
- Table 5: Global Meglitinides Industry Revenue Million Forecast, by Price Trend Analysis 2020 & 2033
- Table 6: Global Meglitinides Industry Revenue Million Forecast, by Region 2020 & 2033
- Table 7: Global Meglitinides Industry Revenue Million Forecast, by Production Analysis 2020 & 2033
- Table 8: Global Meglitinides Industry Revenue Million Forecast, by Consumption Analysis 2020 & 2033
- Table 9: Global Meglitinides Industry Revenue Million Forecast, by Import Market Analysis (Value & Volume) 2020 & 2033
- Table 10: Global Meglitinides Industry Revenue Million Forecast, by Export Market Analysis (Value & Volume) 2020 & 2033
- Table 11: Global Meglitinides Industry Revenue Million Forecast, by Price Trend Analysis 2020 & 2033
- Table 12: Global Meglitinides Industry Revenue Million Forecast, by Country 2020 & 2033
- Table 13: United States Meglitinides Industry Revenue (Million) Forecast, by Application 2020 & 2033
- Table 14: Canada Meglitinides Industry Revenue (Million) Forecast, by Application 2020 & 2033
- Table 15: Rest of North America Meglitinides Industry Revenue (Million) Forecast, by Application 2020 & 2033
- Table 16: Global Meglitinides Industry Revenue Million Forecast, by Production Analysis 2020 & 2033
- Table 17: Global Meglitinides Industry Revenue Million Forecast, by Consumption Analysis 2020 & 2033
- Table 18: Global Meglitinides Industry Revenue Million Forecast, by Import Market Analysis (Value & Volume) 2020 & 2033
- Table 19: Global Meglitinides Industry Revenue Million Forecast, by Export Market Analysis (Value & Volume) 2020 & 2033
- Table 20: Global Meglitinides Industry Revenue Million Forecast, by Price Trend Analysis 2020 & 2033
- Table 21: Global Meglitinides Industry Revenue Million Forecast, by Country 2020 & 2033
- Table 22: Germany Meglitinides Industry Revenue (Million) Forecast, by Application 2020 & 2033
- Table 23: Spain Meglitinides Industry Revenue (Million) Forecast, by Application 2020 & 2033
- Table 24: Italy Meglitinides Industry Revenue (Million) Forecast, by Application 2020 & 2033
- Table 25: France Meglitinides Industry Revenue (Million) Forecast, by Application 2020 & 2033
- Table 26: United Kingdom Meglitinides Industry Revenue (Million) Forecast, by Application 2020 & 2033
- Table 27: Russia Meglitinides Industry Revenue (Million) Forecast, by Application 2020 & 2033
- Table 28: Rest of Europe Meglitinides Industry Revenue (Million) Forecast, by Application 2020 & 2033
- Table 29: Global Meglitinides Industry Revenue Million Forecast, by Production Analysis 2020 & 2033
- Table 30: Global Meglitinides Industry Revenue Million Forecast, by Consumption Analysis 2020 & 2033
- Table 31: Global Meglitinides Industry Revenue Million Forecast, by Import Market Analysis (Value & Volume) 2020 & 2033
- Table 32: Global Meglitinides Industry Revenue Million Forecast, by Export Market Analysis (Value & Volume) 2020 & 2033
- Table 33: Global Meglitinides Industry Revenue Million Forecast, by Price Trend Analysis 2020 & 2033
- Table 34: Global Meglitinides Industry Revenue Million Forecast, by Country 2020 & 2033
- Table 35: Japan Meglitinides Industry Revenue (Million) Forecast, by Application 2020 & 2033
- Table 36: China Meglitinides Industry Revenue (Million) Forecast, by Application 2020 & 2033
- Table 37: Australia Meglitinides Industry Revenue (Million) Forecast, by Application 2020 & 2033
- Table 38: India Meglitinides Industry Revenue (Million) Forecast, by Application 2020 & 2033
- Table 39: South Korea Meglitinides Industry Revenue (Million) Forecast, by Application 2020 & 2033
- Table 40: Malaysia Meglitinides Industry Revenue (Million) Forecast, by Application 2020 & 2033
- Table 41: Indonesia Meglitinides Industry Revenue (Million) Forecast, by Application 2020 & 2033
- Table 42: Thailand Meglitinides Industry Revenue (Million) Forecast, by Application 2020 & 2033
- Table 43: Vietnam Meglitinides Industry Revenue (Million) Forecast, by Application 2020 & 2033
- Table 44: Philippines Meglitinides Industry Revenue (Million) Forecast, by Application 2020 & 2033
- Table 45: Rest of Asia Pacific Meglitinides Industry Revenue (Million) Forecast, by Application 2020 & 2033
- Table 46: Global Meglitinides Industry Revenue Million Forecast, by Production Analysis 2020 & 2033
- Table 47: Global Meglitinides Industry Revenue Million Forecast, by Consumption Analysis 2020 & 2033
- Table 48: Global Meglitinides Industry Revenue Million Forecast, by Import Market Analysis (Value & Volume) 2020 & 2033
- Table 49: Global Meglitinides Industry Revenue Million Forecast, by Export Market Analysis (Value & Volume) 2020 & 2033
- Table 50: Global Meglitinides Industry Revenue Million Forecast, by Price Trend Analysis 2020 & 2033
- Table 51: Global Meglitinides Industry Revenue Million Forecast, by Country 2020 & 2033
- Table 52: Brazil Meglitinides Industry Revenue (Million) Forecast, by Application 2020 & 2033
- Table 53: Mexico Meglitinides Industry Revenue (Million) Forecast, by Application 2020 & 2033
- Table 54: Rest of Latin America Meglitinides Industry Revenue (Million) Forecast, by Application 2020 & 2033
- Table 55: Global Meglitinides Industry Revenue Million Forecast, by Production Analysis 2020 & 2033
- Table 56: Global Meglitinides Industry Revenue Million Forecast, by Consumption Analysis 2020 & 2033
- Table 57: Global Meglitinides Industry Revenue Million Forecast, by Import Market Analysis (Value & Volume) 2020 & 2033
- Table 58: Global Meglitinides Industry Revenue Million Forecast, by Export Market Analysis (Value & Volume) 2020 & 2033
- Table 59: Global Meglitinides Industry Revenue Million Forecast, by Price Trend Analysis 2020 & 2033
- Table 60: Global Meglitinides Industry Revenue Million Forecast, by Country 2020 & 2033
- Table 61: South Africa Meglitinides Industry Revenue (Million) Forecast, by Application 2020 & 2033
- Table 62: Saudi Arabia Meglitinides Industry Revenue (Million) Forecast, by Application 2020 & 2033
- Table 63: Oman Meglitinides Industry Revenue (Million) Forecast, by Application 2020 & 2033
- Table 64: Egypt Meglitinides Industry Revenue (Million) Forecast, by Application 2020 & 2033
- Table 65: Iran Meglitinides Industry Revenue (Million) Forecast, by Application 2020 & 2033
- Table 66: Rest of Middle East and Africa Meglitinides Industry Revenue (Million) Forecast, by Application 2020 & 2033
Frequently Asked Questions
1. What is the projected Compound Annual Growth Rate (CAGR) of the Meglitinides Industry?
The projected CAGR is approximately 2.21%.
2. Which companies are prominent players in the Meglitinides Industry?
Key companies in the market include Pfizer, Kissei Pharmaceuticals, Other Market Share Analyse, Novartis, Biocon, Glenmark, Bristol Myers Squibb, Novo Nordisk, Mylan, Boehringer Ingelheim, 7 COMPETITIVE LANDSCAPE7 1 COMPANY PROFILES, Teva Pharmaceuticals*List Not Exhaustive 7 2 MARKET SHARE ANALYSIS.
3. What are the main segments of the Meglitinides Industry?
The market segments include Production Analysis, Consumption Analysis, Import Market Analysis (Value & Volume), Export Market Analysis (Value & Volume), Price Trend Analysis.
4. Can you provide details about the market size?
The market size is estimated to be USD 4.35 Million as of 2022.
5. What are some drivers contributing to market growth?
Increasing Incidence of Chronic Diseases Such as Asthma. Allergic Conditions. Cancer. and Multiple Sclerosis; Emergence of Research and Development in the Field of Immunomodulators.
6. What are the notable trends driving market growth?
Rising diabetes prevalence globally.
7. Are there any restraints impacting market growth?
Adverse Effect of Drugs; Unfavourable Regulatory Policies.
8. Can you provide examples of recent developments in the market?
March 2023: A Randomized, Open-Label, Controlled, Parallel-group, Multicenter Trial was conducted to evaluate the efficacy and safety of INS068 once daily (QD) in subjects with type-2 diabetes not adequately controlled with oral antidiabetic drugs compared to insulin Glargine QD for 26+26 weeks.
9. What pricing options are available for accessing the report?
Pricing options include single-user, multi-user, and enterprise licenses priced at USD 4750, USD 5250, and USD 8750 respectively.
10. Is the market size provided in terms of value or volume?
The market size is provided in terms of value, measured in Million.
11. Are there any specific market keywords associated with the report?
Yes, the market keyword associated with the report is "Meglitinides Industry," which aids in identifying and referencing the specific market segment covered.
12. How do I determine which pricing option suits my needs best?
The pricing options vary based on user requirements and access needs. Individual users may opt for single-user licenses, while businesses requiring broader access may choose multi-user or enterprise licenses for cost-effective access to the report.
13. Are there any additional resources or data provided in the Meglitinides Industry report?
While the report offers comprehensive insights, it's advisable to review the specific contents or supplementary materials provided to ascertain if additional resources or data are available.
14. How can I stay updated on further developments or reports in the Meglitinides Industry?
To stay informed about further developments, trends, and reports in the Meglitinides Industry, consider subscribing to industry newsletters, following relevant companies and organizations, or regularly checking reputable industry news sources and publications.
Methodology
Step 1 - Identification of Relevant Samples Size from Population Database


Step 2 - Approaches for Defining Global Market Size (Value, Volume* & Price*)

Note*: In applicable scenarios
Step 3 - Data Sources
Primary Research
- Web Analytics
- Survey Reports
- Research Institute
- Latest Research Reports
- Opinion Leaders
Secondary Research
- Annual Reports
- White Paper
- Latest Press Release
- Industry Association
- Paid Database
- Investor Presentations

Step 4 - Data Triangulation
Involves using different sources of information in order to increase the validity of a study
These sources are likely to be stakeholders in a program - participants, other researchers, program staff, other community members, and so on.
Then we put all data in single framework & apply various statistical tools to find out the dynamic on the market.
During the analysis stage, feedback from the stakeholder groups would be compared to determine areas of agreement as well as areas of divergence