

Key Insights
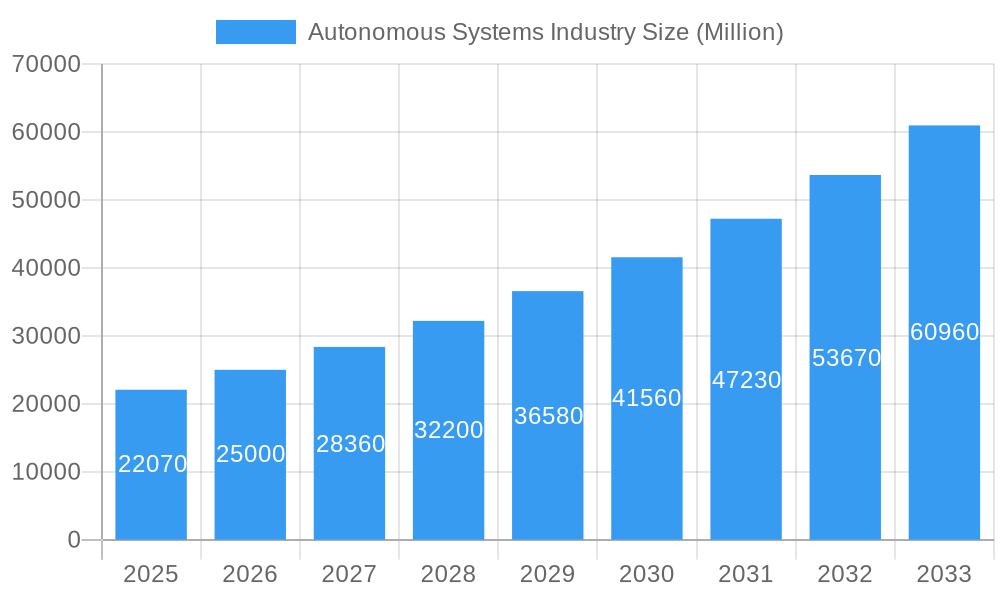
The Autonomous Systems industry is experiencing robust growth, projected to reach a market size of $22.07 billion in 2025 and expanding at a Compound Annual Growth Rate (CAGR) of 13.33% from 2025 to 2033. This expansion is driven by increasing demand across diverse sectors, including military and law enforcement, commercial applications (e.g., logistics, agriculture, infrastructure inspection), and research. Technological advancements in sensor technology, artificial intelligence (AI), and machine learning (ML) are further fueling this growth. The adoption of unmanned aerial vehicles (UAVs), unmanned ground vehicles (UGVs), and unmanned sea systems (USSs) is accelerating, particularly in areas requiring enhanced efficiency, reduced risk, and improved operational capabilities. The large UAV segment contributes significantly to the overall market value, driven by its applicability in surveillance, mapping, and delivery operations. Growth is geographically diverse, with North America and Europe currently holding significant market share, but rapid technological adoption in the Asia-Pacific region presents substantial future growth potential.
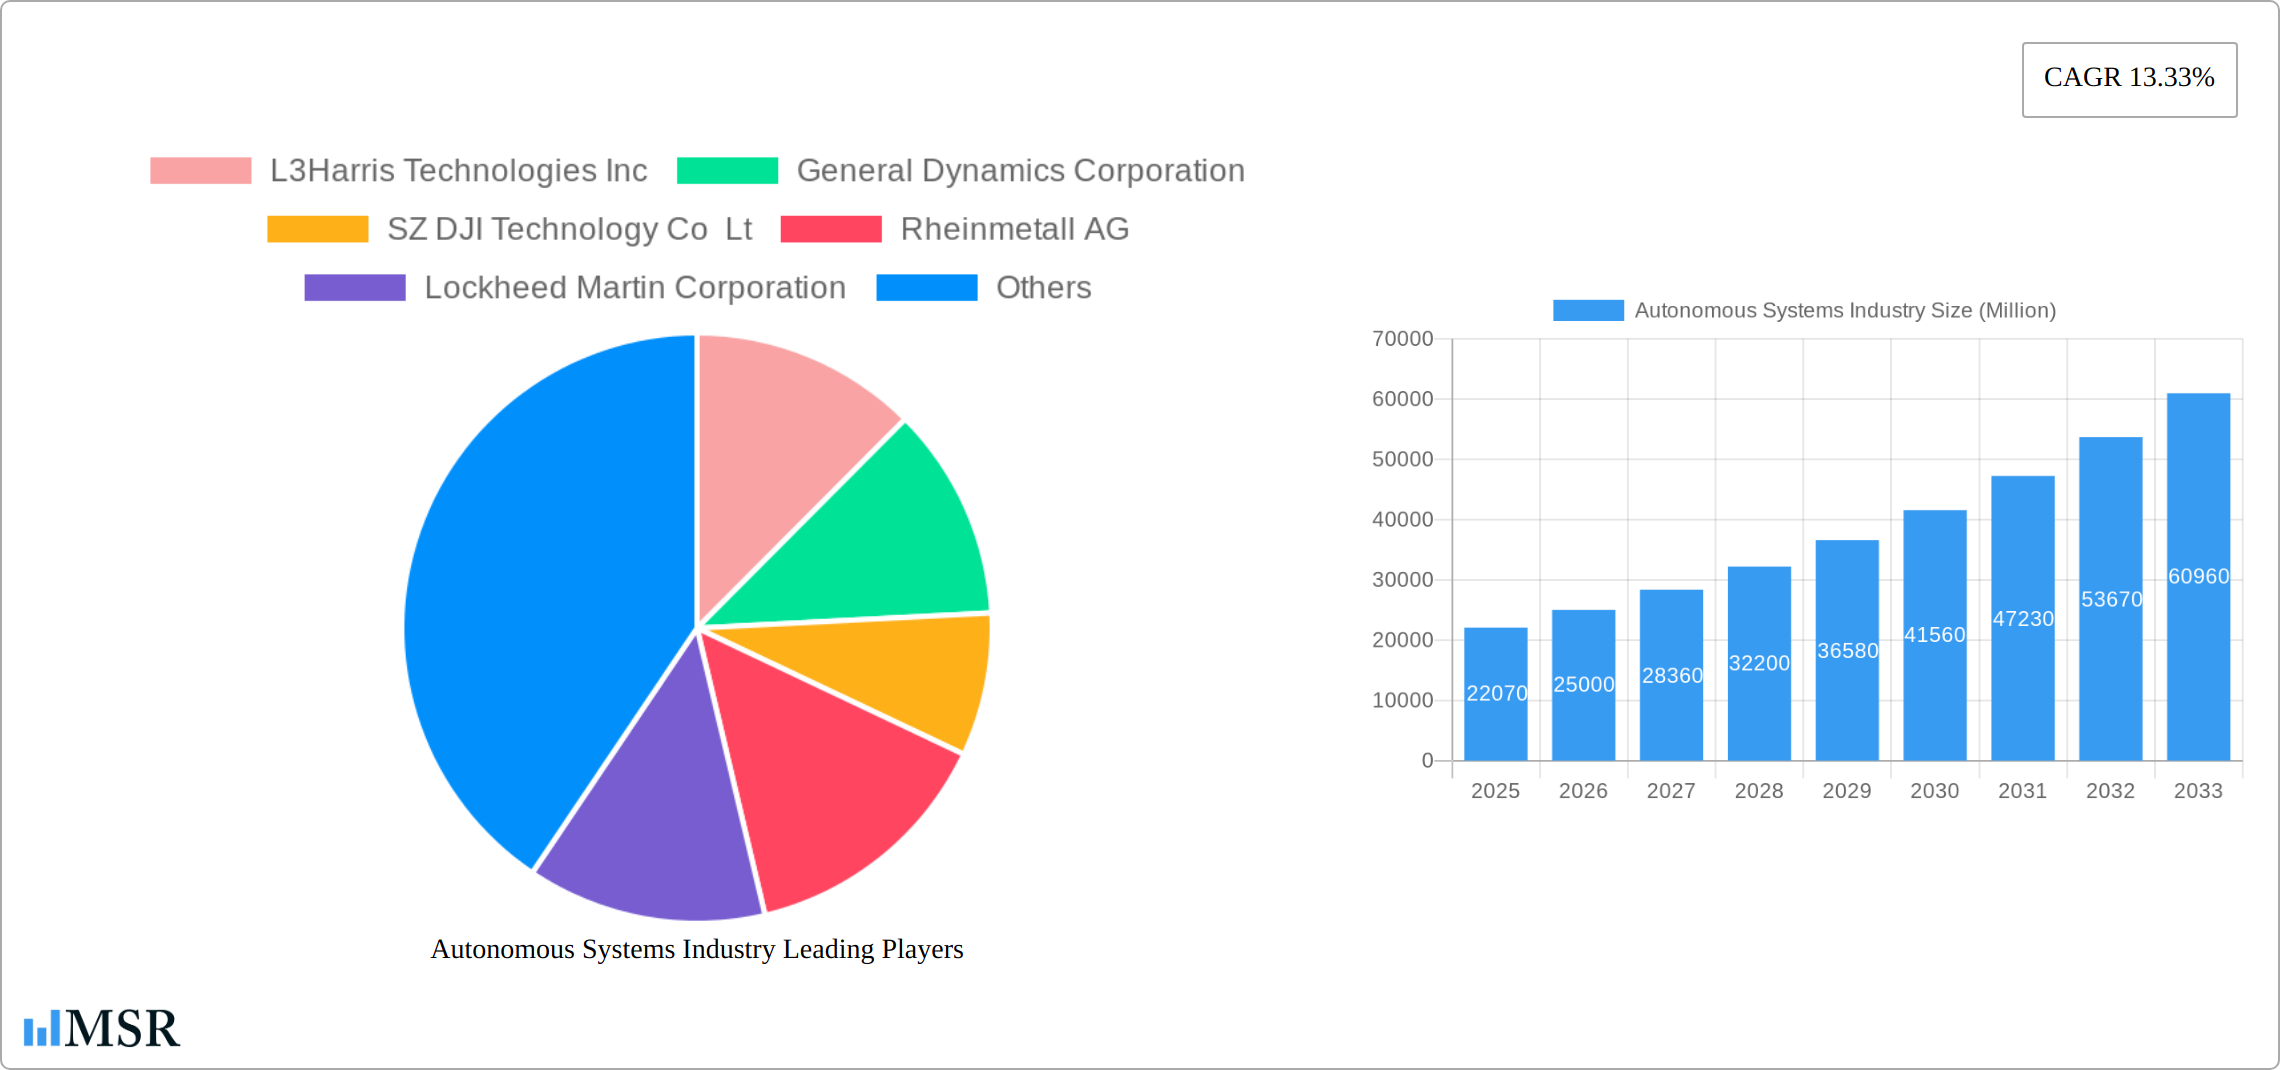
Autonomous Systems Industry Market Size (In Billion)
The industry's growth is not without its challenges. High initial investment costs for autonomous systems and the need for skilled personnel to operate and maintain these systems represent significant restraints. Concerns surrounding data security, regulatory frameworks, and ethical considerations related to autonomous operation also need careful consideration. However, ongoing technological advancements, decreasing costs, and increasing government investments in research and development are expected to mitigate these restraints. The segmental breakdown highlights the diverse applications of autonomous systems. The hybrid category, encompassing a combination of different unmanned platforms, is gaining traction owing to its adaptability and efficiency across multiple use cases. The continuous integration of AI and advanced analytics is expected to enhance the functionalities and expand the applications of autonomous systems, driving further market expansion in the forecast period.
Autonomous Systems Industry Company Market Share
Autonomous Systems Industry: A Comprehensive Market Report (2019-2033)
This in-depth report provides a comprehensive analysis of the Autonomous Systems industry, offering invaluable insights for stakeholders seeking to navigate this rapidly evolving market. The report covers the period from 2019 to 2033, with a focus on the 2025-2033 forecast period and includes detailed analysis of market size, CAGR, key players, and emerging trends. The total market value is projected to reach xx Million by 2033.
Autonomous Systems Industry Market Concentration & Dynamics
This section analyzes the competitive landscape of the autonomous systems sector, encompassing market concentration, innovation ecosystems, regulatory frameworks, substitute products, end-user trends, and mergers and acquisitions (M&A) activities. The study period (2019-2024) reveals a dynamic market with varying degrees of concentration across different segments. While the top 5 players held an estimated xx% market share in 2024, the overall landscape is characterized by both established industry giants and a surge of innovative startups.
- Market Concentration: While the top 10 players account for approximately xx% of the global market, indicating a moderately consolidated structure in some segments, other niche areas exhibit higher levels of competition and fragmentation. Smaller players and startups are actively competing through innovation, focusing on specialized applications and leveraging agile development methodologies to gain market share.
- Innovation Ecosystems: The industry is witnessing a flourishing of collaborative partnerships between technology companies, research institutions, government agencies, and even individual developers. These collaborations, fueled by open-source initiatives and technology sharing, are significantly accelerating development cycles and fostering rapid innovation. This collaborative approach is crucial for overcoming technical challenges and addressing safety concerns associated with autonomous systems.
- Regulatory Frameworks: The diverse and often inconsistent regulatory landscapes across different regions pose a significant challenge to the widespread adoption of autonomous systems. While harmonization efforts are underway internationally, significant disparities remain, creating complexities for companies seeking global market access. Navigating these regional differences requires significant investment in compliance and necessitates a flexible, adaptable approach to product development and deployment.
- Substitute Products: Autonomous systems are continuously competing with traditional manned systems, particularly in areas where the transition to automation is gradual. The competitive landscape also includes alternative technologies which may offer solutions to specific tasks or applications more cost-effectively or efficiently than current autonomous systems. This necessitates continuous evaluation and adaptation in the face of evolving technological advancements.
- End-User Trends: The burgeoning demand for automation across diverse sectors—including military, commercial, industrial, and logistics—is a major catalyst for market growth. This demand is driven by several key factors, such as the increasing need for improved efficiency, heightened safety concerns, and the relentless pursuit of cost reduction through automation.
- M&A Activities: The period from 2019-2024 witnessed a significant surge in M&A activity within the autonomous systems industry, exceeding xx deals. This trend reflects the strategic efforts of larger players to expand their portfolios, acquire cutting-edge technologies, and consolidate their market positions. This consolidation is expected to further shape the competitive landscape in the coming years.
Autonomous Systems Industry Industry Insights & Trends
This section provides a detailed overview of the autonomous systems market's growth drivers, technological disruptions, and evolving consumer behaviors. The global autonomous systems market size reached xx Million in 2024 and is projected to expand at a CAGR of xx% from 2025 to 2033, driven primarily by increasing demand for automation across diverse sectors.
Technological advancements such as improved sensor technologies, advanced artificial intelligence (AI), and enhanced computing power are fueling market growth. The adoption of autonomous systems is accelerating across military and law enforcement, as well as commercial applications. The integration of autonomous systems in various domains is altering consumer behavior and expectations, creating new opportunities and challenges for market players.
Key Markets & Segments Leading Autonomous Systems Industry
This section identifies the dominant regions, countries, and segments within the autonomous systems industry. The market is segmented by type (Unmanned Aerial Vehicles (UAVs), Large UAVs, Unmanned Ground Vehicles (UGVs)), application (Military and Law Enforcement, Commercial), and system type (Hybrid: Unmanned Sea Systems).
Dominant Segments:
- Type: Unmanned Aerial Vehicles (UAVs) represent the largest segment, driven by advancements in drone technology and expanding commercial applications. Large UAVs are experiencing significant growth due to increasing use in surveillance, logistics, and other sectors. The Unmanned Ground Vehicle (UGV) segment also shows promising growth, driven by the demand for automated transportation and other logistical operations.
- Application: Military and Law Enforcement applications dominate the market, owing to the strategic importance of autonomous systems in these sectors. Commercial applications are growing rapidly, driven by expanding uses in logistics, agriculture, inspection, and other industries.
- Hybrid: Unmanned Sea Systems: This segment is experiencing moderate growth driven by increasing investments in maritime surveillance and defense.
Drivers:
- Economic Growth: Strong economic growth in several regions is supporting investment in autonomous systems.
- Infrastructure Development: Investment in robust communication networks and infrastructure is crucial for the deployment of autonomous systems.
- Technological Advancements: Continuous advancements in AI, sensor technology, and robotics are key drivers of innovation.
- Government Regulations: Supportive government policies and regulations foster market growth.
Autonomous Systems Industry Product Developments
Recent years have witnessed significant advancements in autonomous system technologies. This includes the development of more sophisticated AI algorithms enabling improved decision-making and navigation capabilities, the integration of advanced sensors for enhanced situational awareness, and the use of more durable and reliable materials. These improvements are leading to increased performance, reduced operational costs, and expanded applications across various sectors, enhancing the competitive edge of leading companies in this dynamic market.
Challenges in the Autonomous Systems Industry Market
The autonomous systems market faces several key challenges, including stringent regulatory requirements that can delay product deployment and increase development costs. Supply chain disruptions caused by geopolitical events and resource constraints have impacted production timelines and costs. Finally, intense competition from established players and new entrants creates pressure on pricing and profitability. These factors have a quantifiable impact, potentially slowing the overall market growth by an estimated xx% in the short term.
Forces Driving Autonomous Systems Industry Growth
Several factors drive the long-term growth of the autonomous systems industry. These include rapid advancements in artificial intelligence, machine learning, and sensor technologies, reducing reliance on human intervention and enabling more complex tasks. Government initiatives encouraging investment in defense and commercial applications further accelerate the market expansion. The increasing demand for automation and improved efficiency across multiple sectors such as logistics, agriculture, and surveillance further boost this growth trajectory.
Long-Term Growth Catalysts in the Autonomous Systems Industry
Long-term growth is further fueled by collaborative innovation, driving the development of more sophisticated and adaptable autonomous systems. Strategic partnerships between technology firms and industry players accelerate development and market penetration. Market expansion into new geographical regions with emerging needs for automation contributes to sustained growth.
Emerging Opportunities in Autonomous Systems Industry
Emerging opportunities include expansion into new applications such as autonomous delivery systems, precision agriculture, and advanced infrastructure inspection. The development of more robust and resilient systems capable of operating in challenging environments, along with the integration of advanced communication technologies for better system control and data sharing, creates further opportunities. The rising adoption of autonomous systems in smart cities and urban environments represents another significant growth avenue.
Leading Players in the Autonomous Systems Industry Sector
Key Milestones in Autonomous Systems Industry Industry
- 2020: Increased investment in AI and autonomous systems R&D.
- 2021: Launch of several new autonomous vehicle models by major players.
- 2022: Several significant M&A deals reshape the market landscape.
- 2023: Regulatory changes impact market access in certain regions.
- 2024: Growing adoption of autonomous systems in commercial applications.
Strategic Outlook for Autonomous Systems Industry Market
The autonomous systems market is poised for significant growth in the coming years. Continued technological advancements, supportive government policies, and increasing demand from various sectors will drive market expansion. Strategic partnerships and investments in R&D will play a crucial role in shaping the future of this dynamic industry. The focus will be on developing more sophisticated and reliable systems that meet the evolving needs of a diverse range of applications.
Autonomous Systems Industry Segmentation
- 1. Production Analysis
- 2. Consumption Analysis
- 3. Import Market Analysis (Value & Volume)
- 4. Export Market Analysis (Value & Volume)
- 5. Price Trend Analysis
Autonomous Systems Industry Segmentation By Geography
-
1. North America
- 1.1. United States
- 1.2. Canada
- 1.3. Mexico
-
2. South America
- 2.1. Brazil
- 2.2. Argentina
- 2.3. Rest of South America
-
3. Europe
- 3.1. United Kingdom
- 3.2. Germany
- 3.3. France
- 3.4. Italy
- 3.5. Spain
- 3.6. Russia
- 3.7. Benelux
- 3.8. Nordics
- 3.9. Rest of Europe
-
4. Middle East & Africa
- 4.1. Turkey
- 4.2. Israel
- 4.3. GCC
- 4.4. North Africa
- 4.5. South Africa
- 4.6. Rest of Middle East & Africa
-
5. Asia Pacific
- 5.1. China
- 5.2. India
- 5.3. Japan
- 5.4. South Korea
- 5.5. ASEAN
- 5.6. Oceania
- 5.7. Rest of Asia Pacific
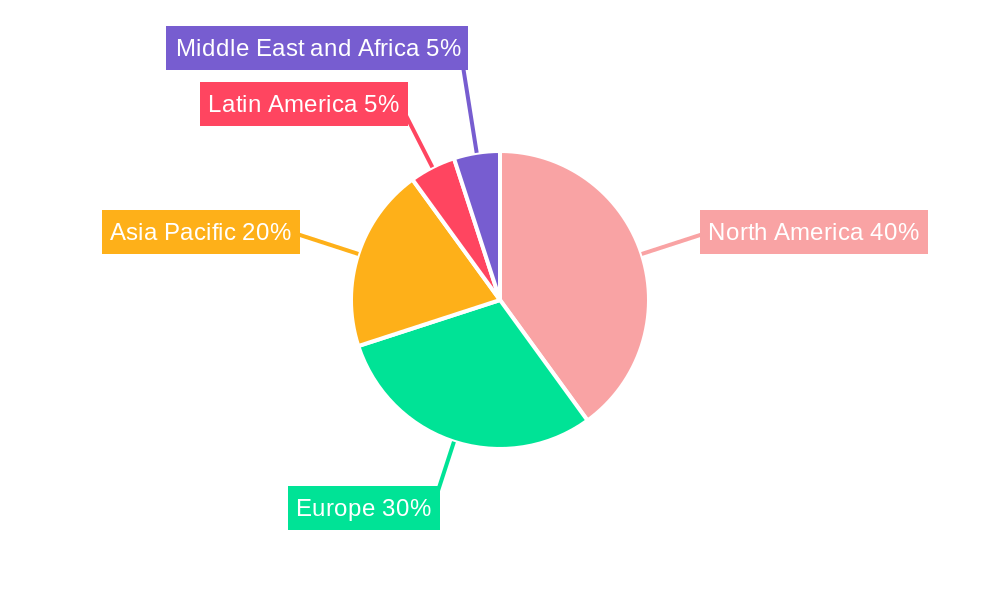
Autonomous Systems Industry Regional Market Share
Geographic Coverage of Autonomous Systems Industry
Autonomous Systems Industry REPORT HIGHLIGHTS
| Aspects | Details |
|---|---|
| Study Period | 2020-2034 |
| Base Year | 2025 |
| Estimated Year | 2026 |
| Forecast Period | 2026-2034 |
| Historical Period | 2020-2025 |
| Growth Rate | CAGR of 13.33% from 2020-2034 |
| Segmentation |
|
Table of Contents
- 1. Introduction
- 1.1. Research Scope
- 1.2. Market Segmentation
- 1.3. Research Objective
- 1.4. Definitions and Assumptions
- 2. Executive Summary
- 2.1. Market Snapshot
- 3. Market Dynamics
- 3.1. Market Drivers
- 3.2. Market Restrains
- 3.3. Market Trends
- 3.4. Market Opportunities
- 4. Market Factor Analysis
- 4.1. Porters Five Forces
- 4.1.1. Bargaining Power of Suppliers
- 4.1.2. Bargaining Power of Buyers
- 4.1.3. Threat of New Entrants
- 4.1.4. Threat of Substitutes
- 4.1.5. Competitive Rivalry
- 4.2. PESTEL analysis
- 4.3. BCG Analysis
- 4.3.1. Stars (High Growth, High Market Share)
- 4.3.2. Cash Cows (Low Growth, High Market Share)
- 4.3.3. Question Mark (High Growth, Low Market Share)
- 4.3.4. Dogs (Low Growth, Low Market Share)
- 4.4. Ansoff Matrix Analysis
- 4.5. Supply Chain Analysis
- 4.6. Regulatory Landscape
- 4.7. Current Market Potential and Opportunity Assessment (TAM–SAM–SOM Framework)
- 4.8. MSR Analyst Note
- 4.1. Porters Five Forces
- 5. Market Analysis, Insights and Forecast 2021-2033
- 5.1. Market Analysis, Insights and Forecast - by Production Analysis
- 5.2. Market Analysis, Insights and Forecast - by Consumption Analysis
- 5.3. Market Analysis, Insights and Forecast - by Import Market Analysis (Value & Volume)
- 5.4. Market Analysis, Insights and Forecast - by Export Market Analysis (Value & Volume)
- 5.5. Market Analysis, Insights and Forecast - by Price Trend Analysis
- 5.6. Market Analysis, Insights and Forecast - by Region
- 5.6.1. North America
- 5.6.2. South America
- 5.6.3. Europe
- 5.6.4. Middle East & Africa
- 5.6.5. Asia Pacific
- 6. Global Autonomous Systems Industry Analysis, Insights and Forecast, 2021-2033
- 6.1. Market Analysis, Insights and Forecast - by Production Analysis
- 6.2. Market Analysis, Insights and Forecast - by Consumption Analysis
- 6.3. Market Analysis, Insights and Forecast - by Import Market Analysis (Value & Volume)
- 6.4. Market Analysis, Insights and Forecast - by Export Market Analysis (Value & Volume)
- 6.5. Market Analysis, Insights and Forecast - by Price Trend Analysis
- 7. North America Autonomous Systems Industry Analysis, Insights and Forecast, 2020-2032
- 7.1. Market Analysis, Insights and Forecast - by Production Analysis
- 7.2. Market Analysis, Insights and Forecast - by Consumption Analysis
- 7.3. Market Analysis, Insights and Forecast - by Import Market Analysis (Value & Volume)
- 7.4. Market Analysis, Insights and Forecast - by Export Market Analysis (Value & Volume)
- 7.5. Market Analysis, Insights and Forecast - by Price Trend Analysis
- 8. South America Autonomous Systems Industry Analysis, Insights and Forecast, 2020-2032
- 8.1. Market Analysis, Insights and Forecast - by Production Analysis
- 8.2. Market Analysis, Insights and Forecast - by Consumption Analysis
- 8.3. Market Analysis, Insights and Forecast - by Import Market Analysis (Value & Volume)
- 8.4. Market Analysis, Insights and Forecast - by Export Market Analysis (Value & Volume)
- 8.5. Market Analysis, Insights and Forecast - by Price Trend Analysis
- 9. Europe Autonomous Systems Industry Analysis, Insights and Forecast, 2020-2032
- 9.1. Market Analysis, Insights and Forecast - by Production Analysis
- 9.2. Market Analysis, Insights and Forecast - by Consumption Analysis
- 9.3. Market Analysis, Insights and Forecast - by Import Market Analysis (Value & Volume)
- 9.4. Market Analysis, Insights and Forecast - by Export Market Analysis (Value & Volume)
- 9.5. Market Analysis, Insights and Forecast - by Price Trend Analysis
- 10. Middle East & Africa Autonomous Systems Industry Analysis, Insights and Forecast, 2020-2032
- 10.1. Market Analysis, Insights and Forecast - by Production Analysis
- 10.2. Market Analysis, Insights and Forecast - by Consumption Analysis
- 10.3. Market Analysis, Insights and Forecast - by Import Market Analysis (Value & Volume)
- 10.4. Market Analysis, Insights and Forecast - by Export Market Analysis (Value & Volume)
- 10.5. Market Analysis, Insights and Forecast - by Price Trend Analysis
- 11. Asia Pacific Autonomous Systems Industry Analysis, Insights and Forecast, 2020-2032
- 11.1. Market Analysis, Insights and Forecast - by Production Analysis
- 11.2. Market Analysis, Insights and Forecast - by Consumption Analysis
- 11.3. Market Analysis, Insights and Forecast - by Import Market Analysis (Value & Volume)
- 11.4. Market Analysis, Insights and Forecast - by Export Market Analysis (Value & Volume)
- 11.5. Market Analysis, Insights and Forecast - by Price Trend Analysis
- 12. Competitive Analysis
- 12.1. Company Profiles
- 12.1.1 L3Harris Technologies Inc
- 12.1.1.1. Company Overview
- 12.1.1.2. Products
- 12.1.1.3. Company Financials
- 12.1.1.4. SWOT Analysis
- 12.1.2 General Dynamics Corporation
- 12.1.2.1. Company Overview
- 12.1.2.2. Products
- 12.1.2.3. Company Financials
- 12.1.2.4. SWOT Analysis
- 12.1.3 SZ DJI Technology Co Lt
- 12.1.3.1. Company Overview
- 12.1.3.2. Products
- 12.1.3.3. Company Financials
- 12.1.3.4. SWOT Analysis
- 12.1.4 Rheinmetall AG
- 12.1.4.1. Company Overview
- 12.1.4.2. Products
- 12.1.4.3. Company Financials
- 12.1.4.4. SWOT Analysis
- 12.1.5 Lockheed Martin Corporation
- 12.1.5.1. Company Overview
- 12.1.5.2. Products
- 12.1.5.3. Company Financials
- 12.1.5.4. SWOT Analysis
- 12.1.6 Elbit Systems Ltd
- 12.1.6.1. Company Overview
- 12.1.6.2. Products
- 12.1.6.3. Company Financials
- 12.1.6.4. SWOT Analysis
- 12.1.7 ECA Group
- 12.1.7.1. Company Overview
- 12.1.7.2. Products
- 12.1.7.3. Company Financials
- 12.1.7.4. SWOT Analysis
- 12.1.8 QinetiQ Group
- 12.1.8.1. Company Overview
- 12.1.8.2. Products
- 12.1.8.3. Company Financials
- 12.1.8.4. SWOT Analysis
- 12.1.9 BAE Systems PLC
- 12.1.9.1. Company Overview
- 12.1.9.2. Products
- 12.1.9.3. Company Financials
- 12.1.9.4. SWOT Analysis
- 12.1.10 Israel Aerospace Industries Ltd
- 12.1.10.1. Company Overview
- 12.1.10.2. Products
- 12.1.10.3. Company Financials
- 12.1.10.4. SWOT Analysis
- 12.1.11 Northrop Grumman Corporation
- 12.1.11.1. Company Overview
- 12.1.11.2. Products
- 12.1.11.3. Company Financials
- 12.1.11.4. SWOT Analysis
- 12.1.12 Saab AB
- 12.1.12.1. Company Overview
- 12.1.12.2. Products
- 12.1.12.3. Company Financials
- 12.1.12.4. SWOT Analysis
- 12.1.13 The Boeing Company
- 12.1.13.1. Company Overview
- 12.1.13.2. Products
- 12.1.13.3. Company Financials
- 12.1.13.4. SWOT Analysis
- 12.1.14 Teledyne FLIR LLC
- 12.1.14.1. Company Overview
- 12.1.14.2. Products
- 12.1.14.3. Company Financials
- 12.1.14.4. SWOT Analysis
- 12.1.1 L3Harris Technologies Inc
- 12.2. Market Entropy
- 12.2.1 Company's Key Areas Served
- 12.2.2 Recent Developments
- 12.3. Company Market Share Analysis 2025
- 12.3.1 Top 5 Companies Market Share Analysis
- 12.3.2 Top 3 Companies Market Share Analysis
- 12.4. List of Potential Customers
- 13. Research Methodology
List of Figures
- Figure 1: Global Autonomous Systems Industry Revenue Breakdown (Million, %) by Region 2025 & 2033
- Figure 2: North America Autonomous Systems Industry Revenue (Million), by Production Analysis 2025 & 2033
- Figure 3: North America Autonomous Systems Industry Revenue Share (%), by Production Analysis 2025 & 2033
- Figure 4: North America Autonomous Systems Industry Revenue (Million), by Consumption Analysis 2025 & 2033
- Figure 5: North America Autonomous Systems Industry Revenue Share (%), by Consumption Analysis 2025 & 2033
- Figure 6: North America Autonomous Systems Industry Revenue (Million), by Import Market Analysis (Value & Volume) 2025 & 2033
- Figure 7: North America Autonomous Systems Industry Revenue Share (%), by Import Market Analysis (Value & Volume) 2025 & 2033
- Figure 8: North America Autonomous Systems Industry Revenue (Million), by Export Market Analysis (Value & Volume) 2025 & 2033
- Figure 9: North America Autonomous Systems Industry Revenue Share (%), by Export Market Analysis (Value & Volume) 2025 & 2033
- Figure 10: North America Autonomous Systems Industry Revenue (Million), by Price Trend Analysis 2025 & 2033
- Figure 11: North America Autonomous Systems Industry Revenue Share (%), by Price Trend Analysis 2025 & 2033
- Figure 12: North America Autonomous Systems Industry Revenue (Million), by Country 2025 & 2033
- Figure 13: North America Autonomous Systems Industry Revenue Share (%), by Country 2025 & 2033
- Figure 14: South America Autonomous Systems Industry Revenue (Million), by Production Analysis 2025 & 2033
- Figure 15: South America Autonomous Systems Industry Revenue Share (%), by Production Analysis 2025 & 2033
- Figure 16: South America Autonomous Systems Industry Revenue (Million), by Consumption Analysis 2025 & 2033
- Figure 17: South America Autonomous Systems Industry Revenue Share (%), by Consumption Analysis 2025 & 2033
- Figure 18: South America Autonomous Systems Industry Revenue (Million), by Import Market Analysis (Value & Volume) 2025 & 2033
- Figure 19: South America Autonomous Systems Industry Revenue Share (%), by Import Market Analysis (Value & Volume) 2025 & 2033
- Figure 20: South America Autonomous Systems Industry Revenue (Million), by Export Market Analysis (Value & Volume) 2025 & 2033
- Figure 21: South America Autonomous Systems Industry Revenue Share (%), by Export Market Analysis (Value & Volume) 2025 & 2033
- Figure 22: South America Autonomous Systems Industry Revenue (Million), by Price Trend Analysis 2025 & 2033
- Figure 23: South America Autonomous Systems Industry Revenue Share (%), by Price Trend Analysis 2025 & 2033
- Figure 24: South America Autonomous Systems Industry Revenue (Million), by Country 2025 & 2033
- Figure 25: South America Autonomous Systems Industry Revenue Share (%), by Country 2025 & 2033
- Figure 26: Europe Autonomous Systems Industry Revenue (Million), by Production Analysis 2025 & 2033
- Figure 27: Europe Autonomous Systems Industry Revenue Share (%), by Production Analysis 2025 & 2033
- Figure 28: Europe Autonomous Systems Industry Revenue (Million), by Consumption Analysis 2025 & 2033
- Figure 29: Europe Autonomous Systems Industry Revenue Share (%), by Consumption Analysis 2025 & 2033
- Figure 30: Europe Autonomous Systems Industry Revenue (Million), by Import Market Analysis (Value & Volume) 2025 & 2033
- Figure 31: Europe Autonomous Systems Industry Revenue Share (%), by Import Market Analysis (Value & Volume) 2025 & 2033
- Figure 32: Europe Autonomous Systems Industry Revenue (Million), by Export Market Analysis (Value & Volume) 2025 & 2033
- Figure 33: Europe Autonomous Systems Industry Revenue Share (%), by Export Market Analysis (Value & Volume) 2025 & 2033
- Figure 34: Europe Autonomous Systems Industry Revenue (Million), by Price Trend Analysis 2025 & 2033
- Figure 35: Europe Autonomous Systems Industry Revenue Share (%), by Price Trend Analysis 2025 & 2033
- Figure 36: Europe Autonomous Systems Industry Revenue (Million), by Country 2025 & 2033
- Figure 37: Europe Autonomous Systems Industry Revenue Share (%), by Country 2025 & 2033
- Figure 38: Middle East & Africa Autonomous Systems Industry Revenue (Million), by Production Analysis 2025 & 2033
- Figure 39: Middle East & Africa Autonomous Systems Industry Revenue Share (%), by Production Analysis 2025 & 2033
- Figure 40: Middle East & Africa Autonomous Systems Industry Revenue (Million), by Consumption Analysis 2025 & 2033
- Figure 41: Middle East & Africa Autonomous Systems Industry Revenue Share (%), by Consumption Analysis 2025 & 2033
- Figure 42: Middle East & Africa Autonomous Systems Industry Revenue (Million), by Import Market Analysis (Value & Volume) 2025 & 2033
- Figure 43: Middle East & Africa Autonomous Systems Industry Revenue Share (%), by Import Market Analysis (Value & Volume) 2025 & 2033
- Figure 44: Middle East & Africa Autonomous Systems Industry Revenue (Million), by Export Market Analysis (Value & Volume) 2025 & 2033
- Figure 45: Middle East & Africa Autonomous Systems Industry Revenue Share (%), by Export Market Analysis (Value & Volume) 2025 & 2033
- Figure 46: Middle East & Africa Autonomous Systems Industry Revenue (Million), by Price Trend Analysis 2025 & 2033
- Figure 47: Middle East & Africa Autonomous Systems Industry Revenue Share (%), by Price Trend Analysis 2025 & 2033
- Figure 48: Middle East & Africa Autonomous Systems Industry Revenue (Million), by Country 2025 & 2033
- Figure 49: Middle East & Africa Autonomous Systems Industry Revenue Share (%), by Country 2025 & 2033
- Figure 50: Asia Pacific Autonomous Systems Industry Revenue (Million), by Production Analysis 2025 & 2033
- Figure 51: Asia Pacific Autonomous Systems Industry Revenue Share (%), by Production Analysis 2025 & 2033
- Figure 52: Asia Pacific Autonomous Systems Industry Revenue (Million), by Consumption Analysis 2025 & 2033
- Figure 53: Asia Pacific Autonomous Systems Industry Revenue Share (%), by Consumption Analysis 2025 & 2033
- Figure 54: Asia Pacific Autonomous Systems Industry Revenue (Million), by Import Market Analysis (Value & Volume) 2025 & 2033
- Figure 55: Asia Pacific Autonomous Systems Industry Revenue Share (%), by Import Market Analysis (Value & Volume) 2025 & 2033
- Figure 56: Asia Pacific Autonomous Systems Industry Revenue (Million), by Export Market Analysis (Value & Volume) 2025 & 2033
- Figure 57: Asia Pacific Autonomous Systems Industry Revenue Share (%), by Export Market Analysis (Value & Volume) 2025 & 2033
- Figure 58: Asia Pacific Autonomous Systems Industry Revenue (Million), by Price Trend Analysis 2025 & 2033
- Figure 59: Asia Pacific Autonomous Systems Industry Revenue Share (%), by Price Trend Analysis 2025 & 2033
- Figure 60: Asia Pacific Autonomous Systems Industry Revenue (Million), by Country 2025 & 2033
- Figure 61: Asia Pacific Autonomous Systems Industry Revenue Share (%), by Country 2025 & 2033
List of Tables
- Table 1: Global Autonomous Systems Industry Revenue Million Forecast, by Production Analysis 2020 & 2033
- Table 2: Global Autonomous Systems Industry Revenue Million Forecast, by Consumption Analysis 2020 & 2033
- Table 3: Global Autonomous Systems Industry Revenue Million Forecast, by Import Market Analysis (Value & Volume) 2020 & 2033
- Table 4: Global Autonomous Systems Industry Revenue Million Forecast, by Export Market Analysis (Value & Volume) 2020 & 2033
- Table 5: Global Autonomous Systems Industry Revenue Million Forecast, by Price Trend Analysis 2020 & 2033
- Table 6: Global Autonomous Systems Industry Revenue Million Forecast, by Region 2020 & 2033
- Table 7: Global Autonomous Systems Industry Revenue Million Forecast, by Production Analysis 2020 & 2033
- Table 8: Global Autonomous Systems Industry Revenue Million Forecast, by Consumption Analysis 2020 & 2033
- Table 9: Global Autonomous Systems Industry Revenue Million Forecast, by Import Market Analysis (Value & Volume) 2020 & 2033
- Table 10: Global Autonomous Systems Industry Revenue Million Forecast, by Export Market Analysis (Value & Volume) 2020 & 2033
- Table 11: Global Autonomous Systems Industry Revenue Million Forecast, by Price Trend Analysis 2020 & 2033
- Table 12: Global Autonomous Systems Industry Revenue Million Forecast, by Country 2020 & 2033
- Table 13: United States Autonomous Systems Industry Revenue (Million) Forecast, by Application 2020 & 2033
- Table 14: Canada Autonomous Systems Industry Revenue (Million) Forecast, by Application 2020 & 2033
- Table 15: Mexico Autonomous Systems Industry Revenue (Million) Forecast, by Application 2020 & 2033
- Table 16: Global Autonomous Systems Industry Revenue Million Forecast, by Production Analysis 2020 & 2033
- Table 17: Global Autonomous Systems Industry Revenue Million Forecast, by Consumption Analysis 2020 & 2033
- Table 18: Global Autonomous Systems Industry Revenue Million Forecast, by Import Market Analysis (Value & Volume) 2020 & 2033
- Table 19: Global Autonomous Systems Industry Revenue Million Forecast, by Export Market Analysis (Value & Volume) 2020 & 2033
- Table 20: Global Autonomous Systems Industry Revenue Million Forecast, by Price Trend Analysis 2020 & 2033
- Table 21: Global Autonomous Systems Industry Revenue Million Forecast, by Country 2020 & 2033
- Table 22: Brazil Autonomous Systems Industry Revenue (Million) Forecast, by Application 2020 & 2033
- Table 23: Argentina Autonomous Systems Industry Revenue (Million) Forecast, by Application 2020 & 2033
- Table 24: Rest of South America Autonomous Systems Industry Revenue (Million) Forecast, by Application 2020 & 2033
- Table 25: Global Autonomous Systems Industry Revenue Million Forecast, by Production Analysis 2020 & 2033
- Table 26: Global Autonomous Systems Industry Revenue Million Forecast, by Consumption Analysis 2020 & 2033
- Table 27: Global Autonomous Systems Industry Revenue Million Forecast, by Import Market Analysis (Value & Volume) 2020 & 2033
- Table 28: Global Autonomous Systems Industry Revenue Million Forecast, by Export Market Analysis (Value & Volume) 2020 & 2033
- Table 29: Global Autonomous Systems Industry Revenue Million Forecast, by Price Trend Analysis 2020 & 2033
- Table 30: Global Autonomous Systems Industry Revenue Million Forecast, by Country 2020 & 2033
- Table 31: United Kingdom Autonomous Systems Industry Revenue (Million) Forecast, by Application 2020 & 2033
- Table 32: Germany Autonomous Systems Industry Revenue (Million) Forecast, by Application 2020 & 2033
- Table 33: France Autonomous Systems Industry Revenue (Million) Forecast, by Application 2020 & 2033
- Table 34: Italy Autonomous Systems Industry Revenue (Million) Forecast, by Application 2020 & 2033
- Table 35: Spain Autonomous Systems Industry Revenue (Million) Forecast, by Application 2020 & 2033
- Table 36: Russia Autonomous Systems Industry Revenue (Million) Forecast, by Application 2020 & 2033
- Table 37: Benelux Autonomous Systems Industry Revenue (Million) Forecast, by Application 2020 & 2033
- Table 38: Nordics Autonomous Systems Industry Revenue (Million) Forecast, by Application 2020 & 2033
- Table 39: Rest of Europe Autonomous Systems Industry Revenue (Million) Forecast, by Application 2020 & 2033
- Table 40: Global Autonomous Systems Industry Revenue Million Forecast, by Production Analysis 2020 & 2033
- Table 41: Global Autonomous Systems Industry Revenue Million Forecast, by Consumption Analysis 2020 & 2033
- Table 42: Global Autonomous Systems Industry Revenue Million Forecast, by Import Market Analysis (Value & Volume) 2020 & 2033
- Table 43: Global Autonomous Systems Industry Revenue Million Forecast, by Export Market Analysis (Value & Volume) 2020 & 2033
- Table 44: Global Autonomous Systems Industry Revenue Million Forecast, by Price Trend Analysis 2020 & 2033
- Table 45: Global Autonomous Systems Industry Revenue Million Forecast, by Country 2020 & 2033
- Table 46: Turkey Autonomous Systems Industry Revenue (Million) Forecast, by Application 2020 & 2033
- Table 47: Israel Autonomous Systems Industry Revenue (Million) Forecast, by Application 2020 & 2033
- Table 48: GCC Autonomous Systems Industry Revenue (Million) Forecast, by Application 2020 & 2033
- Table 49: North Africa Autonomous Systems Industry Revenue (Million) Forecast, by Application 2020 & 2033
- Table 50: South Africa Autonomous Systems Industry Revenue (Million) Forecast, by Application 2020 & 2033
- Table 51: Rest of Middle East & Africa Autonomous Systems Industry Revenue (Million) Forecast, by Application 2020 & 2033
- Table 52: Global Autonomous Systems Industry Revenue Million Forecast, by Production Analysis 2020 & 2033
- Table 53: Global Autonomous Systems Industry Revenue Million Forecast, by Consumption Analysis 2020 & 2033
- Table 54: Global Autonomous Systems Industry Revenue Million Forecast, by Import Market Analysis (Value & Volume) 2020 & 2033
- Table 55: Global Autonomous Systems Industry Revenue Million Forecast, by Export Market Analysis (Value & Volume) 2020 & 2033
- Table 56: Global Autonomous Systems Industry Revenue Million Forecast, by Price Trend Analysis 2020 & 2033
- Table 57: Global Autonomous Systems Industry Revenue Million Forecast, by Country 2020 & 2033
- Table 58: China Autonomous Systems Industry Revenue (Million) Forecast, by Application 2020 & 2033
- Table 59: India Autonomous Systems Industry Revenue (Million) Forecast, by Application 2020 & 2033
- Table 60: Japan Autonomous Systems Industry Revenue (Million) Forecast, by Application 2020 & 2033
- Table 61: South Korea Autonomous Systems Industry Revenue (Million) Forecast, by Application 2020 & 2033
- Table 62: ASEAN Autonomous Systems Industry Revenue (Million) Forecast, by Application 2020 & 2033
- Table 63: Oceania Autonomous Systems Industry Revenue (Million) Forecast, by Application 2020 & 2033
- Table 64: Rest of Asia Pacific Autonomous Systems Industry Revenue (Million) Forecast, by Application 2020 & 2033
Frequently Asked Questions
1. What is the projected Compound Annual Growth Rate (CAGR) of the Autonomous Systems Industry?
The projected CAGR is approximately 13.33%.
2. Which companies are prominent players in the Autonomous Systems Industry?
Key companies in the market include L3Harris Technologies Inc, General Dynamics Corporation, SZ DJI Technology Co Lt, Rheinmetall AG, Lockheed Martin Corporation, Elbit Systems Ltd, ECA Group, QinetiQ Group, BAE Systems PLC, Israel Aerospace Industries Ltd, Northrop Grumman Corporation, Saab AB, The Boeing Company, Teledyne FLIR LLC.
3. What are the main segments of the Autonomous Systems Industry?
The market segments include Production Analysis, Consumption Analysis, Import Market Analysis (Value & Volume), Export Market Analysis (Value & Volume), Price Trend Analysis.
4. Can you provide details about the market size?
The market size is estimated to be USD 22.07 Million as of 2022.
5. What are some drivers contributing to market growth?
; Increasing Number Of Air Passengers; Use Of Portable Electronic Devices.
6. What are the notable trends driving market growth?
The Unmanned Aerial Vehicles Segment to Witness the Highest Growth During the Forecast Period.
7. Are there any restraints impacting market growth?
; High Cost Of Connectivity Equipments.
8. Can you provide examples of recent developments in the market?
N/A
9. What pricing options are available for accessing the report?
Pricing options include single-user, multi-user, and enterprise licenses priced at USD 4750, USD 5250, and USD 8750 respectively.
10. Is the market size provided in terms of value or volume?
The market size is provided in terms of value, measured in Million.
11. Are there any specific market keywords associated with the report?
Yes, the market keyword associated with the report is "Autonomous Systems Industry," which aids in identifying and referencing the specific market segment covered.
12. How do I determine which pricing option suits my needs best?
The pricing options vary based on user requirements and access needs. Individual users may opt for single-user licenses, while businesses requiring broader access may choose multi-user or enterprise licenses for cost-effective access to the report.
13. Are there any additional resources or data provided in the Autonomous Systems Industry report?
While the report offers comprehensive insights, it's advisable to review the specific contents or supplementary materials provided to ascertain if additional resources or data are available.
14. How can I stay updated on further developments or reports in the Autonomous Systems Industry?
To stay informed about further developments, trends, and reports in the Autonomous Systems Industry, consider subscribing to industry newsletters, following relevant companies and organizations, or regularly checking reputable industry news sources and publications.
Methodology
Step 1 - Identification of Relevant Samples Size from Population Database


Step 2 - Approaches for Defining Global Market Size (Value, Volume* & Price*)

Note*: In applicable scenarios
Step 3 - Data Sources
Primary Research
- Web Analytics
- Survey Reports
- Research Institute
- Latest Research Reports
- Opinion Leaders
Secondary Research
- Annual Reports
- White Paper
- Latest Press Release
- Industry Association
- Paid Database
- Investor Presentations

Step 4 - Data Triangulation
Involves using different sources of information in order to increase the validity of a study
These sources are likely to be stakeholders in a program - participants, other researchers, program staff, other community members, and so on.
Then we put all data in single framework & apply various statistical tools to find out the dynamic on the market.
During the analysis stage, feedback from the stakeholder groups would be compared to determine areas of agreement as well as areas of divergence