

Key Insights
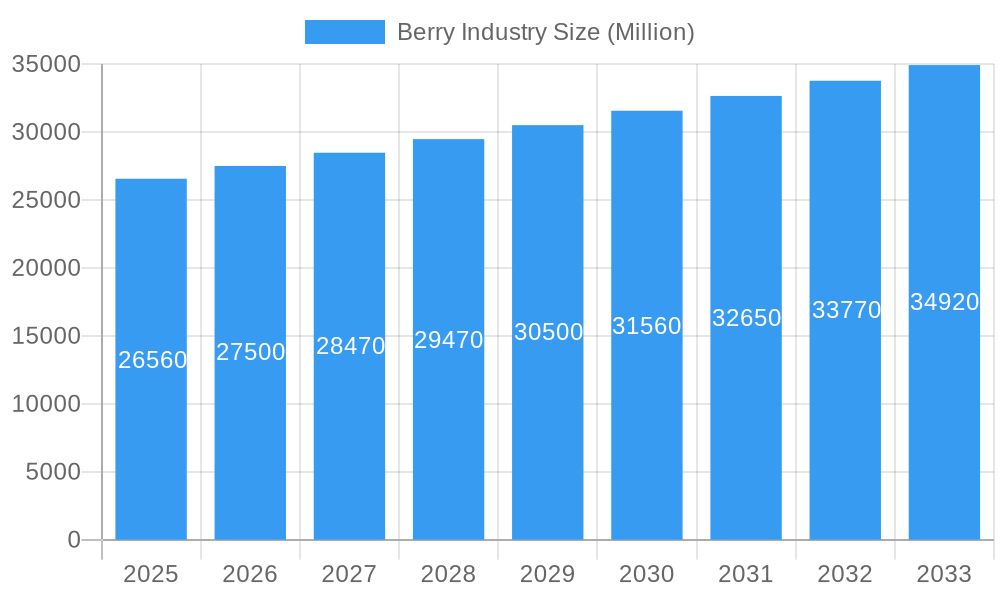
The global berry industry, valued at $26.56 billion in 2025, is projected to experience robust growth, driven by increasing consumer demand for healthy and convenient food options. The compound annual growth rate (CAGR) of 3.70% from 2025 to 2033 indicates a significant expansion of the market over the forecast period. Key drivers include the rising popularity of berries in various food and beverage applications, fueled by their nutritional benefits and versatile flavor profiles. Growing health consciousness among consumers, coupled with the increasing prevalence of chronic diseases, is further boosting demand for functional foods like berries, rich in antioxidants and vitamins. The convenience of frozen and processed berries is also contributing to market growth, offering consumers a readily available option throughout the year. While potential restraints such as seasonal availability and susceptibility to spoilage exist, technological advancements in preservation and distribution are mitigating these challenges. The market segmentation reveals a diverse landscape, with fresh berries maintaining a significant share, closely followed by frozen berries, which benefit from their extended shelf life. The processed berry products segment is anticipated to witness considerable growth driven by innovation in value-added products like jams, juices, and dietary supplements. Geographic analysis shows strong market penetration across North America and Europe, while Asia-Pacific is emerging as a high-growth region driven by rising disposable incomes and changing dietary habits.
Berry Industry Market Size (In Billion)
The competitive landscape is characterized by both large multinational corporations and smaller regional players. Key companies like Driscoll's, Naturipe Farms, and Hortifrut are leveraging their strong brand recognition and distribution networks to capture significant market share. However, the industry is also witnessing increased competition from emerging players offering innovative products and sustainable farming practices. Future growth will be shaped by factors such as product innovation, sustainable farming practices, and the development of robust supply chains to meet the increasing global demand for berries. Furthermore, strategic collaborations between berry producers, food processors, and retailers will be crucial in driving market expansion. The focus on enhancing product quality, expanding distribution channels, and exploring new markets presents significant opportunities for growth within the berry industry over the coming years. Investing in research and development to improve berry varieties and introduce novel products will be a key factor in maintaining market competitiveness.
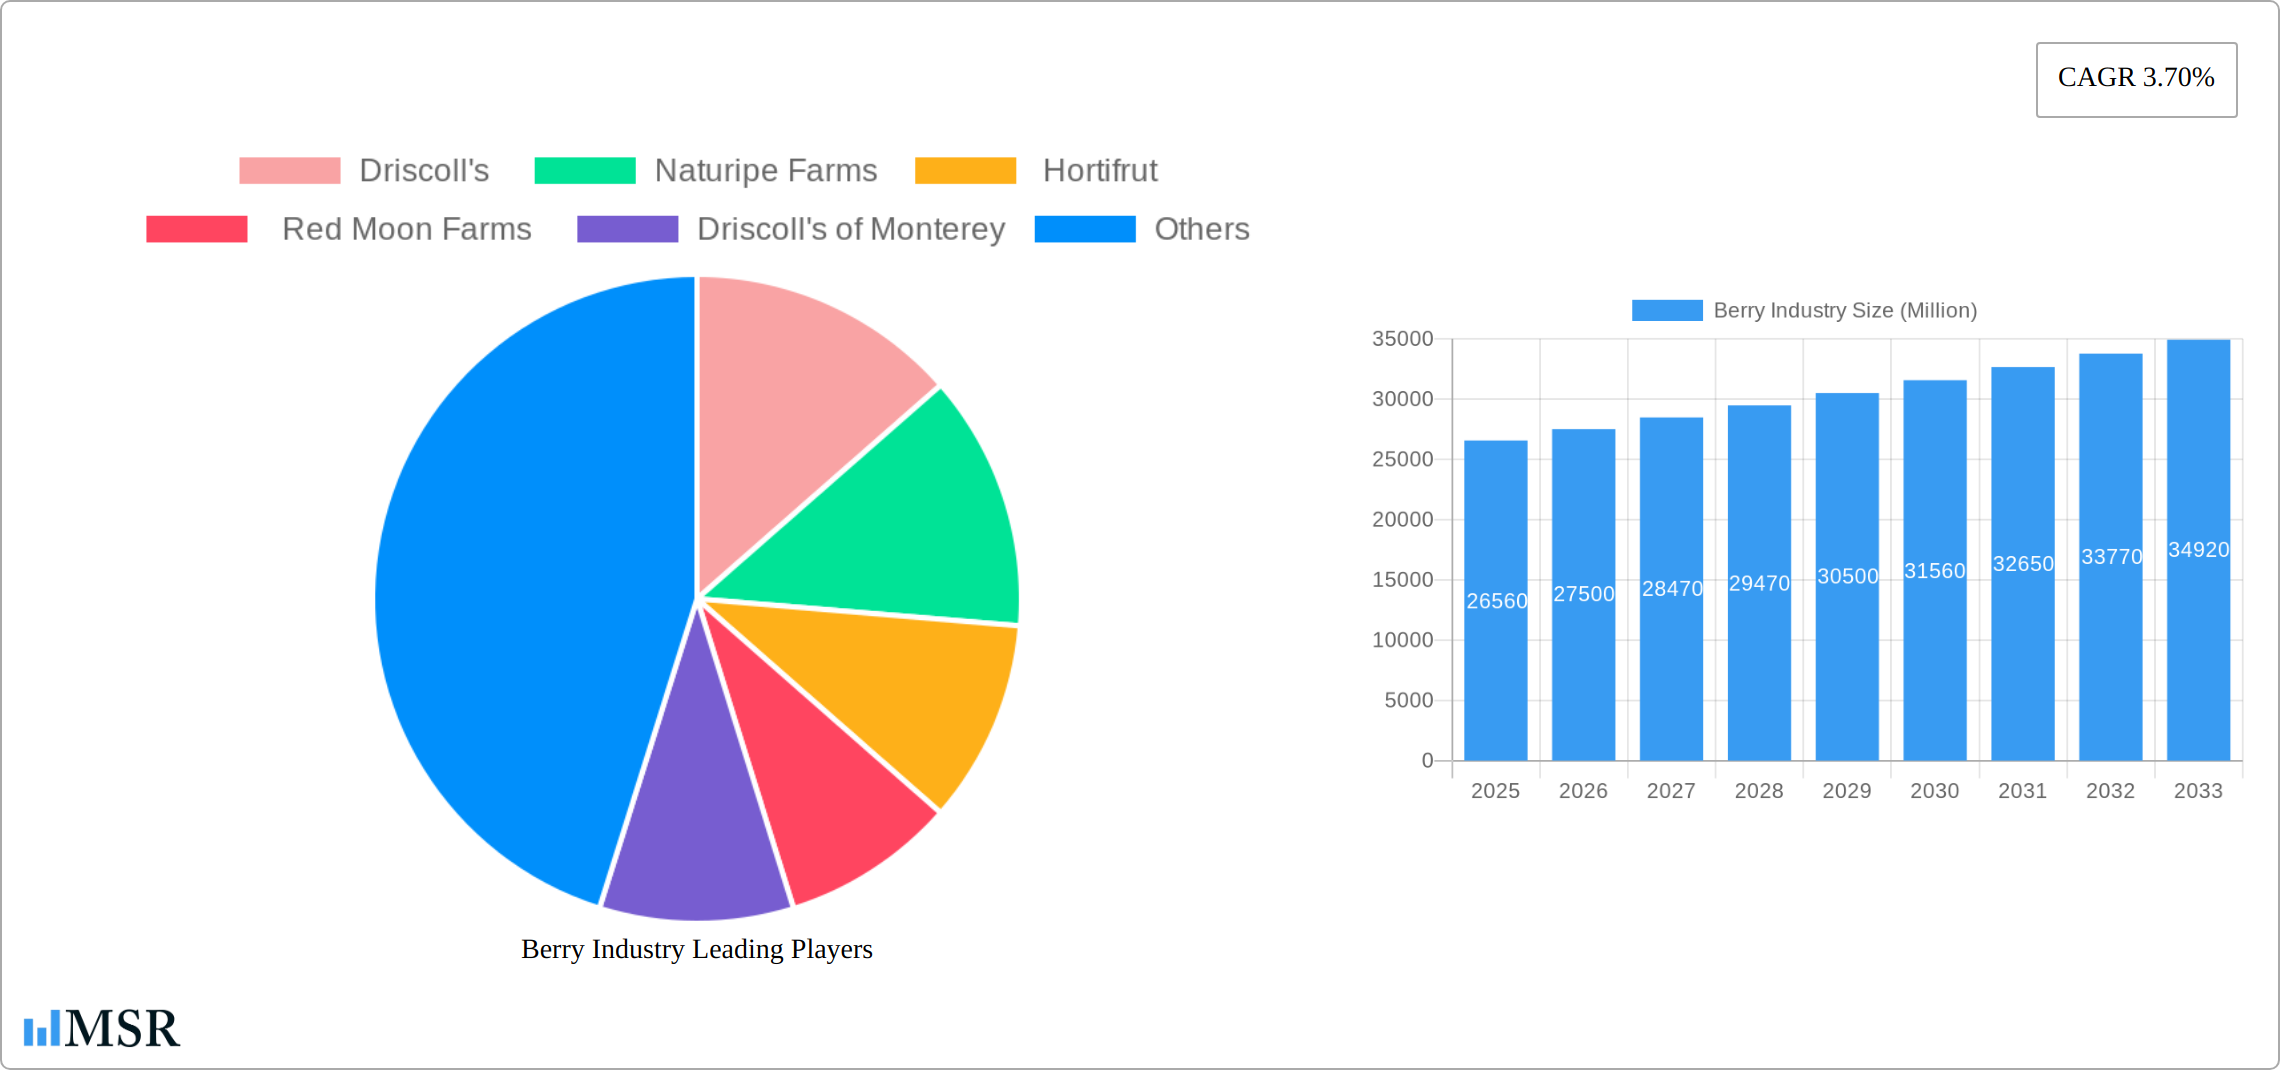
Berry Industry Company Market Share
Berry Industry Market Report: 2019-2033
This comprehensive report provides a detailed analysis of the global berry industry, offering invaluable insights for stakeholders, investors, and industry professionals. The report covers the period 2019-2033, with a focus on the 2025-2033 forecast period, and examines key market trends, competitive dynamics, and future growth opportunities within the $XX Million berry market. This report analyzes the market segments across various berry types (fresh, frozen, dried, processed) and applications (food & beverage, retail, healthcare), highlighting leading players like Driscoll's, Naturipe Farms, Hortifrut, and Red Moon Farms.
Berry Industry Market Concentration & Dynamics
The global berry market exhibits a moderately concentrated structure, with major players like Driscoll's and Naturipe Farms holding significant market share. The exact figures for 2024 market share are xx%, xx%, and xx% for Driscoll's, Naturipe Farms, and Hortifrut respectively. However, several smaller regional players and emerging brands contribute to the overall market dynamism. Innovation is a key driver, with companies continuously developing new varieties and processing techniques to meet evolving consumer preferences. The industry operates within a relatively well-established regulatory framework focused on food safety and traceability. Substitute products, such as other fruits and fruit-based products, exert a certain level of competitive pressure. End-user trends, particularly towards healthier and more convenient options, significantly influence market growth. M&A activity has been relatively steady in recent years, with xx major deals recorded between 2019 and 2024. This reflects ongoing consolidation and efforts to expand market reach and product portfolios.
- Market Share (2024): Driscoll's (xx%), Naturipe Farms (xx%), Hortifrut (xx%), Others (xx%)
- M&A Deal Count (2019-2024): xx
Berry Industry Industry Insights & Trends
The global berry industry is experiencing robust growth, driven by increasing consumer demand for healthy and convenient food options. The market size in 2024 was estimated at $XX Million, with a Compound Annual Growth Rate (CAGR) of xx% projected from 2025 to 2033. Several factors contribute to this growth, including rising disposable incomes in developing economies, increasing health consciousness among consumers, and the growing popularity of berries in various food and beverage applications. Technological advancements in cultivation, processing, and packaging have improved efficiency and product quality, further fueling market expansion. Changing consumer preferences, such as the demand for organic and sustainably produced berries, are also shaping industry trends. The rise of e-commerce and direct-to-consumer sales channels is another notable development impacting market dynamics. The overall trend suggests an increasingly sophisticated and competitive market, with opportunities for both established players and new entrants.
Key Markets & Segments Leading Berry Industry
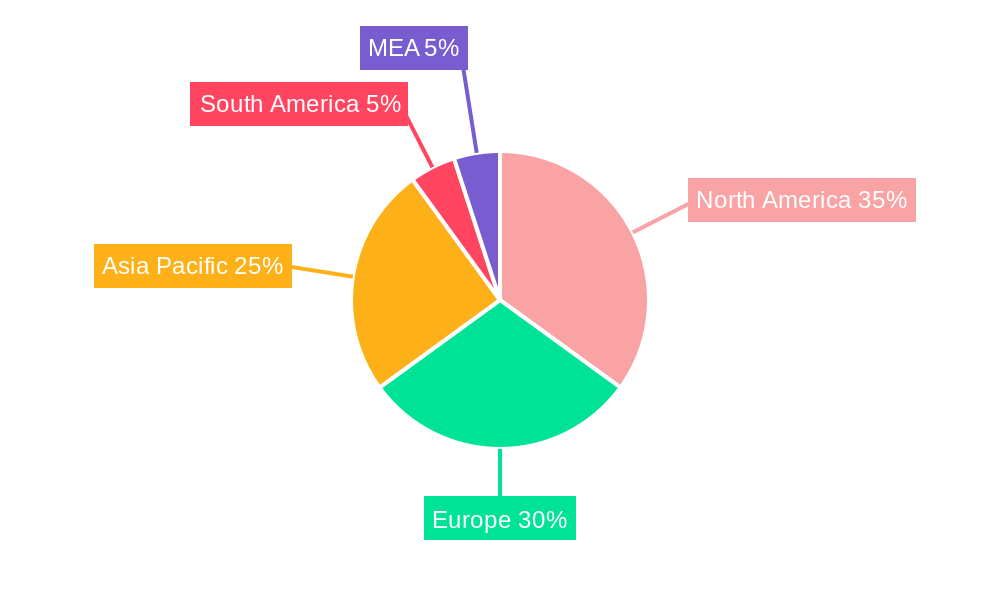
The North American region currently dominates the global berry market, followed by Europe. Within these regions, the United States and several European countries exhibit strong demand. The fresh berry segment accounts for the largest share of the market, driven by its superior flavor and nutritional profile. However, the frozen and processed berry segments are experiencing rapid growth, owing to their extended shelf life and convenience. The Food & Beverage industry represents the primary application sector, with significant utilization in various products such as jams, jellies, juices, yogurts, and baked goods. The retail sector, including supermarkets and grocery stores, constitutes the largest distribution channel. The healthcare industry is also an emerging application sector, given berries' rich antioxidant and nutritional properties.
- Dominant Region: North America
- Dominant Segment (Type): Fresh Berries
- Dominant Segment (Application): Food and Beverage Industry
- Growth Drivers: Rising disposable incomes, increasing health awareness, technological advancements, and evolving retail landscapes.
Berry Industry Product Developments
The berry industry is experiencing a dynamic period of innovation, with a continuous stream of new varieties engineered for superior taste, extended freshness, and amplified nutritional content. A significant trend is the burgeoning focus on organic and ethically sourced berries, a direct response to the escalating consumer preference for sustainable and healthier food options. Furthermore, cutting-edge cultivation methods, including the sophisticated applications of precision agriculture and the adoption of vertical farming systems, are revolutionizing crop yields and operational efficiencies. These advancements are not merely incremental; they are foundational to achieving competitive advantages and expanding market presence within the global berry landscape.
Challenges in the Berry Industry Market
The berry industry faces several challenges, including:
- Supply chain disruptions: These can lead to price volatility and impact product availability. The estimated impact on the market value in 2024 was $XX Million due to disruptions.
- Regulatory hurdles: Meeting stringent food safety and quality standards across different regions presents logistical and financial challenges.
- Competitive pressures: The market is becoming increasingly competitive, necessitating innovation and effective marketing strategies to maintain a strong market position.
Forces Driving Berry Industry Growth
Several potent forces are propelling the expansion of the berry industry:
- Technological Advancements: The integration of precision agriculture, innovative packaging solutions that extend shelf life, and streamlined processing techniques are significantly boosting both productivity and the overall quality of berry products.
- Economic Growth and Rising Disposable Incomes: As economies flourish, particularly in emerging markets, consumers have greater discretionary spending power, which directly translates into increased demand for premium and nutritious foods like berries.
- Health and Wellness Trends: The pervasive and growing consumer consciousness regarding the profound health benefits associated with berry consumption – from their antioxidant properties to their vitamin content – is a primary catalyst for sustained market growth.
- Consumer Demand for Convenience: The modern consumer increasingly seeks convenient and ready-to-eat options, driving innovation in pre-packaged and processed berry products.
Long-Term Growth Catalysts in Berry Industry
Long-term growth in the berry industry will be fueled by continued innovation in berry varieties and cultivation methods, strategic partnerships to expand distribution networks, and exploration of new markets in both developed and developing economies. The ongoing development of value-added berry products will also play a crucial role in future growth.
Emerging Opportunities in Berry Industry
The landscape of opportunities within the berry industry is rich and varied. This includes strategic expansion into untapped or high-growth potential international markets, the pioneering development of functional berry-based products that leverage specific health-promoting ingredients and compounds, and the widespread adoption of advanced sustainable farming practices designed to resonate deeply with an increasingly environmentally aware consumer base. Furthermore, the exploration of novel berry cultivars and the development of specialized processing techniques for unique berry types present exciting avenues for market differentiation.
Leading Players in the Berry Industry Sector
- Driscoll's
- Naturipe Farms
- Hortifrut
- Red Moon Farms
- Driscoll's of Monterey
- Fresh Del Monte Produce
- Sun Berry Sourcing
Key Milestones in Berry Industry Industry
- October 2023: Naturipe Farms launched the “Sweet Selections” premium berries line, a strategic move that significantly enhanced their product portfolio and directly targeted the discerning premium segment of the market.
- May 2022: Driscoll's unveiled Tropical Bliss, a distinctive new premium strawberry line, which further solidified their leading position in the highly competitive high-flavor segment of the berry market.
- January 2024: Hortifrut announced a significant investment in advanced hydroponic technology, signaling a commitment to increasing year-round production and improving sustainability.
- November 2023: A consortium of berry growers launched a new traceability initiative utilizing blockchain technology, aiming to provide consumers with unparalleled transparency regarding product origin and ethical sourcing.
Strategic Outlook for Berry Industry Market
The berry industry is poised for sustained growth in the coming years, driven by a confluence of factors including increasing consumer demand, technological advancements, and the ongoing expansion of retail channels. Strategic opportunities exist for companies to capitalize on these trends by investing in research and development, expanding their product portfolios, and optimizing their supply chains. The market is expected to reach $XX Million by 2033, representing significant growth potential for industry players.
Berry Industry Segmentation
- 1. Production Analysis
- 2. Consumption Analysis
- 3. Import Market Analysis (Value & Volume)
- 4. Export Market Analysis (Value & Volume)
- 5. Price Trend Analysis
Berry Industry Segmentation By Geography
-
1. North America
- 1.1. United States
- 1.2. Canada
-
2. Europe
- 2.1. Germany
- 2.2. United Kingdom
- 2.3. France
- 2.4. Spain
- 2.5. Netherlands
- 2.6. Poland
-
3. Asia Pacific
- 3.1. China
- 3.2. Australia
- 3.3. India
- 3.4. Japan
-
4. South America
- 4.1. Brazil
- 4.2. Argentina
-
5. Africa
- 5.1. South Africa
- 5.2. Egypt
Berry Industry Regional Market Share
Geographic Coverage of Berry Industry
Berry Industry REPORT HIGHLIGHTS
| Aspects | Details |
|---|---|
| Study Period | 2020-2034 |
| Base Year | 2025 |
| Estimated Year | 2026 |
| Forecast Period | 2026-2034 |
| Historical Period | 2020-2025 |
| Growth Rate | CAGR of 3.70% from 2020-2034 |
| Segmentation |
|
Table of Contents
- 1. Introduction
- 1.1. Research Scope
- 1.2. Market Segmentation
- 1.3. Research Objective
- 1.4. Definitions and Assumptions
- 2. Executive Summary
- 2.1. Market Snapshot
- 3. Market Dynamics
- 3.1. Market Drivers
- 3.2. Market Restrains
- 3.3. Market Trends
- 3.4. Market Opportunities
- 4. Market Factor Analysis
- 4.1. Porters Five Forces
- 4.1.1. Bargaining Power of Suppliers
- 4.1.2. Bargaining Power of Buyers
- 4.1.3. Threat of New Entrants
- 4.1.4. Threat of Substitutes
- 4.1.5. Competitive Rivalry
- 4.2. PESTEL analysis
- 4.3. BCG Analysis
- 4.3.1. Stars (High Growth, High Market Share)
- 4.3.2. Cash Cows (Low Growth, High Market Share)
- 4.3.3. Question Mark (High Growth, Low Market Share)
- 4.3.4. Dogs (Low Growth, Low Market Share)
- 4.4. Ansoff Matrix Analysis
- 4.5. Supply Chain Analysis
- 4.6. Regulatory Landscape
- 4.7. Current Market Potential and Opportunity Assessment (TAM–SAM–SOM Framework)
- 4.8. MSR Analyst Note
- 4.1. Porters Five Forces
- 5. Market Analysis, Insights and Forecast 2021-2033
- 5.1. Market Analysis, Insights and Forecast - by Production Analysis
- 5.2. Market Analysis, Insights and Forecast - by Consumption Analysis
- 5.3. Market Analysis, Insights and Forecast - by Import Market Analysis (Value & Volume)
- 5.4. Market Analysis, Insights and Forecast - by Export Market Analysis (Value & Volume)
- 5.5. Market Analysis, Insights and Forecast - by Price Trend Analysis
- 5.6. Market Analysis, Insights and Forecast - by Region
- 5.6.1. North America
- 5.6.2. Europe
- 5.6.3. Asia Pacific
- 5.6.4. South America
- 5.6.5. Africa
- 6. Global Berry Industry Analysis, Insights and Forecast, 2021-2033
- 6.1. Market Analysis, Insights and Forecast - by Production Analysis
- 6.2. Market Analysis, Insights and Forecast - by Consumption Analysis
- 6.3. Market Analysis, Insights and Forecast - by Import Market Analysis (Value & Volume)
- 6.4. Market Analysis, Insights and Forecast - by Export Market Analysis (Value & Volume)
- 6.5. Market Analysis, Insights and Forecast - by Price Trend Analysis
- 7. North America Berry Industry Analysis, Insights and Forecast, 2020-2032
- 7.1. Market Analysis, Insights and Forecast - by Production Analysis
- 7.2. Market Analysis, Insights and Forecast - by Consumption Analysis
- 7.3. Market Analysis, Insights and Forecast - by Import Market Analysis (Value & Volume)
- 7.4. Market Analysis, Insights and Forecast - by Export Market Analysis (Value & Volume)
- 7.5. Market Analysis, Insights and Forecast - by Price Trend Analysis
- 8. Europe Berry Industry Analysis, Insights and Forecast, 2020-2032
- 8.1. Market Analysis, Insights and Forecast - by Production Analysis
- 8.2. Market Analysis, Insights and Forecast - by Consumption Analysis
- 8.3. Market Analysis, Insights and Forecast - by Import Market Analysis (Value & Volume)
- 8.4. Market Analysis, Insights and Forecast - by Export Market Analysis (Value & Volume)
- 8.5. Market Analysis, Insights and Forecast - by Price Trend Analysis
- 9. Asia Pacific Berry Industry Analysis, Insights and Forecast, 2020-2032
- 9.1. Market Analysis, Insights and Forecast - by Production Analysis
- 9.2. Market Analysis, Insights and Forecast - by Consumption Analysis
- 9.3. Market Analysis, Insights and Forecast - by Import Market Analysis (Value & Volume)
- 9.4. Market Analysis, Insights and Forecast - by Export Market Analysis (Value & Volume)
- 9.5. Market Analysis, Insights and Forecast - by Price Trend Analysis
- 10. South America Berry Industry Analysis, Insights and Forecast, 2020-2032
- 10.1. Market Analysis, Insights and Forecast - by Production Analysis
- 10.2. Market Analysis, Insights and Forecast - by Consumption Analysis
- 10.3. Market Analysis, Insights and Forecast - by Import Market Analysis (Value & Volume)
- 10.4. Market Analysis, Insights and Forecast - by Export Market Analysis (Value & Volume)
- 10.5. Market Analysis, Insights and Forecast - by Price Trend Analysis
- 11. Africa Berry Industry Analysis, Insights and Forecast, 2020-2032
- 11.1. Market Analysis, Insights and Forecast - by Production Analysis
- 11.2. Market Analysis, Insights and Forecast - by Consumption Analysis
- 11.3. Market Analysis, Insights and Forecast - by Import Market Analysis (Value & Volume)
- 11.4. Market Analysis, Insights and Forecast - by Export Market Analysis (Value & Volume)
- 11.5. Market Analysis, Insights and Forecast - by Price Trend Analysis
- 12. Competitive Analysis
- 12.1. Company Profiles
- 12.1.1 Driscoll's
- 12.1.1.1. Company Overview
- 12.1.1.2. Products
- 12.1.1.3. Company Financials
- 12.1.1.4. SWOT Analysis
- 12.1.2 Naturipe Farms
- 12.1.2.1. Company Overview
- 12.1.2.2. Products
- 12.1.2.3. Company Financials
- 12.1.2.4. SWOT Analysis
- 12.1.3 Hortifrut
- 12.1.3.1. Company Overview
- 12.1.3.2. Products
- 12.1.3.3. Company Financials
- 12.1.3.4. SWOT Analysis
- 12.1.4 Red Moon Farms
- 12.1.4.1. Company Overview
- 12.1.4.2. Products
- 12.1.4.3. Company Financials
- 12.1.4.4. SWOT Analysis
- 12.1.5 Driscoll's of Monterey
- 12.1.5.1. Company Overview
- 12.1.5.2. Products
- 12.1.5.3. Company Financials
- 12.1.5.4. SWOT Analysis
- 12.1.1 Driscoll's
- 12.2. Market Entropy
- 12.2.1 Company's Key Areas Served
- 12.2.2 Recent Developments
- 12.3. Company Market Share Analysis 2025
- 12.3.1 Top 5 Companies Market Share Analysis
- 12.3.2 Top 3 Companies Market Share Analysis
- 12.4. List of Potential Customers
- 13. Research Methodology
List of Figures
- Figure 1: Global Berry Industry Revenue Breakdown (Million, %) by Region 2025 & 2033
- Figure 2: North America Berry Industry Revenue (Million), by Production Analysis 2025 & 2033
- Figure 3: North America Berry Industry Revenue Share (%), by Production Analysis 2025 & 2033
- Figure 4: North America Berry Industry Revenue (Million), by Consumption Analysis 2025 & 2033
- Figure 5: North America Berry Industry Revenue Share (%), by Consumption Analysis 2025 & 2033
- Figure 6: North America Berry Industry Revenue (Million), by Import Market Analysis (Value & Volume) 2025 & 2033
- Figure 7: North America Berry Industry Revenue Share (%), by Import Market Analysis (Value & Volume) 2025 & 2033
- Figure 8: North America Berry Industry Revenue (Million), by Export Market Analysis (Value & Volume) 2025 & 2033
- Figure 9: North America Berry Industry Revenue Share (%), by Export Market Analysis (Value & Volume) 2025 & 2033
- Figure 10: North America Berry Industry Revenue (Million), by Price Trend Analysis 2025 & 2033
- Figure 11: North America Berry Industry Revenue Share (%), by Price Trend Analysis 2025 & 2033
- Figure 12: North America Berry Industry Revenue (Million), by Country 2025 & 2033
- Figure 13: North America Berry Industry Revenue Share (%), by Country 2025 & 2033
- Figure 14: Europe Berry Industry Revenue (Million), by Production Analysis 2025 & 2033
- Figure 15: Europe Berry Industry Revenue Share (%), by Production Analysis 2025 & 2033
- Figure 16: Europe Berry Industry Revenue (Million), by Consumption Analysis 2025 & 2033
- Figure 17: Europe Berry Industry Revenue Share (%), by Consumption Analysis 2025 & 2033
- Figure 18: Europe Berry Industry Revenue (Million), by Import Market Analysis (Value & Volume) 2025 & 2033
- Figure 19: Europe Berry Industry Revenue Share (%), by Import Market Analysis (Value & Volume) 2025 & 2033
- Figure 20: Europe Berry Industry Revenue (Million), by Export Market Analysis (Value & Volume) 2025 & 2033
- Figure 21: Europe Berry Industry Revenue Share (%), by Export Market Analysis (Value & Volume) 2025 & 2033
- Figure 22: Europe Berry Industry Revenue (Million), by Price Trend Analysis 2025 & 2033
- Figure 23: Europe Berry Industry Revenue Share (%), by Price Trend Analysis 2025 & 2033
- Figure 24: Europe Berry Industry Revenue (Million), by Country 2025 & 2033
- Figure 25: Europe Berry Industry Revenue Share (%), by Country 2025 & 2033
- Figure 26: Asia Pacific Berry Industry Revenue (Million), by Production Analysis 2025 & 2033
- Figure 27: Asia Pacific Berry Industry Revenue Share (%), by Production Analysis 2025 & 2033
- Figure 28: Asia Pacific Berry Industry Revenue (Million), by Consumption Analysis 2025 & 2033
- Figure 29: Asia Pacific Berry Industry Revenue Share (%), by Consumption Analysis 2025 & 2033
- Figure 30: Asia Pacific Berry Industry Revenue (Million), by Import Market Analysis (Value & Volume) 2025 & 2033
- Figure 31: Asia Pacific Berry Industry Revenue Share (%), by Import Market Analysis (Value & Volume) 2025 & 2033
- Figure 32: Asia Pacific Berry Industry Revenue (Million), by Export Market Analysis (Value & Volume) 2025 & 2033
- Figure 33: Asia Pacific Berry Industry Revenue Share (%), by Export Market Analysis (Value & Volume) 2025 & 2033
- Figure 34: Asia Pacific Berry Industry Revenue (Million), by Price Trend Analysis 2025 & 2033
- Figure 35: Asia Pacific Berry Industry Revenue Share (%), by Price Trend Analysis 2025 & 2033
- Figure 36: Asia Pacific Berry Industry Revenue (Million), by Country 2025 & 2033
- Figure 37: Asia Pacific Berry Industry Revenue Share (%), by Country 2025 & 2033
- Figure 38: South America Berry Industry Revenue (Million), by Production Analysis 2025 & 2033
- Figure 39: South America Berry Industry Revenue Share (%), by Production Analysis 2025 & 2033
- Figure 40: South America Berry Industry Revenue (Million), by Consumption Analysis 2025 & 2033
- Figure 41: South America Berry Industry Revenue Share (%), by Consumption Analysis 2025 & 2033
- Figure 42: South America Berry Industry Revenue (Million), by Import Market Analysis (Value & Volume) 2025 & 2033
- Figure 43: South America Berry Industry Revenue Share (%), by Import Market Analysis (Value & Volume) 2025 & 2033
- Figure 44: South America Berry Industry Revenue (Million), by Export Market Analysis (Value & Volume) 2025 & 2033
- Figure 45: South America Berry Industry Revenue Share (%), by Export Market Analysis (Value & Volume) 2025 & 2033
- Figure 46: South America Berry Industry Revenue (Million), by Price Trend Analysis 2025 & 2033
- Figure 47: South America Berry Industry Revenue Share (%), by Price Trend Analysis 2025 & 2033
- Figure 48: South America Berry Industry Revenue (Million), by Country 2025 & 2033
- Figure 49: South America Berry Industry Revenue Share (%), by Country 2025 & 2033
- Figure 50: Africa Berry Industry Revenue (Million), by Production Analysis 2025 & 2033
- Figure 51: Africa Berry Industry Revenue Share (%), by Production Analysis 2025 & 2033
- Figure 52: Africa Berry Industry Revenue (Million), by Consumption Analysis 2025 & 2033
- Figure 53: Africa Berry Industry Revenue Share (%), by Consumption Analysis 2025 & 2033
- Figure 54: Africa Berry Industry Revenue (Million), by Import Market Analysis (Value & Volume) 2025 & 2033
- Figure 55: Africa Berry Industry Revenue Share (%), by Import Market Analysis (Value & Volume) 2025 & 2033
- Figure 56: Africa Berry Industry Revenue (Million), by Export Market Analysis (Value & Volume) 2025 & 2033
- Figure 57: Africa Berry Industry Revenue Share (%), by Export Market Analysis (Value & Volume) 2025 & 2033
- Figure 58: Africa Berry Industry Revenue (Million), by Price Trend Analysis 2025 & 2033
- Figure 59: Africa Berry Industry Revenue Share (%), by Price Trend Analysis 2025 & 2033
- Figure 60: Africa Berry Industry Revenue (Million), by Country 2025 & 2033
- Figure 61: Africa Berry Industry Revenue Share (%), by Country 2025 & 2033
List of Tables
- Table 1: Global Berry Industry Revenue Million Forecast, by Production Analysis 2020 & 2033
- Table 2: Global Berry Industry Revenue Million Forecast, by Consumption Analysis 2020 & 2033
- Table 3: Global Berry Industry Revenue Million Forecast, by Import Market Analysis (Value & Volume) 2020 & 2033
- Table 4: Global Berry Industry Revenue Million Forecast, by Export Market Analysis (Value & Volume) 2020 & 2033
- Table 5: Global Berry Industry Revenue Million Forecast, by Price Trend Analysis 2020 & 2033
- Table 6: Global Berry Industry Revenue Million Forecast, by Region 2020 & 2033
- Table 7: Global Berry Industry Revenue Million Forecast, by Production Analysis 2020 & 2033
- Table 8: Global Berry Industry Revenue Million Forecast, by Consumption Analysis 2020 & 2033
- Table 9: Global Berry Industry Revenue Million Forecast, by Import Market Analysis (Value & Volume) 2020 & 2033
- Table 10: Global Berry Industry Revenue Million Forecast, by Export Market Analysis (Value & Volume) 2020 & 2033
- Table 11: Global Berry Industry Revenue Million Forecast, by Price Trend Analysis 2020 & 2033
- Table 12: Global Berry Industry Revenue Million Forecast, by Country 2020 & 2033
- Table 13: United States Berry Industry Revenue (Million) Forecast, by Application 2020 & 2033
- Table 14: Canada Berry Industry Revenue (Million) Forecast, by Application 2020 & 2033
- Table 15: Global Berry Industry Revenue Million Forecast, by Production Analysis 2020 & 2033
- Table 16: Global Berry Industry Revenue Million Forecast, by Consumption Analysis 2020 & 2033
- Table 17: Global Berry Industry Revenue Million Forecast, by Import Market Analysis (Value & Volume) 2020 & 2033
- Table 18: Global Berry Industry Revenue Million Forecast, by Export Market Analysis (Value & Volume) 2020 & 2033
- Table 19: Global Berry Industry Revenue Million Forecast, by Price Trend Analysis 2020 & 2033
- Table 20: Global Berry Industry Revenue Million Forecast, by Country 2020 & 2033
- Table 21: Germany Berry Industry Revenue (Million) Forecast, by Application 2020 & 2033
- Table 22: United Kingdom Berry Industry Revenue (Million) Forecast, by Application 2020 & 2033
- Table 23: France Berry Industry Revenue (Million) Forecast, by Application 2020 & 2033
- Table 24: Spain Berry Industry Revenue (Million) Forecast, by Application 2020 & 2033
- Table 25: Netherlands Berry Industry Revenue (Million) Forecast, by Application 2020 & 2033
- Table 26: Poland Berry Industry Revenue (Million) Forecast, by Application 2020 & 2033
- Table 27: Global Berry Industry Revenue Million Forecast, by Production Analysis 2020 & 2033
- Table 28: Global Berry Industry Revenue Million Forecast, by Consumption Analysis 2020 & 2033
- Table 29: Global Berry Industry Revenue Million Forecast, by Import Market Analysis (Value & Volume) 2020 & 2033
- Table 30: Global Berry Industry Revenue Million Forecast, by Export Market Analysis (Value & Volume) 2020 & 2033
- Table 31: Global Berry Industry Revenue Million Forecast, by Price Trend Analysis 2020 & 2033
- Table 32: Global Berry Industry Revenue Million Forecast, by Country 2020 & 2033
- Table 33: China Berry Industry Revenue (Million) Forecast, by Application 2020 & 2033
- Table 34: Australia Berry Industry Revenue (Million) Forecast, by Application 2020 & 2033
- Table 35: India Berry Industry Revenue (Million) Forecast, by Application 2020 & 2033
- Table 36: Japan Berry Industry Revenue (Million) Forecast, by Application 2020 & 2033
- Table 37: Global Berry Industry Revenue Million Forecast, by Production Analysis 2020 & 2033
- Table 38: Global Berry Industry Revenue Million Forecast, by Consumption Analysis 2020 & 2033
- Table 39: Global Berry Industry Revenue Million Forecast, by Import Market Analysis (Value & Volume) 2020 & 2033
- Table 40: Global Berry Industry Revenue Million Forecast, by Export Market Analysis (Value & Volume) 2020 & 2033
- Table 41: Global Berry Industry Revenue Million Forecast, by Price Trend Analysis 2020 & 2033
- Table 42: Global Berry Industry Revenue Million Forecast, by Country 2020 & 2033
- Table 43: Brazil Berry Industry Revenue (Million) Forecast, by Application 2020 & 2033
- Table 44: Argentina Berry Industry Revenue (Million) Forecast, by Application 2020 & 2033
- Table 45: Global Berry Industry Revenue Million Forecast, by Production Analysis 2020 & 2033
- Table 46: Global Berry Industry Revenue Million Forecast, by Consumption Analysis 2020 & 2033
- Table 47: Global Berry Industry Revenue Million Forecast, by Import Market Analysis (Value & Volume) 2020 & 2033
- Table 48: Global Berry Industry Revenue Million Forecast, by Export Market Analysis (Value & Volume) 2020 & 2033
- Table 49: Global Berry Industry Revenue Million Forecast, by Price Trend Analysis 2020 & 2033
- Table 50: Global Berry Industry Revenue Million Forecast, by Country 2020 & 2033
- Table 51: South Africa Berry Industry Revenue (Million) Forecast, by Application 2020 & 2033
- Table 52: Egypt Berry Industry Revenue (Million) Forecast, by Application 2020 & 2033
Frequently Asked Questions
1. What is the projected Compound Annual Growth Rate (CAGR) of the Berry Industry?
The projected CAGR is approximately 3.70%.
2. Which companies are prominent players in the Berry Industry?
Key companies in the market include Driscoll's , Naturipe Farms , Hortifrut, Red Moon Farms , Driscoll's of Monterey.
3. What are the main segments of the Berry Industry?
The market segments include Production Analysis, Consumption Analysis, Import Market Analysis (Value & Volume), Export Market Analysis (Value & Volume), Price Trend Analysis.
4. Can you provide details about the market size?
The market size is estimated to be USD 26.56 Million as of 2022.
5. What are some drivers contributing to market growth?
Increasing Berry Consumption for Health Benefits; Increasing Adoption of High-Technology Farm Practices; Growing Usage of Berries in the Food and Beverage Industries.
6. What are the notable trends driving market growth?
Increasing Export of Berries from United States is Driving the Market.
7. Are there any restraints impacting market growth?
High Production Cost Involved in Berry Production; Increasing Disease and Pest Infestations.
8. Can you provide examples of recent developments in the market?
October 2023: Naturipe Farms has launched the “Sweet Selections” premium berries line. The Sweet Selections line featured Naturipe’s proprietary berry varieties that were meticulously bred and selected for high flavor and overall eating experience.
9. What pricing options are available for accessing the report?
Pricing options include single-user, multi-user, and enterprise licenses priced at USD 4750, USD 5250, and USD 8750 respectively.
10. Is the market size provided in terms of value or volume?
The market size is provided in terms of value, measured in Million.
11. Are there any specific market keywords associated with the report?
Yes, the market keyword associated with the report is "Berry Industry," which aids in identifying and referencing the specific market segment covered.
12. How do I determine which pricing option suits my needs best?
The pricing options vary based on user requirements and access needs. Individual users may opt for single-user licenses, while businesses requiring broader access may choose multi-user or enterprise licenses for cost-effective access to the report.
13. Are there any additional resources or data provided in the Berry Industry report?
While the report offers comprehensive insights, it's advisable to review the specific contents or supplementary materials provided to ascertain if additional resources or data are available.
14. How can I stay updated on further developments or reports in the Berry Industry?
To stay informed about further developments, trends, and reports in the Berry Industry, consider subscribing to industry newsletters, following relevant companies and organizations, or regularly checking reputable industry news sources and publications.
Methodology
Step 1 - Identification of Relevant Samples Size from Population Database


Step 2 - Approaches for Defining Global Market Size (Value, Volume* & Price*)

Note*: In applicable scenarios
Step 3 - Data Sources
Primary Research
- Web Analytics
- Survey Reports
- Research Institute
- Latest Research Reports
- Opinion Leaders
Secondary Research
- Annual Reports
- White Paper
- Latest Press Release
- Industry Association
- Paid Database
- Investor Presentations

Step 4 - Data Triangulation
Involves using different sources of information in order to increase the validity of a study
These sources are likely to be stakeholders in a program - participants, other researchers, program staff, other community members, and so on.
Then we put all data in single framework & apply various statistical tools to find out the dynamic on the market.
During the analysis stage, feedback from the stakeholder groups would be compared to determine areas of agreement as well as areas of divergence