

Key Insights
The bio-adhesives market is experiencing robust growth, driven by the increasing demand for sustainable and eco-friendly alternatives to traditional synthetic adhesives. The market's Compound Annual Growth Rate (CAGR) exceeding 5% indicates a significant upward trajectory projected through 2033. Key drivers include the rising awareness of environmental concerns, stringent regulations on volatile organic compounds (VOCs) in conventional adhesives, and the expanding applications across diverse end-user industries. The building and construction sector, along with paper and board packaging, represent significant market segments, fueled by the growing construction activity globally and the increasing demand for sustainable packaging solutions. Furthermore, the healthcare and personal care sectors are contributing to market expansion, driven by the need for biocompatible and biodegradable adhesives in medical devices and personal care products. Raw materials like rosin, starch, and lignin are predominantly utilized in bio-adhesive manufacturing, reflecting the market's commitment to renewable resources. Leading companies such as Henkel, Arkema, 3M, and others are actively investing in research and development to enhance the performance and expand the applications of bio-adhesives, fostering innovation within the market.
Despite the positive growth outlook, certain restraints hinder market expansion. These include the relatively higher cost of bio-adhesives compared to their synthetic counterparts, limitations in performance characteristics in specific applications (e.g., high-temperature resistance), and the need for further technological advancements to broaden their applicability. However, ongoing research efforts focused on improving the performance and cost-effectiveness of bio-adhesives are expected to mitigate these challenges. The Asia-Pacific region, particularly China and India, is projected to witness substantial growth due to rapid industrialization and urbanization. North America and Europe also represent significant market shares, driven by strong environmental regulations and consumer demand for sustainable products. The market segmentation by raw materials and end-user industries offers valuable insights into specific growth opportunities and market dynamics within the bio-adhesives sector, providing a nuanced understanding of the various factors influencing its expansion.
Unlock the Potential of the Bio Adhesives Market: A Comprehensive Report (2019-2033)
This in-depth report provides a comprehensive analysis of the global Bio Adhesives Market, offering invaluable insights for industry stakeholders, investors, and strategic decision-makers. Covering the period 2019-2033, with a base year of 2025, this study meticulously examines market dynamics, growth drivers, key players, and emerging opportunities within this rapidly evolving sector. The market is projected to reach xx Million by 2033, exhibiting a CAGR of xx% during the forecast period (2025-2033).
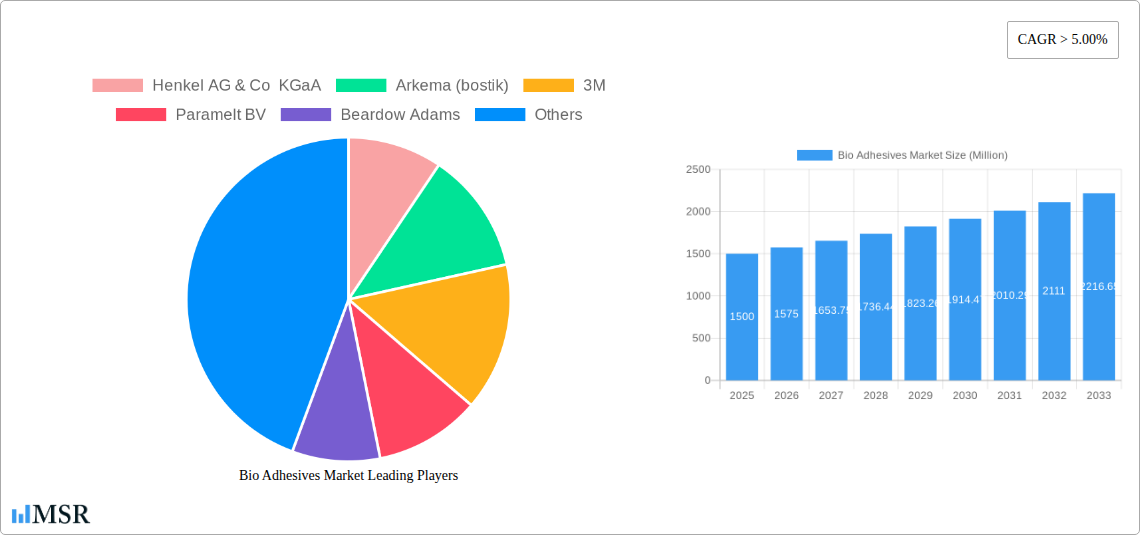
Bio Adhesives Market Market Concentration & Dynamics
The Bio Adhesives Market demonstrates a moderately concentrated landscape, with key players like Henkel AG & Co KGaA, Arkema (Bostik), 3M, and Dow holding significant market share. However, the market also features numerous smaller, specialized players, fostering a dynamic competitive environment. Innovation within the bio-adhesive sector is driven by the increasing demand for sustainable and eco-friendly alternatives to traditional synthetic adhesives. Regulatory frameworks, particularly those focused on environmental impact and material safety, significantly influence market trends. Substitute products, such as traditional synthetic adhesives, pose ongoing competitive pressure, necessitating continuous innovation in bio-adhesive technology. End-user trends towards sustainability and increased demand from sectors like building & construction and packaging are key market growth drivers. Mergers and acquisitions (M&A) activity has been moderate in recent years, with approximately xx M&A deals recorded between 2019 and 2024. This activity is expected to increase in the forecast period driven by the desire to expand product portfolios and market reach.
- Market Share: Top 5 players hold approximately xx% of the global market share (2024).
- M&A Activity: Average of xx deals per year between 2019 and 2024.
- Key Innovation Areas: Bio-based monomers, improved performance characteristics, and reduced environmental impact.
Bio Adhesives Market Industry Insights & Trends
The global bio adhesives market is experiencing robust growth, driven by increasing environmental concerns and the stringent regulations governing the use of synthetic adhesives. The market size was valued at xx Million in 2024 and is projected to reach xx Million by 2033. This significant growth is attributed to several factors, including the rising adoption of sustainable practices across various industries, increasing demand for eco-friendly products, and technological advancements leading to improved bio-adhesive performance. The shift towards sustainable packaging and construction materials is a major catalyst, driving demand for bio-based adhesives in these sectors. Furthermore, evolving consumer preferences for environmentally friendly products are influencing purchasing decisions. The market also witnesses technological disruptions with the development of new bio-based raw materials and enhanced adhesive formulations. These advancements enhance the performance and versatility of bio-adhesives, making them more competitive against traditional alternatives.

Key Markets & Segments Leading Bio Adhesives Market
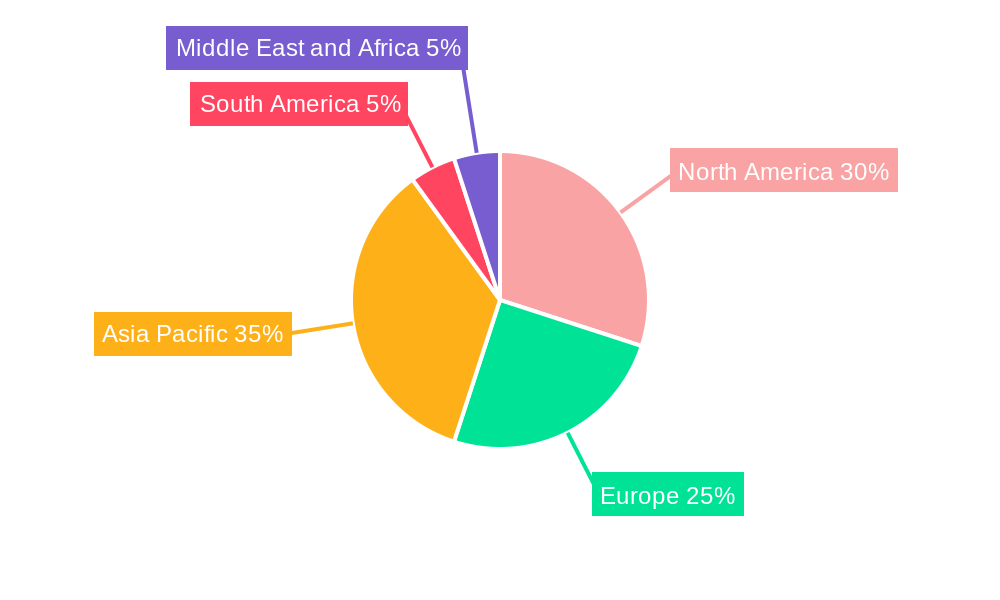
The Building and Construction sector represents the largest end-user segment for bio adhesives, driven by the increasing demand for sustainable and eco-friendly building materials. Geographically, North America and Europe are currently leading the market, fueled by stringent environmental regulations and a high awareness of sustainable construction practices. However, Asia-Pacific is projected to show substantial growth in the coming years due to rapid economic development and increasing infrastructure projects.
- Dominant Region: North America
- Fastest Growing Region: Asia-Pacific
- Largest End-User Segment: Building and Construction
- Key Drivers for Building & Construction Segment: Increasing demand for sustainable building materials, stringent environmental regulations, and robust infrastructure development.
- Key Drivers for Packaging Segment: Growing demand for eco-friendly packaging, increased consumer awareness of environmental issues, and rising e-commerce.
Raw Material Analysis: Starch and rosin currently dominate the raw material segment due to their cost-effectiveness and readily available supply. However, lignin and soy-based raw materials are gaining traction due to their sustainability benefits and improved performance characteristics.
Bio Adhesives Market Product Developments
Recent advancements focus on enhancing the performance characteristics of bio-adhesives, including increasing their strength, durability, and water resistance. Innovations in bio-based monomers and polymer technology are improving the overall efficacy of these products, making them increasingly competitive with traditional synthetic adhesives. This includes the development of novel bio-based formulations tailored for specific applications, further extending their market relevance and application diversity. This is driven by the demand for high-performance, sustainable alternatives in diverse sectors.
Challenges in the Bio Adhesives Market Market
The Bio Adhesives Market faces several challenges, including the higher cost of bio-based raw materials compared to synthetic alternatives. Supply chain disruptions can impact the availability and pricing of key raw materials. Furthermore, competitive pressure from established synthetic adhesive manufacturers remains significant. Meeting the performance requirements of certain high-performance applications remains a technical hurdle for some bio-adhesive formulations. Regulatory hurdles and varying standards across different regions can also add complexity to market expansion. These factors collectively impact market growth and necessitate continuous innovation and optimization within the industry.
Forces Driving Bio Adhesives Market Growth
Several factors drive the growth of the bio adhesives market. The increasing demand for sustainable and eco-friendly products is a primary driver, fueled by growing environmental awareness among consumers and stricter environmental regulations. Technological advancements leading to improved performance and cost-effectiveness of bio-adhesives further enhance their market appeal. Government initiatives promoting sustainable practices and investments in green technologies are also propelling market growth. For example, the EU’s focus on sustainable construction is creating increased demand for bio-based adhesives in the building sector.
Challenges in the Bio Adhesives Market Market
Long-term growth will be driven by continuous innovation in bio-based raw material development and adhesive formulations. Strategic partnerships between bio-adhesive manufacturers and end-users will facilitate the adoption of these products in diverse applications. Expanding into new geographical markets and exploring niche applications, such as medical and pharmaceutical adhesives, present significant growth opportunities.
Emerging Opportunities in Bio Adhesives Market
Emerging opportunities exist in the development of bio-adhesives for specialized applications, including biomedical devices, advanced packaging, and high-performance composites. The exploration of novel bio-based raw materials with enhanced properties presents significant potential for innovation. Growing demand for sustainable solutions in various sectors such as textiles, electronics and automotive will further drive market growth and offer new application opportunities.
Leading Players in the Bio Adhesives Market Sector
- Henkel AG & Co KGaA
- Arkema (Bostik)
- 3M
- Paramelt BV
- Beardow Adams
- Dow
- H B Fuller Company
- Ingredion Incorporated
- Sika AG
- Solenis
- Artimelt AG
- Emsland Group
Key Milestones in Bio Adhesives Market Industry
- 2020: Launch of a new soy-based adhesive by Company X, significantly increasing market share in the packaging segment.
- 2022: Acquisition of Company Y by Company Z, resulting in a broader product portfolio and expanded market reach.
- 2024: Introduction of a novel lignin-based adhesive with superior water resistance, leading to increased adoption in the construction sector. (Specific dates and companies would be included in the full report.)
Strategic Outlook for Bio Adhesives Market Market
The future of the Bio Adhesives Market is bright, driven by a confluence of factors including growing environmental awareness, technological advancements, and increasing demand for sustainable alternatives. Strategic investments in research and development, focusing on bio-based raw materials and enhanced adhesive formulations, will be crucial for long-term success. Companies focusing on sustainable practices and building strong partnerships across the value chain are well-positioned to capitalize on the substantial growth opportunities within this dynamic market. Expansion into new geographical regions and diversification into specialized applications will further enhance market potential.
Bio Adhesives Market Segmentation
-
1. Raw Materials
- 1.1. Rosin
- 1.2. Starch
- 1.3. Lignin
- 1.4. Soy
- 1.5. Other Raw Materials
-
2. End-user Industry
- 2.1. Building and Construction
- 2.2. Paper and Board Packaging
- 2.3. Healthcare
- 2.4. Personal Care
- 2.5. Woodworking and Joinery
- 2.6. Other End-user Industries
Bio Adhesives Market Segmentation By Geography
-
1. Asia Pacific
- 1.1. China
- 1.2. India
- 1.3. Japan
- 1.4. South Korea
- 1.5. Rest of Asia Pacific
-
2. North America
- 2.1. United States
- 2.2. Canada
- 2.3. Mexico
-
3. Europe
- 3.1. Germany
- 3.2. United Kingdom
- 3.3. France
- 3.4. Italy
- 3.5. Rest of Europe
-
4. South America
- 4.1. Brazil
- 4.2. Argentina
- 4.3. Rest of South America
-
5. Middle East and Africa
- 5.1. Saudi Arabia
- 5.2. South Africa
- 5.3. Rest of Middle East and Africa
Bio Adhesives Market REPORT HIGHLIGHTS
| Aspects | Details |
|---|---|
| Study Period | 2019-2033 |
| Base Year | 2024 |
| Estimated Year | 2025 |
| Forecast Period | 2025-2033 |
| Historical Period | 2019-2024 |
| Growth Rate | CAGR of > 5.00% from 2019-2033 |
| Segmentation |
|
Table of Contents
- 1. Introduction
- 1.1. Research Scope
- 1.2. Market Segmentation
- 1.3. Research Methodology
- 1.4. Definitions and Assumptions
- 2. Executive Summary
- 2.1. Introduction
- 3. Market Dynamics
- 3.1. Introduction
- 3.2. Market Drivers
- 3.2.1. Increasing Demand from Packaging Sector; Stringent Regulations for Conventional Adhesives in the United States; Other Drivers
- 3.3. Market Restrains
- 3.3.1. Low Shelf Life and Performance in Comparison to Petroleum-based Adhesives; Other Restraints
- 3.4. Market Trends
- 3.4.1. The Packaging Industry is Expected to Dominate the Market
- 4. Market Factor Analysis
- 4.1. Porters Five Forces
- 4.2. Supply/Value Chain
- 4.3. PESTEL analysis
- 4.4. Market Entropy
- 4.5. Patent/Trademark Analysis
- 5. Global Bio Adhesives Market Analysis, Insights and Forecast, 2019-2031
- 5.1. Market Analysis, Insights and Forecast - by Raw Materials
- 5.1.1. Rosin
- 5.1.2. Starch
- 5.1.3. Lignin
- 5.1.4. Soy
- 5.1.5. Other Raw Materials
- 5.2. Market Analysis, Insights and Forecast - by End-user Industry
- 5.2.1. Building and Construction
- 5.2.2. Paper and Board Packaging
- 5.2.3. Healthcare
- 5.2.4. Personal Care
- 5.2.5. Woodworking and Joinery
- 5.2.6. Other End-user Industries
- 5.3. Market Analysis, Insights and Forecast - by Region
- 5.3.1. Asia Pacific
- 5.3.2. North America
- 5.3.3. Europe
- 5.3.4. South America
- 5.3.5. Middle East and Africa
- 5.1. Market Analysis, Insights and Forecast - by Raw Materials
- 6. Asia Pacific Bio Adhesives Market Analysis, Insights and Forecast, 2019-2031
- 6.1. Market Analysis, Insights and Forecast - by Raw Materials
- 6.1.1. Rosin
- 6.1.2. Starch
- 6.1.3. Lignin
- 6.1.4. Soy
- 6.1.5. Other Raw Materials
- 6.2. Market Analysis, Insights and Forecast - by End-user Industry
- 6.2.1. Building and Construction
- 6.2.2. Paper and Board Packaging
- 6.2.3. Healthcare
- 6.2.4. Personal Care
- 6.2.5. Woodworking and Joinery
- 6.2.6. Other End-user Industries
- 6.1. Market Analysis, Insights and Forecast - by Raw Materials
- 7. North America Bio Adhesives Market Analysis, Insights and Forecast, 2019-2031
- 7.1. Market Analysis, Insights and Forecast - by Raw Materials
- 7.1.1. Rosin
- 7.1.2. Starch
- 7.1.3. Lignin
- 7.1.4. Soy
- 7.1.5. Other Raw Materials
- 7.2. Market Analysis, Insights and Forecast - by End-user Industry
- 7.2.1. Building and Construction
- 7.2.2. Paper and Board Packaging
- 7.2.3. Healthcare
- 7.2.4. Personal Care
- 7.2.5. Woodworking and Joinery
- 7.2.6. Other End-user Industries
- 7.1. Market Analysis, Insights and Forecast - by Raw Materials
- 8. Europe Bio Adhesives Market Analysis, Insights and Forecast, 2019-2031
- 8.1. Market Analysis, Insights and Forecast - by Raw Materials
- 8.1.1. Rosin
- 8.1.2. Starch
- 8.1.3. Lignin
- 8.1.4. Soy
- 8.1.5. Other Raw Materials
- 8.2. Market Analysis, Insights and Forecast - by End-user Industry
- 8.2.1. Building and Construction
- 8.2.2. Paper and Board Packaging
- 8.2.3. Healthcare
- 8.2.4. Personal Care
- 8.2.5. Woodworking and Joinery
- 8.2.6. Other End-user Industries
- 8.1. Market Analysis, Insights and Forecast - by Raw Materials
- 9. South America Bio Adhesives Market Analysis, Insights and Forecast, 2019-2031
- 9.1. Market Analysis, Insights and Forecast - by Raw Materials
- 9.1.1. Rosin
- 9.1.2. Starch
- 9.1.3. Lignin
- 9.1.4. Soy
- 9.1.5. Other Raw Materials
- 9.2. Market Analysis, Insights and Forecast - by End-user Industry
- 9.2.1. Building and Construction
- 9.2.2. Paper and Board Packaging
- 9.2.3. Healthcare
- 9.2.4. Personal Care
- 9.2.5. Woodworking and Joinery
- 9.2.6. Other End-user Industries
- 9.1. Market Analysis, Insights and Forecast - by Raw Materials
- 10. Middle East and Africa Bio Adhesives Market Analysis, Insights and Forecast, 2019-2031
- 10.1. Market Analysis, Insights and Forecast - by Raw Materials
- 10.1.1. Rosin
- 10.1.2. Starch
- 10.1.3. Lignin
- 10.1.4. Soy
- 10.1.5. Other Raw Materials
- 10.2. Market Analysis, Insights and Forecast - by End-user Industry
- 10.2.1. Building and Construction
- 10.2.2. Paper and Board Packaging
- 10.2.3. Healthcare
- 10.2.4. Personal Care
- 10.2.5. Woodworking and Joinery
- 10.2.6. Other End-user Industries
- 10.1. Market Analysis, Insights and Forecast - by Raw Materials
- 11. Asia Pacific Bio Adhesives Market Analysis, Insights and Forecast, 2019-2031
- 11.1. Market Analysis, Insights and Forecast - By Country/Sub-region
- 11.1.1 China
- 11.1.2 India
- 11.1.3 Japan
- 11.1.4 South Korea
- 11.1.5 Rest of Asia Pacific
- 12. North America Bio Adhesives Market Analysis, Insights and Forecast, 2019-2031
- 12.1. Market Analysis, Insights and Forecast - By Country/Sub-region
- 12.1.1 United States
- 12.1.2 Canada
- 12.1.3 Mexico
- 13. Europe Bio Adhesives Market Analysis, Insights and Forecast, 2019-2031
- 13.1. Market Analysis, Insights and Forecast - By Country/Sub-region
- 13.1.1 Germany
- 13.1.2 United Kingdom
- 13.1.3 France
- 13.1.4 Italy
- 13.1.5 Rest of Europe
- 14. South America Bio Adhesives Market Analysis, Insights and Forecast, 2019-2031
- 14.1. Market Analysis, Insights and Forecast - By Country/Sub-region
- 14.1.1 Brazil
- 14.1.2 Argentina
- 14.1.3 Rest of South America
- 15. Middle East and Africa Bio Adhesives Market Analysis, Insights and Forecast, 2019-2031
- 15.1. Market Analysis, Insights and Forecast - By Country/Sub-region
- 15.1.1 Saudi Arabia
- 15.1.2 South Africa
- 15.1.3 Rest of Middle East and Africa
- 16. Competitive Analysis
- 16.1. Global Market Share Analysis 2024
- 16.2. Company Profiles
- 16.2.1 Henkel AG & Co KGaA
- 16.2.1.1. Overview
- 16.2.1.2. Products
- 16.2.1.3. SWOT Analysis
- 16.2.1.4. Recent Developments
- 16.2.1.5. Financials (Based on Availability)
- 16.2.2 Arkema (bostik)
- 16.2.2.1. Overview
- 16.2.2.2. Products
- 16.2.2.3. SWOT Analysis
- 16.2.2.4. Recent Developments
- 16.2.2.5. Financials (Based on Availability)
- 16.2.3 3M
- 16.2.3.1. Overview
- 16.2.3.2. Products
- 16.2.3.3. SWOT Analysis
- 16.2.3.4. Recent Developments
- 16.2.3.5. Financials (Based on Availability)
- 16.2.4 Paramelt BV
- 16.2.4.1. Overview
- 16.2.4.2. Products
- 16.2.4.3. SWOT Analysis
- 16.2.4.4. Recent Developments
- 16.2.4.5. Financials (Based on Availability)
- 16.2.5 Beardow Adams
- 16.2.5.1. Overview
- 16.2.5.2. Products
- 16.2.5.3. SWOT Analysis
- 16.2.5.4. Recent Developments
- 16.2.5.5. Financials (Based on Availability)
- 16.2.6 Dow
- 16.2.6.1. Overview
- 16.2.6.2. Products
- 16.2.6.3. SWOT Analysis
- 16.2.6.4. Recent Developments
- 16.2.6.5. Financials (Based on Availability)
- 16.2.7 H B Fuller Company
- 16.2.7.1. Overview
- 16.2.7.2. Products
- 16.2.7.3. SWOT Analysis
- 16.2.7.4. Recent Developments
- 16.2.7.5. Financials (Based on Availability)
- 16.2.8 Ingredion Incorporated
- 16.2.8.1. Overview
- 16.2.8.2. Products
- 16.2.8.3. SWOT Analysis
- 16.2.8.4. Recent Developments
- 16.2.8.5. Financials (Based on Availability)
- 16.2.9 Sika AG
- 16.2.9.1. Overview
- 16.2.9.2. Products
- 16.2.9.3. SWOT Analysis
- 16.2.9.4. Recent Developments
- 16.2.9.5. Financials (Based on Availability)
- 16.2.10 Solenis*List Not Exhaustive
- 16.2.10.1. Overview
- 16.2.10.2. Products
- 16.2.10.3. SWOT Analysis
- 16.2.10.4. Recent Developments
- 16.2.10.5. Financials (Based on Availability)
- 16.2.11 Artimelt AG
- 16.2.11.1. Overview
- 16.2.11.2. Products
- 16.2.11.3. SWOT Analysis
- 16.2.11.4. Recent Developments
- 16.2.11.5. Financials (Based on Availability)
- 16.2.12 Emsland Group
- 16.2.12.1. Overview
- 16.2.12.2. Products
- 16.2.12.3. SWOT Analysis
- 16.2.12.4. Recent Developments
- 16.2.12.5. Financials (Based on Availability)
- 16.2.1 Henkel AG & Co KGaA
List of Figures
- Figure 1: Global Bio Adhesives Market Revenue Breakdown (Million, %) by Region 2024 & 2032
- Figure 2: Global Bio Adhesives Market Volume Breakdown (Million, %) by Region 2024 & 2032
- Figure 3: Asia Pacific Bio Adhesives Market Revenue (Million), by Country 2024 & 2032
- Figure 4: Asia Pacific Bio Adhesives Market Volume (Million), by Country 2024 & 2032
- Figure 5: Asia Pacific Bio Adhesives Market Revenue Share (%), by Country 2024 & 2032
- Figure 6: Asia Pacific Bio Adhesives Market Volume Share (%), by Country 2024 & 2032
- Figure 7: North America Bio Adhesives Market Revenue (Million), by Country 2024 & 2032
- Figure 8: North America Bio Adhesives Market Volume (Million), by Country 2024 & 2032
- Figure 9: North America Bio Adhesives Market Revenue Share (%), by Country 2024 & 2032
- Figure 10: North America Bio Adhesives Market Volume Share (%), by Country 2024 & 2032
- Figure 11: Europe Bio Adhesives Market Revenue (Million), by Country 2024 & 2032
- Figure 12: Europe Bio Adhesives Market Volume (Million), by Country 2024 & 2032
- Figure 13: Europe Bio Adhesives Market Revenue Share (%), by Country 2024 & 2032
- Figure 14: Europe Bio Adhesives Market Volume Share (%), by Country 2024 & 2032
- Figure 15: South America Bio Adhesives Market Revenue (Million), by Country 2024 & 2032
- Figure 16: South America Bio Adhesives Market Volume (Million), by Country 2024 & 2032
- Figure 17: South America Bio Adhesives Market Revenue Share (%), by Country 2024 & 2032
- Figure 18: South America Bio Adhesives Market Volume Share (%), by Country 2024 & 2032
- Figure 19: Middle East and Africa Bio Adhesives Market Revenue (Million), by Country 2024 & 2032
- Figure 20: Middle East and Africa Bio Adhesives Market Volume (Million), by Country 2024 & 2032
- Figure 21: Middle East and Africa Bio Adhesives Market Revenue Share (%), by Country 2024 & 2032
- Figure 22: Middle East and Africa Bio Adhesives Market Volume Share (%), by Country 2024 & 2032
- Figure 23: Asia Pacific Bio Adhesives Market Revenue (Million), by Raw Materials 2024 & 2032
- Figure 24: Asia Pacific Bio Adhesives Market Volume (Million), by Raw Materials 2024 & 2032
- Figure 25: Asia Pacific Bio Adhesives Market Revenue Share (%), by Raw Materials 2024 & 2032
- Figure 26: Asia Pacific Bio Adhesives Market Volume Share (%), by Raw Materials 2024 & 2032
- Figure 27: Asia Pacific Bio Adhesives Market Revenue (Million), by End-user Industry 2024 & 2032
- Figure 28: Asia Pacific Bio Adhesives Market Volume (Million), by End-user Industry 2024 & 2032
- Figure 29: Asia Pacific Bio Adhesives Market Revenue Share (%), by End-user Industry 2024 & 2032
- Figure 30: Asia Pacific Bio Adhesives Market Volume Share (%), by End-user Industry 2024 & 2032
- Figure 31: Asia Pacific Bio Adhesives Market Revenue (Million), by Country 2024 & 2032
- Figure 32: Asia Pacific Bio Adhesives Market Volume (Million), by Country 2024 & 2032
- Figure 33: Asia Pacific Bio Adhesives Market Revenue Share (%), by Country 2024 & 2032
- Figure 34: Asia Pacific Bio Adhesives Market Volume Share (%), by Country 2024 & 2032
- Figure 35: North America Bio Adhesives Market Revenue (Million), by Raw Materials 2024 & 2032
- Figure 36: North America Bio Adhesives Market Volume (Million), by Raw Materials 2024 & 2032
- Figure 37: North America Bio Adhesives Market Revenue Share (%), by Raw Materials 2024 & 2032
- Figure 38: North America Bio Adhesives Market Volume Share (%), by Raw Materials 2024 & 2032
- Figure 39: North America Bio Adhesives Market Revenue (Million), by End-user Industry 2024 & 2032
- Figure 40: North America Bio Adhesives Market Volume (Million), by End-user Industry 2024 & 2032
- Figure 41: North America Bio Adhesives Market Revenue Share (%), by End-user Industry 2024 & 2032
- Figure 42: North America Bio Adhesives Market Volume Share (%), by End-user Industry 2024 & 2032
- Figure 43: North America Bio Adhesives Market Revenue (Million), by Country 2024 & 2032
- Figure 44: North America Bio Adhesives Market Volume (Million), by Country 2024 & 2032
- Figure 45: North America Bio Adhesives Market Revenue Share (%), by Country 2024 & 2032
- Figure 46: North America Bio Adhesives Market Volume Share (%), by Country 2024 & 2032
- Figure 47: Europe Bio Adhesives Market Revenue (Million), by Raw Materials 2024 & 2032
- Figure 48: Europe Bio Adhesives Market Volume (Million), by Raw Materials 2024 & 2032
- Figure 49: Europe Bio Adhesives Market Revenue Share (%), by Raw Materials 2024 & 2032
- Figure 50: Europe Bio Adhesives Market Volume Share (%), by Raw Materials 2024 & 2032
- Figure 51: Europe Bio Adhesives Market Revenue (Million), by End-user Industry 2024 & 2032
- Figure 52: Europe Bio Adhesives Market Volume (Million), by End-user Industry 2024 & 2032
- Figure 53: Europe Bio Adhesives Market Revenue Share (%), by End-user Industry 2024 & 2032
- Figure 54: Europe Bio Adhesives Market Volume Share (%), by End-user Industry 2024 & 2032
- Figure 55: Europe Bio Adhesives Market Revenue (Million), by Country 2024 & 2032
- Figure 56: Europe Bio Adhesives Market Volume (Million), by Country 2024 & 2032
- Figure 57: Europe Bio Adhesives Market Revenue Share (%), by Country 2024 & 2032
- Figure 58: Europe Bio Adhesives Market Volume Share (%), by Country 2024 & 2032
- Figure 59: South America Bio Adhesives Market Revenue (Million), by Raw Materials 2024 & 2032
- Figure 60: South America Bio Adhesives Market Volume (Million), by Raw Materials 2024 & 2032
- Figure 61: South America Bio Adhesives Market Revenue Share (%), by Raw Materials 2024 & 2032
- Figure 62: South America Bio Adhesives Market Volume Share (%), by Raw Materials 2024 & 2032
- Figure 63: South America Bio Adhesives Market Revenue (Million), by End-user Industry 2024 & 2032
- Figure 64: South America Bio Adhesives Market Volume (Million), by End-user Industry 2024 & 2032
- Figure 65: South America Bio Adhesives Market Revenue Share (%), by End-user Industry 2024 & 2032
- Figure 66: South America Bio Adhesives Market Volume Share (%), by End-user Industry 2024 & 2032
- Figure 67: South America Bio Adhesives Market Revenue (Million), by Country 2024 & 2032
- Figure 68: South America Bio Adhesives Market Volume (Million), by Country 2024 & 2032
- Figure 69: South America Bio Adhesives Market Revenue Share (%), by Country 2024 & 2032
- Figure 70: South America Bio Adhesives Market Volume Share (%), by Country 2024 & 2032
- Figure 71: Middle East and Africa Bio Adhesives Market Revenue (Million), by Raw Materials 2024 & 2032
- Figure 72: Middle East and Africa Bio Adhesives Market Volume (Million), by Raw Materials 2024 & 2032
- Figure 73: Middle East and Africa Bio Adhesives Market Revenue Share (%), by Raw Materials 2024 & 2032
- Figure 74: Middle East and Africa Bio Adhesives Market Volume Share (%), by Raw Materials 2024 & 2032
- Figure 75: Middle East and Africa Bio Adhesives Market Revenue (Million), by End-user Industry 2024 & 2032
- Figure 76: Middle East and Africa Bio Adhesives Market Volume (Million), by End-user Industry 2024 & 2032
- Figure 77: Middle East and Africa Bio Adhesives Market Revenue Share (%), by End-user Industry 2024 & 2032
- Figure 78: Middle East and Africa Bio Adhesives Market Volume Share (%), by End-user Industry 2024 & 2032
- Figure 79: Middle East and Africa Bio Adhesives Market Revenue (Million), by Country 2024 & 2032
- Figure 80: Middle East and Africa Bio Adhesives Market Volume (Million), by Country 2024 & 2032
- Figure 81: Middle East and Africa Bio Adhesives Market Revenue Share (%), by Country 2024 & 2032
- Figure 82: Middle East and Africa Bio Adhesives Market Volume Share (%), by Country 2024 & 2032
List of Tables
- Table 1: Global Bio Adhesives Market Revenue Million Forecast, by Region 2019 & 2032
- Table 2: Global Bio Adhesives Market Volume Million Forecast, by Region 2019 & 2032
- Table 3: Global Bio Adhesives Market Revenue Million Forecast, by Raw Materials 2019 & 2032
- Table 4: Global Bio Adhesives Market Volume Million Forecast, by Raw Materials 2019 & 2032
- Table 5: Global Bio Adhesives Market Revenue Million Forecast, by End-user Industry 2019 & 2032
- Table 6: Global Bio Adhesives Market Volume Million Forecast, by End-user Industry 2019 & 2032
- Table 7: Global Bio Adhesives Market Revenue Million Forecast, by Region 2019 & 2032
- Table 8: Global Bio Adhesives Market Volume Million Forecast, by Region 2019 & 2032
- Table 9: Global Bio Adhesives Market Revenue Million Forecast, by Country 2019 & 2032
- Table 10: Global Bio Adhesives Market Volume Million Forecast, by Country 2019 & 2032
- Table 11: China Bio Adhesives Market Revenue (Million) Forecast, by Application 2019 & 2032
- Table 12: China Bio Adhesives Market Volume (Million) Forecast, by Application 2019 & 2032
- Table 13: India Bio Adhesives Market Revenue (Million) Forecast, by Application 2019 & 2032
- Table 14: India Bio Adhesives Market Volume (Million) Forecast, by Application 2019 & 2032
- Table 15: Japan Bio Adhesives Market Revenue (Million) Forecast, by Application 2019 & 2032
- Table 16: Japan Bio Adhesives Market Volume (Million) Forecast, by Application 2019 & 2032
- Table 17: South Korea Bio Adhesives Market Revenue (Million) Forecast, by Application 2019 & 2032
- Table 18: South Korea Bio Adhesives Market Volume (Million) Forecast, by Application 2019 & 2032
- Table 19: Rest of Asia Pacific Bio Adhesives Market Revenue (Million) Forecast, by Application 2019 & 2032
- Table 20: Rest of Asia Pacific Bio Adhesives Market Volume (Million) Forecast, by Application 2019 & 2032
- Table 21: Global Bio Adhesives Market Revenue Million Forecast, by Country 2019 & 2032
- Table 22: Global Bio Adhesives Market Volume Million Forecast, by Country 2019 & 2032
- Table 23: United States Bio Adhesives Market Revenue (Million) Forecast, by Application 2019 & 2032
- Table 24: United States Bio Adhesives Market Volume (Million) Forecast, by Application 2019 & 2032
- Table 25: Canada Bio Adhesives Market Revenue (Million) Forecast, by Application 2019 & 2032
- Table 26: Canada Bio Adhesives Market Volume (Million) Forecast, by Application 2019 & 2032
- Table 27: Mexico Bio Adhesives Market Revenue (Million) Forecast, by Application 2019 & 2032
- Table 28: Mexico Bio Adhesives Market Volume (Million) Forecast, by Application 2019 & 2032
- Table 29: Global Bio Adhesives Market Revenue Million Forecast, by Country 2019 & 2032
- Table 30: Global Bio Adhesives Market Volume Million Forecast, by Country 2019 & 2032
- Table 31: Germany Bio Adhesives Market Revenue (Million) Forecast, by Application 2019 & 2032
- Table 32: Germany Bio Adhesives Market Volume (Million) Forecast, by Application 2019 & 2032
- Table 33: United Kingdom Bio Adhesives Market Revenue (Million) Forecast, by Application 2019 & 2032
- Table 34: United Kingdom Bio Adhesives Market Volume (Million) Forecast, by Application 2019 & 2032
- Table 35: France Bio Adhesives Market Revenue (Million) Forecast, by Application 2019 & 2032
- Table 36: France Bio Adhesives Market Volume (Million) Forecast, by Application 2019 & 2032
- Table 37: Italy Bio Adhesives Market Revenue (Million) Forecast, by Application 2019 & 2032
- Table 38: Italy Bio Adhesives Market Volume (Million) Forecast, by Application 2019 & 2032
- Table 39: Rest of Europe Bio Adhesives Market Revenue (Million) Forecast, by Application 2019 & 2032
- Table 40: Rest of Europe Bio Adhesives Market Volume (Million) Forecast, by Application 2019 & 2032
- Table 41: Global Bio Adhesives Market Revenue Million Forecast, by Country 2019 & 2032
- Table 42: Global Bio Adhesives Market Volume Million Forecast, by Country 2019 & 2032
- Table 43: Brazil Bio Adhesives Market Revenue (Million) Forecast, by Application 2019 & 2032
- Table 44: Brazil Bio Adhesives Market Volume (Million) Forecast, by Application 2019 & 2032
- Table 45: Argentina Bio Adhesives Market Revenue (Million) Forecast, by Application 2019 & 2032
- Table 46: Argentina Bio Adhesives Market Volume (Million) Forecast, by Application 2019 & 2032
- Table 47: Rest of South America Bio Adhesives Market Revenue (Million) Forecast, by Application 2019 & 2032
- Table 48: Rest of South America Bio Adhesives Market Volume (Million) Forecast, by Application 2019 & 2032
- Table 49: Global Bio Adhesives Market Revenue Million Forecast, by Country 2019 & 2032
- Table 50: Global Bio Adhesives Market Volume Million Forecast, by Country 2019 & 2032
- Table 51: Saudi Arabia Bio Adhesives Market Revenue (Million) Forecast, by Application 2019 & 2032
- Table 52: Saudi Arabia Bio Adhesives Market Volume (Million) Forecast, by Application 2019 & 2032
- Table 53: South Africa Bio Adhesives Market Revenue (Million) Forecast, by Application 2019 & 2032
- Table 54: South Africa Bio Adhesives Market Volume (Million) Forecast, by Application 2019 & 2032
- Table 55: Rest of Middle East and Africa Bio Adhesives Market Revenue (Million) Forecast, by Application 2019 & 2032
- Table 56: Rest of Middle East and Africa Bio Adhesives Market Volume (Million) Forecast, by Application 2019 & 2032
- Table 57: Global Bio Adhesives Market Revenue Million Forecast, by Raw Materials 2019 & 2032
- Table 58: Global Bio Adhesives Market Volume Million Forecast, by Raw Materials 2019 & 2032
- Table 59: Global Bio Adhesives Market Revenue Million Forecast, by End-user Industry 2019 & 2032
- Table 60: Global Bio Adhesives Market Volume Million Forecast, by End-user Industry 2019 & 2032
- Table 61: Global Bio Adhesives Market Revenue Million Forecast, by Country 2019 & 2032
- Table 62: Global Bio Adhesives Market Volume Million Forecast, by Country 2019 & 2032
- Table 63: China Bio Adhesives Market Revenue (Million) Forecast, by Application 2019 & 2032
- Table 64: China Bio Adhesives Market Volume (Million) Forecast, by Application 2019 & 2032
- Table 65: India Bio Adhesives Market Revenue (Million) Forecast, by Application 2019 & 2032
- Table 66: India Bio Adhesives Market Volume (Million) Forecast, by Application 2019 & 2032
- Table 67: Japan Bio Adhesives Market Revenue (Million) Forecast, by Application 2019 & 2032
- Table 68: Japan Bio Adhesives Market Volume (Million) Forecast, by Application 2019 & 2032
- Table 69: South Korea Bio Adhesives Market Revenue (Million) Forecast, by Application 2019 & 2032
- Table 70: South Korea Bio Adhesives Market Volume (Million) Forecast, by Application 2019 & 2032
- Table 71: Rest of Asia Pacific Bio Adhesives Market Revenue (Million) Forecast, by Application 2019 & 2032
- Table 72: Rest of Asia Pacific Bio Adhesives Market Volume (Million) Forecast, by Application 2019 & 2032
- Table 73: Global Bio Adhesives Market Revenue Million Forecast, by Raw Materials 2019 & 2032
- Table 74: Global Bio Adhesives Market Volume Million Forecast, by Raw Materials 2019 & 2032
- Table 75: Global Bio Adhesives Market Revenue Million Forecast, by End-user Industry 2019 & 2032
- Table 76: Global Bio Adhesives Market Volume Million Forecast, by End-user Industry 2019 & 2032
- Table 77: Global Bio Adhesives Market Revenue Million Forecast, by Country 2019 & 2032
- Table 78: Global Bio Adhesives Market Volume Million Forecast, by Country 2019 & 2032
- Table 79: United States Bio Adhesives Market Revenue (Million) Forecast, by Application 2019 & 2032
- Table 80: United States Bio Adhesives Market Volume (Million) Forecast, by Application 2019 & 2032
- Table 81: Canada Bio Adhesives Market Revenue (Million) Forecast, by Application 2019 & 2032
- Table 82: Canada Bio Adhesives Market Volume (Million) Forecast, by Application 2019 & 2032
- Table 83: Mexico Bio Adhesives Market Revenue (Million) Forecast, by Application 2019 & 2032
- Table 84: Mexico Bio Adhesives Market Volume (Million) Forecast, by Application 2019 & 2032
- Table 85: Global Bio Adhesives Market Revenue Million Forecast, by Raw Materials 2019 & 2032
- Table 86: Global Bio Adhesives Market Volume Million Forecast, by Raw Materials 2019 & 2032
- Table 87: Global Bio Adhesives Market Revenue Million Forecast, by End-user Industry 2019 & 2032
- Table 88: Global Bio Adhesives Market Volume Million Forecast, by End-user Industry 2019 & 2032
- Table 89: Global Bio Adhesives Market Revenue Million Forecast, by Country 2019 & 2032
- Table 90: Global Bio Adhesives Market Volume Million Forecast, by Country 2019 & 2032
- Table 91: Germany Bio Adhesives Market Revenue (Million) Forecast, by Application 2019 & 2032
- Table 92: Germany Bio Adhesives Market Volume (Million) Forecast, by Application 2019 & 2032
- Table 93: United Kingdom Bio Adhesives Market Revenue (Million) Forecast, by Application 2019 & 2032
- Table 94: United Kingdom Bio Adhesives Market Volume (Million) Forecast, by Application 2019 & 2032
- Table 95: France Bio Adhesives Market Revenue (Million) Forecast, by Application 2019 & 2032
- Table 96: France Bio Adhesives Market Volume (Million) Forecast, by Application 2019 & 2032
- Table 97: Italy Bio Adhesives Market Revenue (Million) Forecast, by Application 2019 & 2032
- Table 98: Italy Bio Adhesives Market Volume (Million) Forecast, by Application 2019 & 2032
- Table 99: Rest of Europe Bio Adhesives Market Revenue (Million) Forecast, by Application 2019 & 2032
- Table 100: Rest of Europe Bio Adhesives Market Volume (Million) Forecast, by Application 2019 & 2032
- Table 101: Global Bio Adhesives Market Revenue Million Forecast, by Raw Materials 2019 & 2032
- Table 102: Global Bio Adhesives Market Volume Million Forecast, by Raw Materials 2019 & 2032
- Table 103: Global Bio Adhesives Market Revenue Million Forecast, by End-user Industry 2019 & 2032
- Table 104: Global Bio Adhesives Market Volume Million Forecast, by End-user Industry 2019 & 2032
- Table 105: Global Bio Adhesives Market Revenue Million Forecast, by Country 2019 & 2032
- Table 106: Global Bio Adhesives Market Volume Million Forecast, by Country 2019 & 2032
- Table 107: Brazil Bio Adhesives Market Revenue (Million) Forecast, by Application 2019 & 2032
- Table 108: Brazil Bio Adhesives Market Volume (Million) Forecast, by Application 2019 & 2032
- Table 109: Argentina Bio Adhesives Market Revenue (Million) Forecast, by Application 2019 & 2032
- Table 110: Argentina Bio Adhesives Market Volume (Million) Forecast, by Application 2019 & 2032
- Table 111: Rest of South America Bio Adhesives Market Revenue (Million) Forecast, by Application 2019 & 2032
- Table 112: Rest of South America Bio Adhesives Market Volume (Million) Forecast, by Application 2019 & 2032
- Table 113: Global Bio Adhesives Market Revenue Million Forecast, by Raw Materials 2019 & 2032
- Table 114: Global Bio Adhesives Market Volume Million Forecast, by Raw Materials 2019 & 2032
- Table 115: Global Bio Adhesives Market Revenue Million Forecast, by End-user Industry 2019 & 2032
- Table 116: Global Bio Adhesives Market Volume Million Forecast, by End-user Industry 2019 & 2032
- Table 117: Global Bio Adhesives Market Revenue Million Forecast, by Country 2019 & 2032
- Table 118: Global Bio Adhesives Market Volume Million Forecast, by Country 2019 & 2032
- Table 119: Saudi Arabia Bio Adhesives Market Revenue (Million) Forecast, by Application 2019 & 2032
- Table 120: Saudi Arabia Bio Adhesives Market Volume (Million) Forecast, by Application 2019 & 2032
- Table 121: South Africa Bio Adhesives Market Revenue (Million) Forecast, by Application 2019 & 2032
- Table 122: South Africa Bio Adhesives Market Volume (Million) Forecast, by Application 2019 & 2032
- Table 123: Rest of Middle East and Africa Bio Adhesives Market Revenue (Million) Forecast, by Application 2019 & 2032
- Table 124: Rest of Middle East and Africa Bio Adhesives Market Volume (Million) Forecast, by Application 2019 & 2032
Frequently Asked Questions
1. What is the projected Compound Annual Growth Rate (CAGR) of the Bio Adhesives Market?
The projected CAGR is approximately > 5.00%.
2. Which companies are prominent players in the Bio Adhesives Market?
Key companies in the market include Henkel AG & Co KGaA, Arkema (bostik), 3M, Paramelt BV, Beardow Adams, Dow, H B Fuller Company, Ingredion Incorporated, Sika AG, Solenis*List Not Exhaustive, Artimelt AG, Emsland Group.
3. What are the main segments of the Bio Adhesives Market?
The market segments include Raw Materials, End-user Industry.
4. Can you provide details about the market size?
The market size is estimated to be USD XX Million as of 2022.
5. What are some drivers contributing to market growth?
Increasing Demand from Packaging Sector; Stringent Regulations for Conventional Adhesives in the United States; Other Drivers.
6. What are the notable trends driving market growth?
The Packaging Industry is Expected to Dominate the Market.
7. Are there any restraints impacting market growth?
Low Shelf Life and Performance in Comparison to Petroleum-based Adhesives; Other Restraints.
8. Can you provide examples of recent developments in the market?
N/A
9. What pricing options are available for accessing the report?
Pricing options include single-user, multi-user, and enterprise licenses priced at USD 4750, USD 5250, and USD 8750 respectively.
10. Is the market size provided in terms of value or volume?
The market size is provided in terms of value, measured in Million and volume, measured in Million.
11. Are there any specific market keywords associated with the report?
Yes, the market keyword associated with the report is "Bio Adhesives Market," which aids in identifying and referencing the specific market segment covered.
12. How do I determine which pricing option suits my needs best?
The pricing options vary based on user requirements and access needs. Individual users may opt for single-user licenses, while businesses requiring broader access may choose multi-user or enterprise licenses for cost-effective access to the report.
13. Are there any additional resources or data provided in the Bio Adhesives Market report?
While the report offers comprehensive insights, it's advisable to review the specific contents or supplementary materials provided to ascertain if additional resources or data are available.
14. How can I stay updated on further developments or reports in the Bio Adhesives Market?
To stay informed about further developments, trends, and reports in the Bio Adhesives Market, consider subscribing to industry newsletters, following relevant companies and organizations, or regularly checking reputable industry news sources and publications.
Methodology
Step 1 - Identification of Relevant Samples Size from Population Database


Step 2 - Approaches for Defining Global Market Size (Value, Volume* & Price*)

Note*: In applicable scenarios
Step 3 - Data Sources
Primary Research
- Web Analytics
- Survey Reports
- Research Institute
- Latest Research Reports
- Opinion Leaders
Secondary Research
- Annual Reports
- White Paper
- Latest Press Release
- Industry Association
- Paid Database
- Investor Presentations

Step 4 - Data Triangulation
Involves using different sources of information in order to increase the validity of a study
These sources are likely to be stakeholders in a program - participants, other researchers, program staff, other community members, and so on.
Then we put all data in single framework & apply various statistical tools to find out the dynamic on the market.
During the analysis stage, feedback from the stakeholder groups would be compared to determine areas of agreement as well as areas of divergence
