

Key Insights
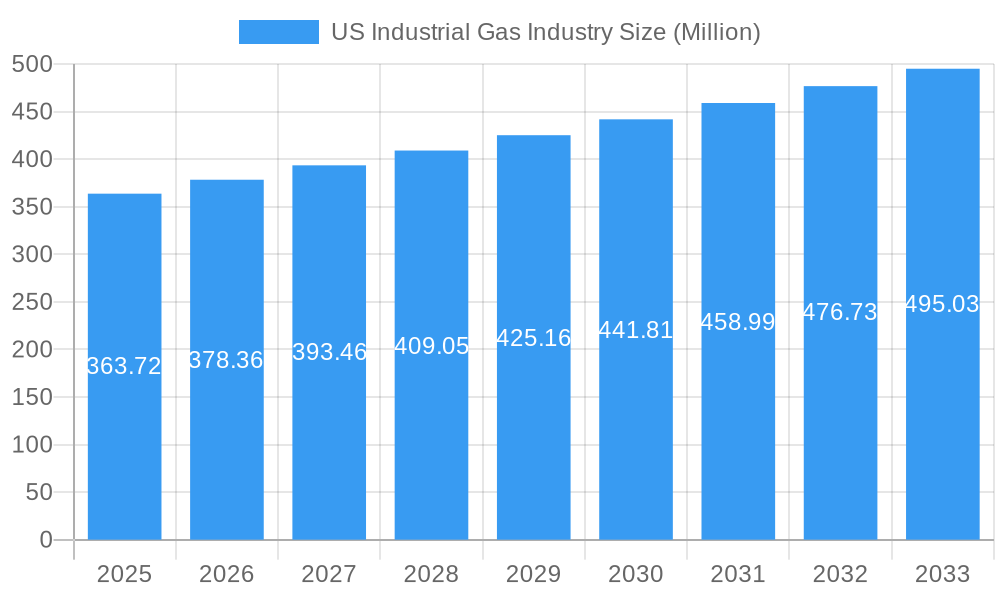
The US industrial gas market, valued at $363.72 million in 2025, is projected to experience steady growth, driven primarily by increasing demand from key end-user industries. The 3.79% CAGR from 2019-2033 indicates a robust expansion, fueled by the burgeoning energy and power sectors, particularly renewable energy initiatives requiring high-purity gases for various processes. The petrochemical and chemical manufacturing sectors also contribute significantly, utilizing gases like nitrogen, oxygen, and hydrogen in production. Growth is further supported by advancements in medical and pharmaceutical applications, where industrial gases play a crucial role in drug manufacturing and medical equipment. While regulatory changes and potential supply chain disruptions could pose challenges, the overall market outlook remains positive, with ongoing technological advancements driving efficiency and cost reductions within the industry.
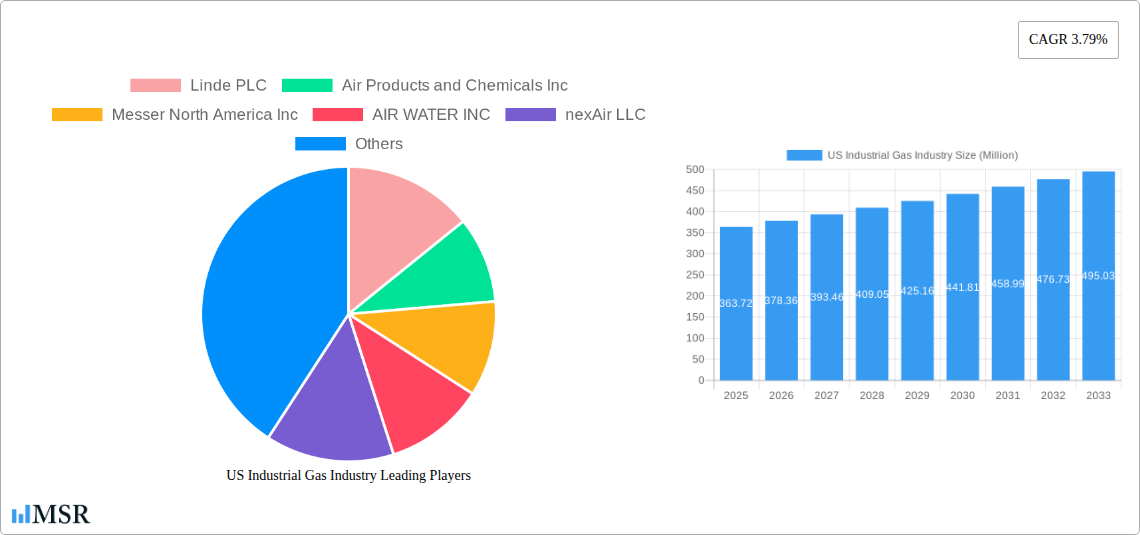
US Industrial Gas Industry Market Size (In Million)
Regional variations exist, with the Northeast, Southeast, Midwest, Southwest, and West regions all contributing to the overall US market. The specific market shares of each region are influenced by factors such as industrial concentration, proximity to production facilities, and government policies. Competitive dynamics are shaped by the presence of major players like Linde PLC, Air Products and Chemicals Inc., and Air Liquide, who are constantly innovating to enhance product offerings and expand market reach. The market's segmentation by product type (nitrogen, oxygen, etc.) and end-user industry reflects the diverse applications of industrial gases, presenting opportunities for specialized players focusing on niche segments. Future growth will likely hinge on the continued expansion of renewable energy infrastructure, the advancement of medical technologies, and the evolving demands of the chemical and manufacturing sectors.
US Industrial Gas Industry Company Market Share
US Industrial Gas Industry Market Report: 2019-2033
This comprehensive report provides a detailed analysis of the US industrial gas market, offering invaluable insights for stakeholders across the value chain. The study period covers 2019-2033, with 2025 serving as the base and estimated year. We analyze market dynamics, key segments, leading players like Linde PLC, Air Products and Chemicals Inc, and Messer North America Inc, and emerging trends, forecasting market growth until 2033. The report is indispensable for strategic decision-making, investment planning, and competitive analysis within this dynamic sector. Market size is predicted to reach xx Million by 2033.
US Industrial Gas Industry Market Concentration & Dynamics
The US industrial gas market is characterized by a moderately concentrated structure, with a few dominant multinational players and a landscape of regional and specialized companies. Key industry leaders, including Linde PLC, Air Products and Chemicals Inc., and Air Liquide, collectively command a substantial market share. This dominance is underpinned by significant economies of scale achieved through extensive production capabilities and sophisticated distribution networks. Barriers to entry remain high, primarily due to the considerable capital investment required for establishing and maintaining state-of-the-art production facilities and specialized logistical infrastructure necessary for the safe and efficient delivery of industrial gases.
Innovation Ecosystems: The industry is a hotbed of research and development, with substantial investments fueling innovation in advanced gas production technologies. This includes a strong focus on enhancing energy efficiency in separation processes and developing more sophisticated and responsive gas delivery systems. A particularly crucial area of innovation is the burgeoning field of green hydrogen production, leveraging renewable energy sources to create a sustainable alternative for a wide range of applications.
Regulatory Frameworks: A robust and evolving regulatory framework significantly shapes market dynamics. Environmental regulations, particularly those pertaining to emissions control, air quality, and operational safety, are paramount. Stringent safety standards and emissions limits directly influence production methodologies, necessitating continuous investment in compliance and the adoption of best practices to ensure responsible operations.
Substitute Products: While many industrial gas applications have few direct substitutes, the market is not static. In specific niche applications, alternative solutions are beginning to emerge. For instance, the accelerating transition towards electric vehicles is influencing the long-term demand for certain traditional transportation fuels, which indirectly impacts the role of hydrogen in specific segments of the mobility sector.
End-User Trends: Sustained and growing demand from diverse and critical sectors such as petrochemicals, energy production, advanced manufacturing, and healthcare continues to be a primary market expansion engine. Furthermore, the overarching industrial trend towards enhanced energy efficiency and robust sustainability initiatives is increasingly influencing the adoption of greener industrial gas production methods and solutions across the board.
M&A Activities: The US industrial gas sector has been a dynamic landscape for mergers and acquisitions in recent years. These activities are largely driven by strategic objectives aimed at achieving greater economies of scale, accelerating technological adoption, and expanding geographic footprints. The period from 2019 to 2024 saw a notable volume of such strategic transactions, underscoring the industry's consolidation and growth strategies.
US Industrial Gas Industry Industry Insights & Trends
The US industrial gas market is experiencing robust growth, fueled by industrial expansion, energy transition, and technological advancements. The market size is estimated at xx Million in 2025 and is projected to reach xx Million by 2033, exhibiting a CAGR of xx% during the forecast period (2025-2033). Several key factors drive this growth:
- Increasing Industrialization: Expanding manufacturing activities across various sectors, particularly petrochemicals and energy, create high demand for industrial gases.
- Energy Transition: The shift toward renewable energy sources necessitates industrial gases for various applications, including green hydrogen production and energy storage solutions.
- Technological Advancements: Continuous innovations in gas production, purification, and delivery enhance efficiency and reduce costs, promoting wider adoption.
- Evolving Consumer Behavior: Increased awareness of environmental sustainability influences the choice of greener industrial gas production methods.
Technological disruptions, such as the development of advanced separation membranes and energy-efficient liquefaction technologies, are reshaping the competitive landscape. These advancements not only improve efficiency but also reduce the environmental impact of industrial gas production.
Key Markets & Segments Leading US Industrial Gas Industry
Dominant Segments:
- Product Type: Nitrogen and Oxygen represent the largest market segments, driven by extensive applications in various industries. Hydrogen is a rapidly expanding segment due to its increasing role in clean energy.
- End-User Industry: The petrochemical and chemical manufacturing, oil and gas, and energy and power sectors collectively account for the largest share of industrial gas consumption, owing to their high energy-intensive processes. However, the medical and pharmaceutical sector demonstrates significant growth potential, driven by rising healthcare expenditures and technological advancements in medical applications.
Key Drivers:
- Economic Growth: Strong economic growth across various sectors directly translates to higher industrial gas demand.
- Infrastructure Development: Expansion of industrial infrastructure, including energy and chemical plants, creates opportunities for industrial gas suppliers.
- Government Policies: Supportive government policies toward renewable energy and industrial development stimulate market growth.
US Industrial Gas Industry Product Developments
Recent years have witnessed a surge of innovation and refinement in industrial gas technologies, directly benefiting end-users and the environment. Cryogenic separation techniques have seen significant advancements, leading to enhanced production efficiency and a measurable reduction in energy consumption. Parallel developments in gas delivery systems, encompassing both on-site generation units and advanced bulk liquid transportation solutions, are augmenting reliability and convenience for a wide spectrum of industrial clients. The burgeoning field of green hydrogen production, coupled with the development of sophisticated and safe advanced storage solutions, is fundamentally reshaping the market's future trajectory. These collective technological advancements not only elevate product quality and minimize environmental impact but also forge new competitive advantages for pioneering companies within the industry.
Challenges in the US Industrial Gas Industry Market
The US industrial gas market faces several challenges, including fluctuating raw material prices, intense competition among established players, and increasing regulatory compliance costs. Supply chain disruptions, particularly during periods of economic uncertainty or global events, can impact production and delivery. Stringent environmental regulations pose significant compliance costs, adding pressure on profitability.
Forces Driving US Industrial Gas Industry Growth
Several potent forces are propelling the growth of the US industrial gas industry. Foremost among these is the escalating demand from energy-intensive sectors that are crucial to the nation's economy. The accelerating adoption of green hydrogen as a clean energy alternative across the energy sector presents a significant and growing opportunity. Complementing these demand-side drivers are supportive government policies that champion renewable energy initiatives and foster industrial development, creating a favorable operating environment. Technological breakthroughs, particularly in the realm of energy-efficient production methods and the optimization of gas delivery systems, are also making substantial contributions to market expansion. Moreover, the increasing global and domestic emphasis on sustainable business practices across various industries is further stimulating demand for environmentally responsible industrial gas solutions.
Long-Term Growth Catalysts in the US Industrial Gas Industry
Long-term growth catalysts include continued investment in renewable energy infrastructure, advancements in hydrogen production and storage technologies, and growing demand for industrial gases in emerging economies. Strategic partnerships and collaborations across the value chain are crucial for leveraging technological advancements and expanding market access. The increasing focus on energy efficiency and sustainable practices across diverse industries will fuel demand for industrial gases with reduced environmental footprints.
Emerging Opportunities in US Industrial Gas Industry
The US industrial gas industry is poised to capitalize on a range of emerging opportunities. The rapidly expanding green hydrogen market stands out as a pivotal growth area, offering immense potential for both production and distribution. Advanced gas delivery solutions, tailored to meet specific industrial needs, are also creating lucrative avenues for innovation and service provision. Furthermore, the development of specialized gas mixtures designed for niche applications in burgeoning sectors like advanced materials, semiconductor manufacturing, and next-generation electronics presents significant untapped growth potential. The increasing trend of on-site gas generation units for localized supply offers attractive business models for specialized providers seeking to serve specific client requirements efficiently.
Leading Players in the US Industrial Gas Industry Sector
- Linde PLC
- Air Products and Chemicals Inc
- Messer North America Inc
- AIR WATER INC
- nexAir LLC
- Matheson Tri-Gas Inc
- BASF SE
- Iwatani Corporation
- NIPPON SANSO HOLDINGS CORPORATION
- Air Liquide
- UIG
Key Milestones in US Industrial Gas Industry Industry
- May 2022: Air Liquide made a substantial investment of USD 250 million to construct a liquid hydrogen production complex in Nevada, significantly bolstering the infrastructure for hydrogen mobility solutions.
- January 2023: Iwatani Corporation marked its strategic entry into the US industrial gas market with the acquisition of Aspen Air US, LLC, signaling expansion and increased competition.
Strategic Outlook for US Industrial Gas Industry Market
The US industrial gas market is poised for continued growth, driven by the long-term trends of industrialization, renewable energy adoption, and technological advancements. Strategic opportunities exist in leveraging green hydrogen production, developing specialized gas mixtures, and expanding into new end-user markets. Companies with a strong focus on innovation, sustainability, and efficient supply chains are best positioned to capture significant market share in the years to come.
US Industrial Gas Industry Segmentation
-
1. Product Type
- 1.1. Nitrogen
- 1.2. Oxygen
- 1.3. Carbon Dioxide
- 1.4. Hydrogen
- 1.5. Helium
- 1.6. Argon
- 1.7. Ammonia
- 1.8. Methane
- 1.9. Propane
- 1.10. Butane
- 1.11. Other Product Types
-
2. End-User Industry
- 2.1. Oil and Gas
- 2.2. Energy and Power
- 2.3. Petrochemical and Chemical Manufacturing
- 2.4. Medical and Pharmaceutical
- 2.5. Food and Beverage
- 2.6. Metal Manufacturing and Fabrication
- 2.7. Transportation
- 2.8. Other En
US Industrial Gas Industry Segmentation By Geography
-
1. North America
- 1.1. United States
- 1.2. Canada
- 1.3. Mexico
-
2. South America
- 2.1. Brazil
- 2.2. Argentina
- 2.3. Rest of South America
-
3. Europe
- 3.1. United Kingdom
- 3.2. Germany
- 3.3. France
- 3.4. Italy
- 3.5. Spain
- 3.6. Russia
- 3.7. Benelux
- 3.8. Nordics
- 3.9. Rest of Europe
-
4. Middle East & Africa
- 4.1. Turkey
- 4.2. Israel
- 4.3. GCC
- 4.4. North Africa
- 4.5. South Africa
- 4.6. Rest of Middle East & Africa
-
5. Asia Pacific
- 5.1. China
- 5.2. India
- 5.3. Japan
- 5.4. South Korea
- 5.5. ASEAN
- 5.6. Oceania
- 5.7. Rest of Asia Pacific
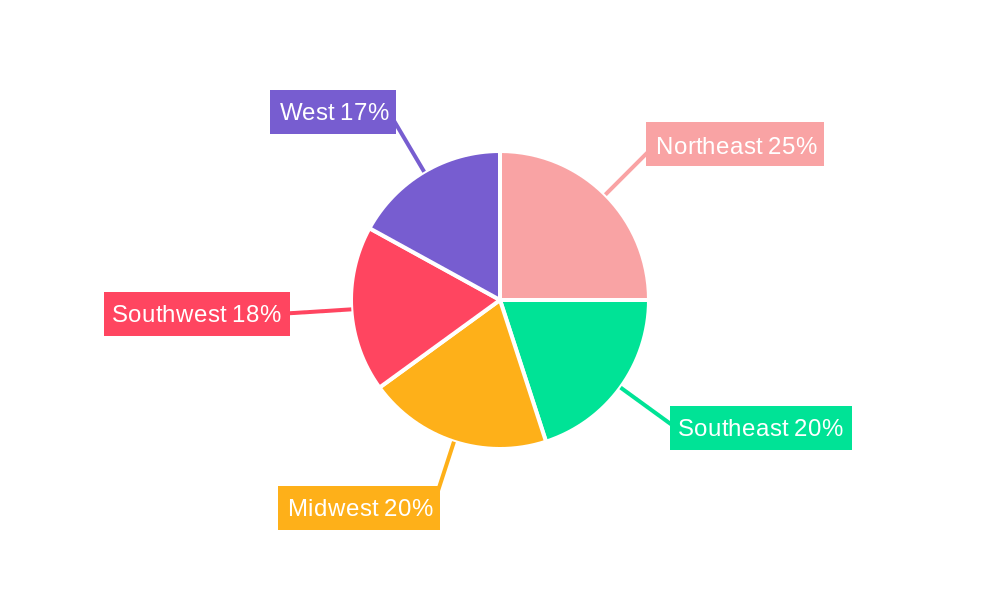
US Industrial Gas Industry Regional Market Share
Geographic Coverage of US Industrial Gas Industry
US Industrial Gas Industry REPORT HIGHLIGHTS
| Aspects | Details |
|---|---|
| Study Period | 2020-2034 |
| Base Year | 2025 |
| Estimated Year | 2026 |
| Forecast Period | 2026-2034 |
| Historical Period | 2020-2025 |
| Growth Rate | CAGR of 3.79% from 2020-2034 |
| Segmentation |
|
Table of Contents
- 1. Introduction
- 1.1. Research Scope
- 1.2. Market Segmentation
- 1.3. Research Objective
- 1.4. Definitions and Assumptions
- 2. Executive Summary
- 2.1. Market Snapshot
- 3. Market Dynamics
- 3.1. Market Drivers
- 3.2. Market Restrains
- 3.3. Market Trends
- 3.4. Market Opportunities
- 4. Market Factor Analysis
- 4.1. Porters Five Forces
- 4.1.1. Bargaining Power of Suppliers
- 4.1.2. Bargaining Power of Buyers
- 4.1.3. Threat of New Entrants
- 4.1.4. Threat of Substitutes
- 4.1.5. Competitive Rivalry
- 4.2. PESTEL analysis
- 4.3. BCG Analysis
- 4.3.1. Stars (High Growth, High Market Share)
- 4.3.2. Cash Cows (Low Growth, High Market Share)
- 4.3.3. Question Mark (High Growth, Low Market Share)
- 4.3.4. Dogs (Low Growth, Low Market Share)
- 4.4. Ansoff Matrix Analysis
- 4.5. Supply Chain Analysis
- 4.6. Regulatory Landscape
- 4.7. Current Market Potential and Opportunity Assessment (TAM–SAM–SOM Framework)
- 4.8. MSR Analyst Note
- 4.1. Porters Five Forces
- 5. Market Analysis, Insights and Forecast 2021-2033
- 5.1. Market Analysis, Insights and Forecast - by Product Type
- 5.1.1. Nitrogen
- 5.1.2. Oxygen
- 5.1.3. Carbon Dioxide
- 5.1.4. Hydrogen
- 5.1.5. Helium
- 5.1.6. Argon
- 5.1.7. Ammonia
- 5.1.8. Methane
- 5.1.9. Propane
- 5.1.10. Butane
- 5.1.11. Other Product Types
- 5.2. Market Analysis, Insights and Forecast - by End-User Industry
- 5.2.1. Oil and Gas
- 5.2.2. Energy and Power
- 5.2.3. Petrochemical and Chemical Manufacturing
- 5.2.4. Medical and Pharmaceutical
- 5.2.5. Food and Beverage
- 5.2.6. Metal Manufacturing and Fabrication
- 5.2.7. Transportation
- 5.2.8. Other En
- 5.3. Market Analysis, Insights and Forecast - by Region
- 5.3.1. North America
- 5.3.2. South America
- 5.3.3. Europe
- 5.3.4. Middle East & Africa
- 5.3.5. Asia Pacific
- 5.1. Market Analysis, Insights and Forecast - by Product Type
- 6. Global US Industrial Gas Industry Analysis, Insights and Forecast, 2021-2033
- 6.1. Market Analysis, Insights and Forecast - by Product Type
- 6.1.1. Nitrogen
- 6.1.2. Oxygen
- 6.1.3. Carbon Dioxide
- 6.1.4. Hydrogen
- 6.1.5. Helium
- 6.1.6. Argon
- 6.1.7. Ammonia
- 6.1.8. Methane
- 6.1.9. Propane
- 6.1.10. Butane
- 6.1.11. Other Product Types
- 6.2. Market Analysis, Insights and Forecast - by End-User Industry
- 6.2.1. Oil and Gas
- 6.2.2. Energy and Power
- 6.2.3. Petrochemical and Chemical Manufacturing
- 6.2.4. Medical and Pharmaceutical
- 6.2.5. Food and Beverage
- 6.2.6. Metal Manufacturing and Fabrication
- 6.2.7. Transportation
- 6.2.8. Other En
- 6.1. Market Analysis, Insights and Forecast - by Product Type
- 7. North America US Industrial Gas Industry Analysis, Insights and Forecast, 2020-2032
- 7.1. Market Analysis, Insights and Forecast - by Product Type
- 7.1.1. Nitrogen
- 7.1.2. Oxygen
- 7.1.3. Carbon Dioxide
- 7.1.4. Hydrogen
- 7.1.5. Helium
- 7.1.6. Argon
- 7.1.7. Ammonia
- 7.1.8. Methane
- 7.1.9. Propane
- 7.1.10. Butane
- 7.1.11. Other Product Types
- 7.2. Market Analysis, Insights and Forecast - by End-User Industry
- 7.2.1. Oil and Gas
- 7.2.2. Energy and Power
- 7.2.3. Petrochemical and Chemical Manufacturing
- 7.2.4. Medical and Pharmaceutical
- 7.2.5. Food and Beverage
- 7.2.6. Metal Manufacturing and Fabrication
- 7.2.7. Transportation
- 7.2.8. Other En
- 7.1. Market Analysis, Insights and Forecast - by Product Type
- 8. South America US Industrial Gas Industry Analysis, Insights and Forecast, 2020-2032
- 8.1. Market Analysis, Insights and Forecast - by Product Type
- 8.1.1. Nitrogen
- 8.1.2. Oxygen
- 8.1.3. Carbon Dioxide
- 8.1.4. Hydrogen
- 8.1.5. Helium
- 8.1.6. Argon
- 8.1.7. Ammonia
- 8.1.8. Methane
- 8.1.9. Propane
- 8.1.10. Butane
- 8.1.11. Other Product Types
- 8.2. Market Analysis, Insights and Forecast - by End-User Industry
- 8.2.1. Oil and Gas
- 8.2.2. Energy and Power
- 8.2.3. Petrochemical and Chemical Manufacturing
- 8.2.4. Medical and Pharmaceutical
- 8.2.5. Food and Beverage
- 8.2.6. Metal Manufacturing and Fabrication
- 8.2.7. Transportation
- 8.2.8. Other En
- 8.1. Market Analysis, Insights and Forecast - by Product Type
- 9. Europe US Industrial Gas Industry Analysis, Insights and Forecast, 2020-2032
- 9.1. Market Analysis, Insights and Forecast - by Product Type
- 9.1.1. Nitrogen
- 9.1.2. Oxygen
- 9.1.3. Carbon Dioxide
- 9.1.4. Hydrogen
- 9.1.5. Helium
- 9.1.6. Argon
- 9.1.7. Ammonia
- 9.1.8. Methane
- 9.1.9. Propane
- 9.1.10. Butane
- 9.1.11. Other Product Types
- 9.2. Market Analysis, Insights and Forecast - by End-User Industry
- 9.2.1. Oil and Gas
- 9.2.2. Energy and Power
- 9.2.3. Petrochemical and Chemical Manufacturing
- 9.2.4. Medical and Pharmaceutical
- 9.2.5. Food and Beverage
- 9.2.6. Metal Manufacturing and Fabrication
- 9.2.7. Transportation
- 9.2.8. Other En
- 9.1. Market Analysis, Insights and Forecast - by Product Type
- 10. Middle East & Africa US Industrial Gas Industry Analysis, Insights and Forecast, 2020-2032
- 10.1. Market Analysis, Insights and Forecast - by Product Type
- 10.1.1. Nitrogen
- 10.1.2. Oxygen
- 10.1.3. Carbon Dioxide
- 10.1.4. Hydrogen
- 10.1.5. Helium
- 10.1.6. Argon
- 10.1.7. Ammonia
- 10.1.8. Methane
- 10.1.9. Propane
- 10.1.10. Butane
- 10.1.11. Other Product Types
- 10.2. Market Analysis, Insights and Forecast - by End-User Industry
- 10.2.1. Oil and Gas
- 10.2.2. Energy and Power
- 10.2.3. Petrochemical and Chemical Manufacturing
- 10.2.4. Medical and Pharmaceutical
- 10.2.5. Food and Beverage
- 10.2.6. Metal Manufacturing and Fabrication
- 10.2.7. Transportation
- 10.2.8. Other En
- 10.1. Market Analysis, Insights and Forecast - by Product Type
- 11. Asia Pacific US Industrial Gas Industry Analysis, Insights and Forecast, 2020-2032
- 11.1. Market Analysis, Insights and Forecast - by Product Type
- 11.1.1. Nitrogen
- 11.1.2. Oxygen
- 11.1.3. Carbon Dioxide
- 11.1.4. Hydrogen
- 11.1.5. Helium
- 11.1.6. Argon
- 11.1.7. Ammonia
- 11.1.8. Methane
- 11.1.9. Propane
- 11.1.10. Butane
- 11.1.11. Other Product Types
- 11.2. Market Analysis, Insights and Forecast - by End-User Industry
- 11.2.1. Oil and Gas
- 11.2.2. Energy and Power
- 11.2.3. Petrochemical and Chemical Manufacturing
- 11.2.4. Medical and Pharmaceutical
- 11.2.5. Food and Beverage
- 11.2.6. Metal Manufacturing and Fabrication
- 11.2.7. Transportation
- 11.2.8. Other En
- 11.1. Market Analysis, Insights and Forecast - by Product Type
- 12. Competitive Analysis
- 12.1. Company Profiles
- 12.1.1 Linde PLC
- 12.1.1.1. Company Overview
- 12.1.1.2. Products
- 12.1.1.3. Company Financials
- 12.1.1.4. SWOT Analysis
- 12.1.2 Air Products and Chemicals Inc
- 12.1.2.1. Company Overview
- 12.1.2.2. Products
- 12.1.2.3. Company Financials
- 12.1.2.4. SWOT Analysis
- 12.1.3 Messer North America Inc
- 12.1.3.1. Company Overview
- 12.1.3.2. Products
- 12.1.3.3. Company Financials
- 12.1.3.4. SWOT Analysis
- 12.1.4 AIR WATER INC
- 12.1.4.1. Company Overview
- 12.1.4.2. Products
- 12.1.4.3. Company Financials
- 12.1.4.4. SWOT Analysis
- 12.1.5 nexAir LLC
- 12.1.5.1. Company Overview
- 12.1.5.2. Products
- 12.1.5.3. Company Financials
- 12.1.5.4. SWOT Analysis
- 12.1.6 Matheson Tri-Gas Inc
- 12.1.6.1. Company Overview
- 12.1.6.2. Products
- 12.1.6.3. Company Financials
- 12.1.6.4. SWOT Analysis
- 12.1.7 BASF SE
- 12.1.7.1. Company Overview
- 12.1.7.2. Products
- 12.1.7.3. Company Financials
- 12.1.7.4. SWOT Analysis
- 12.1.8 Iwatani Corporation
- 12.1.8.1. Company Overview
- 12.1.8.2. Products
- 12.1.8.3. Company Financials
- 12.1.8.4. SWOT Analysis
- 12.1.9 NIPPON SANSO HOLDINGS CORPORATION
- 12.1.9.1. Company Overview
- 12.1.9.2. Products
- 12.1.9.3. Company Financials
- 12.1.9.4. SWOT Analysis
- 12.1.10 Air Liquide
- 12.1.10.1. Company Overview
- 12.1.10.2. Products
- 12.1.10.3. Company Financials
- 12.1.10.4. SWOT Analysis
- 12.1.11 UIG*List Not Exhaustive
- 12.1.11.1. Company Overview
- 12.1.11.2. Products
- 12.1.11.3. Company Financials
- 12.1.11.4. SWOT Analysis
- 12.1.1 Linde PLC
- 12.2. Market Entropy
- 12.2.1 Company's Key Areas Served
- 12.2.2 Recent Developments
- 12.3. Company Market Share Analysis 2025
- 12.3.1 Top 5 Companies Market Share Analysis
- 12.3.2 Top 3 Companies Market Share Analysis
- 12.4. List of Potential Customers
- 13. Research Methodology
List of Figures
- Figure 1: Global US Industrial Gas Industry Revenue Breakdown (Million, %) by Region 2025 & 2033
- Figure 2: Global US Industrial Gas Industry Volume Breakdown (K Tons, %) by Region 2025 & 2033
- Figure 3: North America US Industrial Gas Industry Revenue (Million), by Product Type 2025 & 2033
- Figure 4: North America US Industrial Gas Industry Volume (K Tons), by Product Type 2025 & 2033
- Figure 5: North America US Industrial Gas Industry Revenue Share (%), by Product Type 2025 & 2033
- Figure 6: North America US Industrial Gas Industry Volume Share (%), by Product Type 2025 & 2033
- Figure 7: North America US Industrial Gas Industry Revenue (Million), by End-User Industry 2025 & 2033
- Figure 8: North America US Industrial Gas Industry Volume (K Tons), by End-User Industry 2025 & 2033
- Figure 9: North America US Industrial Gas Industry Revenue Share (%), by End-User Industry 2025 & 2033
- Figure 10: North America US Industrial Gas Industry Volume Share (%), by End-User Industry 2025 & 2033
- Figure 11: North America US Industrial Gas Industry Revenue (Million), by Country 2025 & 2033
- Figure 12: North America US Industrial Gas Industry Volume (K Tons), by Country 2025 & 2033
- Figure 13: North America US Industrial Gas Industry Revenue Share (%), by Country 2025 & 2033
- Figure 14: North America US Industrial Gas Industry Volume Share (%), by Country 2025 & 2033
- Figure 15: South America US Industrial Gas Industry Revenue (Million), by Product Type 2025 & 2033
- Figure 16: South America US Industrial Gas Industry Volume (K Tons), by Product Type 2025 & 2033
- Figure 17: South America US Industrial Gas Industry Revenue Share (%), by Product Type 2025 & 2033
- Figure 18: South America US Industrial Gas Industry Volume Share (%), by Product Type 2025 & 2033
- Figure 19: South America US Industrial Gas Industry Revenue (Million), by End-User Industry 2025 & 2033
- Figure 20: South America US Industrial Gas Industry Volume (K Tons), by End-User Industry 2025 & 2033
- Figure 21: South America US Industrial Gas Industry Revenue Share (%), by End-User Industry 2025 & 2033
- Figure 22: South America US Industrial Gas Industry Volume Share (%), by End-User Industry 2025 & 2033
- Figure 23: South America US Industrial Gas Industry Revenue (Million), by Country 2025 & 2033
- Figure 24: South America US Industrial Gas Industry Volume (K Tons), by Country 2025 & 2033
- Figure 25: South America US Industrial Gas Industry Revenue Share (%), by Country 2025 & 2033
- Figure 26: South America US Industrial Gas Industry Volume Share (%), by Country 2025 & 2033
- Figure 27: Europe US Industrial Gas Industry Revenue (Million), by Product Type 2025 & 2033
- Figure 28: Europe US Industrial Gas Industry Volume (K Tons), by Product Type 2025 & 2033
- Figure 29: Europe US Industrial Gas Industry Revenue Share (%), by Product Type 2025 & 2033
- Figure 30: Europe US Industrial Gas Industry Volume Share (%), by Product Type 2025 & 2033
- Figure 31: Europe US Industrial Gas Industry Revenue (Million), by End-User Industry 2025 & 2033
- Figure 32: Europe US Industrial Gas Industry Volume (K Tons), by End-User Industry 2025 & 2033
- Figure 33: Europe US Industrial Gas Industry Revenue Share (%), by End-User Industry 2025 & 2033
- Figure 34: Europe US Industrial Gas Industry Volume Share (%), by End-User Industry 2025 & 2033
- Figure 35: Europe US Industrial Gas Industry Revenue (Million), by Country 2025 & 2033
- Figure 36: Europe US Industrial Gas Industry Volume (K Tons), by Country 2025 & 2033
- Figure 37: Europe US Industrial Gas Industry Revenue Share (%), by Country 2025 & 2033
- Figure 38: Europe US Industrial Gas Industry Volume Share (%), by Country 2025 & 2033
- Figure 39: Middle East & Africa US Industrial Gas Industry Revenue (Million), by Product Type 2025 & 2033
- Figure 40: Middle East & Africa US Industrial Gas Industry Volume (K Tons), by Product Type 2025 & 2033
- Figure 41: Middle East & Africa US Industrial Gas Industry Revenue Share (%), by Product Type 2025 & 2033
- Figure 42: Middle East & Africa US Industrial Gas Industry Volume Share (%), by Product Type 2025 & 2033
- Figure 43: Middle East & Africa US Industrial Gas Industry Revenue (Million), by End-User Industry 2025 & 2033
- Figure 44: Middle East & Africa US Industrial Gas Industry Volume (K Tons), by End-User Industry 2025 & 2033
- Figure 45: Middle East & Africa US Industrial Gas Industry Revenue Share (%), by End-User Industry 2025 & 2033
- Figure 46: Middle East & Africa US Industrial Gas Industry Volume Share (%), by End-User Industry 2025 & 2033
- Figure 47: Middle East & Africa US Industrial Gas Industry Revenue (Million), by Country 2025 & 2033
- Figure 48: Middle East & Africa US Industrial Gas Industry Volume (K Tons), by Country 2025 & 2033
- Figure 49: Middle East & Africa US Industrial Gas Industry Revenue Share (%), by Country 2025 & 2033
- Figure 50: Middle East & Africa US Industrial Gas Industry Volume Share (%), by Country 2025 & 2033
- Figure 51: Asia Pacific US Industrial Gas Industry Revenue (Million), by Product Type 2025 & 2033
- Figure 52: Asia Pacific US Industrial Gas Industry Volume (K Tons), by Product Type 2025 & 2033
- Figure 53: Asia Pacific US Industrial Gas Industry Revenue Share (%), by Product Type 2025 & 2033
- Figure 54: Asia Pacific US Industrial Gas Industry Volume Share (%), by Product Type 2025 & 2033
- Figure 55: Asia Pacific US Industrial Gas Industry Revenue (Million), by End-User Industry 2025 & 2033
- Figure 56: Asia Pacific US Industrial Gas Industry Volume (K Tons), by End-User Industry 2025 & 2033
- Figure 57: Asia Pacific US Industrial Gas Industry Revenue Share (%), by End-User Industry 2025 & 2033
- Figure 58: Asia Pacific US Industrial Gas Industry Volume Share (%), by End-User Industry 2025 & 2033
- Figure 59: Asia Pacific US Industrial Gas Industry Revenue (Million), by Country 2025 & 2033
- Figure 60: Asia Pacific US Industrial Gas Industry Volume (K Tons), by Country 2025 & 2033
- Figure 61: Asia Pacific US Industrial Gas Industry Revenue Share (%), by Country 2025 & 2033
- Figure 62: Asia Pacific US Industrial Gas Industry Volume Share (%), by Country 2025 & 2033
List of Tables
- Table 1: Global US Industrial Gas Industry Revenue Million Forecast, by Product Type 2020 & 2033
- Table 2: Global US Industrial Gas Industry Volume K Tons Forecast, by Product Type 2020 & 2033
- Table 3: Global US Industrial Gas Industry Revenue Million Forecast, by End-User Industry 2020 & 2033
- Table 4: Global US Industrial Gas Industry Volume K Tons Forecast, by End-User Industry 2020 & 2033
- Table 5: Global US Industrial Gas Industry Revenue Million Forecast, by Region 2020 & 2033
- Table 6: Global US Industrial Gas Industry Volume K Tons Forecast, by Region 2020 & 2033
- Table 7: Global US Industrial Gas Industry Revenue Million Forecast, by Product Type 2020 & 2033
- Table 8: Global US Industrial Gas Industry Volume K Tons Forecast, by Product Type 2020 & 2033
- Table 9: Global US Industrial Gas Industry Revenue Million Forecast, by End-User Industry 2020 & 2033
- Table 10: Global US Industrial Gas Industry Volume K Tons Forecast, by End-User Industry 2020 & 2033
- Table 11: Global US Industrial Gas Industry Revenue Million Forecast, by Country 2020 & 2033
- Table 12: Global US Industrial Gas Industry Volume K Tons Forecast, by Country 2020 & 2033
- Table 13: United States US Industrial Gas Industry Revenue (Million) Forecast, by Application 2020 & 2033
- Table 14: United States US Industrial Gas Industry Volume (K Tons) Forecast, by Application 2020 & 2033
- Table 15: Canada US Industrial Gas Industry Revenue (Million) Forecast, by Application 2020 & 2033
- Table 16: Canada US Industrial Gas Industry Volume (K Tons) Forecast, by Application 2020 & 2033
- Table 17: Mexico US Industrial Gas Industry Revenue (Million) Forecast, by Application 2020 & 2033
- Table 18: Mexico US Industrial Gas Industry Volume (K Tons) Forecast, by Application 2020 & 2033
- Table 19: Global US Industrial Gas Industry Revenue Million Forecast, by Product Type 2020 & 2033
- Table 20: Global US Industrial Gas Industry Volume K Tons Forecast, by Product Type 2020 & 2033
- Table 21: Global US Industrial Gas Industry Revenue Million Forecast, by End-User Industry 2020 & 2033
- Table 22: Global US Industrial Gas Industry Volume K Tons Forecast, by End-User Industry 2020 & 2033
- Table 23: Global US Industrial Gas Industry Revenue Million Forecast, by Country 2020 & 2033
- Table 24: Global US Industrial Gas Industry Volume K Tons Forecast, by Country 2020 & 2033
- Table 25: Brazil US Industrial Gas Industry Revenue (Million) Forecast, by Application 2020 & 2033
- Table 26: Brazil US Industrial Gas Industry Volume (K Tons) Forecast, by Application 2020 & 2033
- Table 27: Argentina US Industrial Gas Industry Revenue (Million) Forecast, by Application 2020 & 2033
- Table 28: Argentina US Industrial Gas Industry Volume (K Tons) Forecast, by Application 2020 & 2033
- Table 29: Rest of South America US Industrial Gas Industry Revenue (Million) Forecast, by Application 2020 & 2033
- Table 30: Rest of South America US Industrial Gas Industry Volume (K Tons) Forecast, by Application 2020 & 2033
- Table 31: Global US Industrial Gas Industry Revenue Million Forecast, by Product Type 2020 & 2033
- Table 32: Global US Industrial Gas Industry Volume K Tons Forecast, by Product Type 2020 & 2033
- Table 33: Global US Industrial Gas Industry Revenue Million Forecast, by End-User Industry 2020 & 2033
- Table 34: Global US Industrial Gas Industry Volume K Tons Forecast, by End-User Industry 2020 & 2033
- Table 35: Global US Industrial Gas Industry Revenue Million Forecast, by Country 2020 & 2033
- Table 36: Global US Industrial Gas Industry Volume K Tons Forecast, by Country 2020 & 2033
- Table 37: United Kingdom US Industrial Gas Industry Revenue (Million) Forecast, by Application 2020 & 2033
- Table 38: United Kingdom US Industrial Gas Industry Volume (K Tons) Forecast, by Application 2020 & 2033
- Table 39: Germany US Industrial Gas Industry Revenue (Million) Forecast, by Application 2020 & 2033
- Table 40: Germany US Industrial Gas Industry Volume (K Tons) Forecast, by Application 2020 & 2033
- Table 41: France US Industrial Gas Industry Revenue (Million) Forecast, by Application 2020 & 2033
- Table 42: France US Industrial Gas Industry Volume (K Tons) Forecast, by Application 2020 & 2033
- Table 43: Italy US Industrial Gas Industry Revenue (Million) Forecast, by Application 2020 & 2033
- Table 44: Italy US Industrial Gas Industry Volume (K Tons) Forecast, by Application 2020 & 2033
- Table 45: Spain US Industrial Gas Industry Revenue (Million) Forecast, by Application 2020 & 2033
- Table 46: Spain US Industrial Gas Industry Volume (K Tons) Forecast, by Application 2020 & 2033
- Table 47: Russia US Industrial Gas Industry Revenue (Million) Forecast, by Application 2020 & 2033
- Table 48: Russia US Industrial Gas Industry Volume (K Tons) Forecast, by Application 2020 & 2033
- Table 49: Benelux US Industrial Gas Industry Revenue (Million) Forecast, by Application 2020 & 2033
- Table 50: Benelux US Industrial Gas Industry Volume (K Tons) Forecast, by Application 2020 & 2033
- Table 51: Nordics US Industrial Gas Industry Revenue (Million) Forecast, by Application 2020 & 2033
- Table 52: Nordics US Industrial Gas Industry Volume (K Tons) Forecast, by Application 2020 & 2033
- Table 53: Rest of Europe US Industrial Gas Industry Revenue (Million) Forecast, by Application 2020 & 2033
- Table 54: Rest of Europe US Industrial Gas Industry Volume (K Tons) Forecast, by Application 2020 & 2033
- Table 55: Global US Industrial Gas Industry Revenue Million Forecast, by Product Type 2020 & 2033
- Table 56: Global US Industrial Gas Industry Volume K Tons Forecast, by Product Type 2020 & 2033
- Table 57: Global US Industrial Gas Industry Revenue Million Forecast, by End-User Industry 2020 & 2033
- Table 58: Global US Industrial Gas Industry Volume K Tons Forecast, by End-User Industry 2020 & 2033
- Table 59: Global US Industrial Gas Industry Revenue Million Forecast, by Country 2020 & 2033
- Table 60: Global US Industrial Gas Industry Volume K Tons Forecast, by Country 2020 & 2033
- Table 61: Turkey US Industrial Gas Industry Revenue (Million) Forecast, by Application 2020 & 2033
- Table 62: Turkey US Industrial Gas Industry Volume (K Tons) Forecast, by Application 2020 & 2033
- Table 63: Israel US Industrial Gas Industry Revenue (Million) Forecast, by Application 2020 & 2033
- Table 64: Israel US Industrial Gas Industry Volume (K Tons) Forecast, by Application 2020 & 2033
- Table 65: GCC US Industrial Gas Industry Revenue (Million) Forecast, by Application 2020 & 2033
- Table 66: GCC US Industrial Gas Industry Volume (K Tons) Forecast, by Application 2020 & 2033
- Table 67: North Africa US Industrial Gas Industry Revenue (Million) Forecast, by Application 2020 & 2033
- Table 68: North Africa US Industrial Gas Industry Volume (K Tons) Forecast, by Application 2020 & 2033
- Table 69: South Africa US Industrial Gas Industry Revenue (Million) Forecast, by Application 2020 & 2033
- Table 70: South Africa US Industrial Gas Industry Volume (K Tons) Forecast, by Application 2020 & 2033
- Table 71: Rest of Middle East & Africa US Industrial Gas Industry Revenue (Million) Forecast, by Application 2020 & 2033
- Table 72: Rest of Middle East & Africa US Industrial Gas Industry Volume (K Tons) Forecast, by Application 2020 & 2033
- Table 73: Global US Industrial Gas Industry Revenue Million Forecast, by Product Type 2020 & 2033
- Table 74: Global US Industrial Gas Industry Volume K Tons Forecast, by Product Type 2020 & 2033
- Table 75: Global US Industrial Gas Industry Revenue Million Forecast, by End-User Industry 2020 & 2033
- Table 76: Global US Industrial Gas Industry Volume K Tons Forecast, by End-User Industry 2020 & 2033
- Table 77: Global US Industrial Gas Industry Revenue Million Forecast, by Country 2020 & 2033
- Table 78: Global US Industrial Gas Industry Volume K Tons Forecast, by Country 2020 & 2033
- Table 79: China US Industrial Gas Industry Revenue (Million) Forecast, by Application 2020 & 2033
- Table 80: China US Industrial Gas Industry Volume (K Tons) Forecast, by Application 2020 & 2033
- Table 81: India US Industrial Gas Industry Revenue (Million) Forecast, by Application 2020 & 2033
- Table 82: India US Industrial Gas Industry Volume (K Tons) Forecast, by Application 2020 & 2033
- Table 83: Japan US Industrial Gas Industry Revenue (Million) Forecast, by Application 2020 & 2033
- Table 84: Japan US Industrial Gas Industry Volume (K Tons) Forecast, by Application 2020 & 2033
- Table 85: South Korea US Industrial Gas Industry Revenue (Million) Forecast, by Application 2020 & 2033
- Table 86: South Korea US Industrial Gas Industry Volume (K Tons) Forecast, by Application 2020 & 2033
- Table 87: ASEAN US Industrial Gas Industry Revenue (Million) Forecast, by Application 2020 & 2033
- Table 88: ASEAN US Industrial Gas Industry Volume (K Tons) Forecast, by Application 2020 & 2033
- Table 89: Oceania US Industrial Gas Industry Revenue (Million) Forecast, by Application 2020 & 2033
- Table 90: Oceania US Industrial Gas Industry Volume (K Tons) Forecast, by Application 2020 & 2033
- Table 91: Rest of Asia Pacific US Industrial Gas Industry Revenue (Million) Forecast, by Application 2020 & 2033
- Table 92: Rest of Asia Pacific US Industrial Gas Industry Volume (K Tons) Forecast, by Application 2020 & 2033
Frequently Asked Questions
1. What is the projected Compound Annual Growth Rate (CAGR) of the US Industrial Gas Industry?
The projected CAGR is approximately 3.79%.
2. Which companies are prominent players in the US Industrial Gas Industry?
Key companies in the market include Linde PLC, Air Products and Chemicals Inc, Messer North America Inc, AIR WATER INC, nexAir LLC, Matheson Tri-Gas Inc, BASF SE, Iwatani Corporation, NIPPON SANSO HOLDINGS CORPORATION, Air Liquide, UIG*List Not Exhaustive.
3. What are the main segments of the US Industrial Gas Industry?
The market segments include Product Type, End-User Industry.
4. Can you provide details about the market size?
The market size is estimated to be USD 363.72 Million as of 2022.
5. What are some drivers contributing to market growth?
Increasing Demand from the Healthcare Sector; Increasing Demand for Frozen and Stored Food; Growing Need for Alternate Energy Sources.
6. What are the notable trends driving market growth?
Resilient Demand from the Healthcare Industry.
7. Are there any restraints impacting market growth?
Environmental Regulations and Safety Issues; Other Restraints.
8. Can you provide examples of recent developments in the market?
January 2023: Iwatani Corporation of America, a wholly-owned subsidiary of Iwatani Corporation, announced the acquisition of Aspen Air US, LLC, a leading manufacturer and distributor of bulk liquid industrial gases. This acquisition marks Iwatani's entrance into the United States Industrial Gases sector and highlights the company's expansion focus in this business segment.
9. What pricing options are available for accessing the report?
Pricing options include single-user, multi-user, and enterprise licenses priced at USD 3800, USD 4500, and USD 5800 respectively.
10. Is the market size provided in terms of value or volume?
The market size is provided in terms of value, measured in Million and volume, measured in K Tons.
11. Are there any specific market keywords associated with the report?
Yes, the market keyword associated with the report is "US Industrial Gas Industry," which aids in identifying and referencing the specific market segment covered.
12. How do I determine which pricing option suits my needs best?
The pricing options vary based on user requirements and access needs. Individual users may opt for single-user licenses, while businesses requiring broader access may choose multi-user or enterprise licenses for cost-effective access to the report.
13. Are there any additional resources or data provided in the US Industrial Gas Industry report?
While the report offers comprehensive insights, it's advisable to review the specific contents or supplementary materials provided to ascertain if additional resources or data are available.
14. How can I stay updated on further developments or reports in the US Industrial Gas Industry?
To stay informed about further developments, trends, and reports in the US Industrial Gas Industry, consider subscribing to industry newsletters, following relevant companies and organizations, or regularly checking reputable industry news sources and publications.
Methodology
Step 1 - Identification of Relevant Samples Size from Population Database


Step 2 - Approaches for Defining Global Market Size (Value, Volume* & Price*)

Note*: In applicable scenarios
Step 3 - Data Sources
Primary Research
- Web Analytics
- Survey Reports
- Research Institute
- Latest Research Reports
- Opinion Leaders
Secondary Research
- Annual Reports
- White Paper
- Latest Press Release
- Industry Association
- Paid Database
- Investor Presentations

Step 4 - Data Triangulation
Involves using different sources of information in order to increase the validity of a study
These sources are likely to be stakeholders in a program - participants, other researchers, program staff, other community members, and so on.
Then we put all data in single framework & apply various statistical tools to find out the dynamic on the market.
During the analysis stage, feedback from the stakeholder groups would be compared to determine areas of agreement as well as areas of divergence