

Key Insights
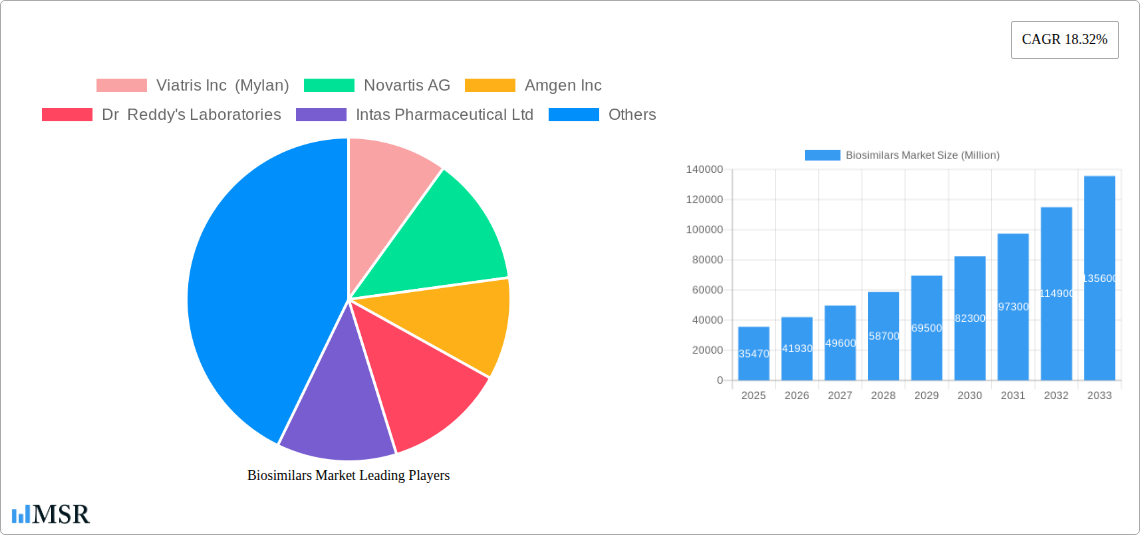
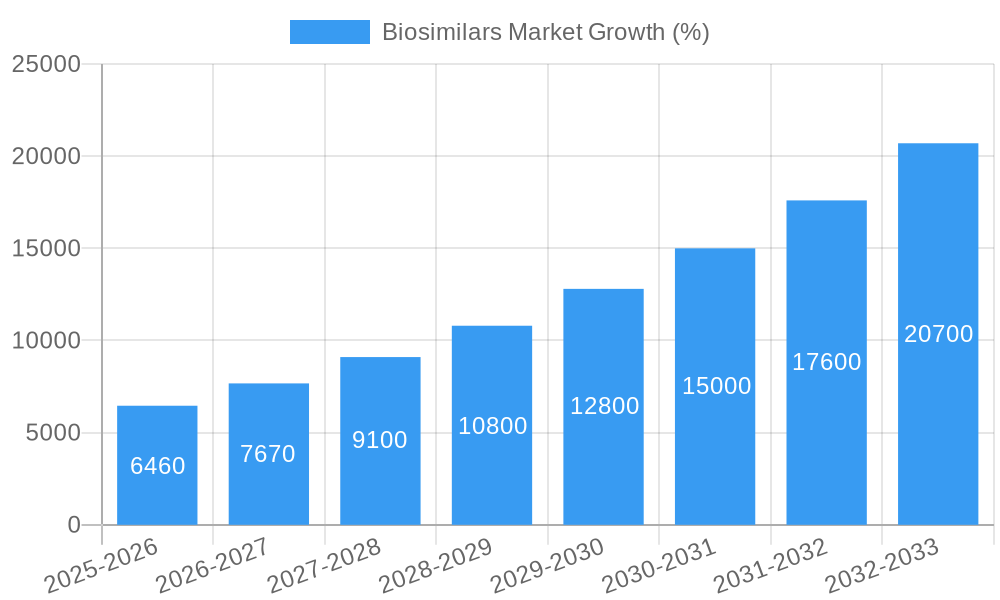
The biosimilars market, valued at $35.47 billion in 2025, is projected to experience robust growth, driven by increasing demand for cost-effective alternatives to biologics and a favorable regulatory landscape. The Compound Annual Growth Rate (CAGR) of 18.32% from 2025 to 2033 signifies significant market expansion. Key drivers include rising healthcare costs, increasing prevalence of chronic diseases like cancer and autoimmune disorders, and growing government initiatives to promote biosimilar adoption. The market segmentation reveals a diverse product landscape, with monoclonal antibodies, recombinant hormones, and immunomodulators leading the product class segments. Applications such as oncology, blood disorders, and chronic/autoimmune diseases dominate the market. The competitive landscape is characterized by a mix of established pharmaceutical giants like Amgen, Novartis, and Pfizer, alongside emerging biosimilar specialists like Coherus Biosciences and Samsung Bioepis. Geographical expansion, particularly in rapidly developing economies of Asia-Pacific and Latin America, presents substantial opportunities for growth. However, challenges remain, including overcoming physician and patient hesitancy related to biosimilar efficacy and safety concerns, along with patent protection issues and complex regulatory approval processes. Furthermore, the need for robust post-market surveillance to assure biosimilar performance will influence market dynamics.
The projected market expansion hinges on several factors. Continued technological advancements in biosimilar development and manufacturing will likely lower production costs and enhance product efficacy. Strategic partnerships and collaborations between pharmaceutical companies and biotechnology firms will accelerate innovation and market penetration. Furthermore, enhanced healthcare infrastructure in developing regions and increasing awareness among healthcare professionals about biosimilar benefits will contribute significantly to market growth. Nevertheless, pricing strategies and effective communication regarding biosimilar safety and efficacy to both healthcare providers and patients remain crucial aspects to navigate regulatory hurdles and achieve widespread market adoption. The forecast period (2025-2033) anticipates a significant increase in market value, propelled by the factors mentioned, despite potential challenges posed by regulatory variations across different global markets.
Biosimilars Market Report: 2019-2033 Forecast
This comprehensive report provides a detailed analysis of the global biosimilars market, offering actionable insights for industry stakeholders. Covering the period 2019-2033, with a base year of 2025 and a forecast period of 2025-2033, this report examines market dynamics, key segments, leading players, and future growth opportunities. The global biosimilars market is projected to reach xx Million by 2033, exhibiting a CAGR of xx% during the forecast period.
Biosimilars Market Concentration & Dynamics
The biosimilars market is characterized by a moderately concentrated landscape, with a few major players holding significant market share. However, the market is dynamic, with ongoing innovation, regulatory changes, and strategic mergers and acquisitions (M&A) impacting the competitive structure. The market share of the top five companies in 2024 was estimated at approximately xx%, indicating room for smaller players to grow.
- Market Concentration: The Herfindahl-Hirschman Index (HHI) for the biosimilars market is estimated at xx in 2024.
- Innovation Ecosystems: Significant R&D investments drive innovation in biosimilar development, focusing on improved manufacturing processes and novel delivery systems.
- Regulatory Frameworks: Stringent regulatory approvals and biosimilarity assessments create barriers to entry but ensure product safety and efficacy. Variations in regulatory pathways across different geographies significantly influence market access.
- Substitute Products: The availability of originator biologics and other therapeutic alternatives represents a competitive pressure on biosimilar adoption.
- End-User Trends: Increasing healthcare spending, rising prevalence of chronic diseases, and growing demand for cost-effective treatments fuel market growth.
- M&A Activities: A significant number of M&A deals, estimated at xx in the last five years, showcase the strategic importance of biosimilars within pharmaceutical companies’ portfolios. These deals often involve technology acquisitions, expansion into new therapeutic areas, and consolidation of market share.
Biosimilars Market Industry Insights & Trends
The biosimilars market is experiencing robust growth driven by several factors. The increasing prevalence of chronic diseases such as cancer, autoimmune disorders, and diabetes necessitates the development of more affordable treatment options. Biosimilars offer a cost-effective alternative to originator biologics, making them increasingly attractive to healthcare systems and payers worldwide. Technological advancements in biomanufacturing and analytical techniques are also contributing to the market's expansion, allowing for the development of higher-quality and more consistent biosimilars. Consumer preference for accessible and affordable healthcare is also driving this growth.
The market size in 2024 was estimated at xx Million and is projected to reach xx Million by 2033. Several factors contribute to this growth, including technological advancements, such as more efficient manufacturing processes and the development of novel delivery methods. The growing demand for cost-effective alternatives to high-priced biologics and the increasing prevalence of chronic diseases are also driving this expansion. Changing consumer behaviors, reflecting increasing demand for affordable medication, strongly support market expansion.
Key Markets & Segments Leading Biosimilars Market
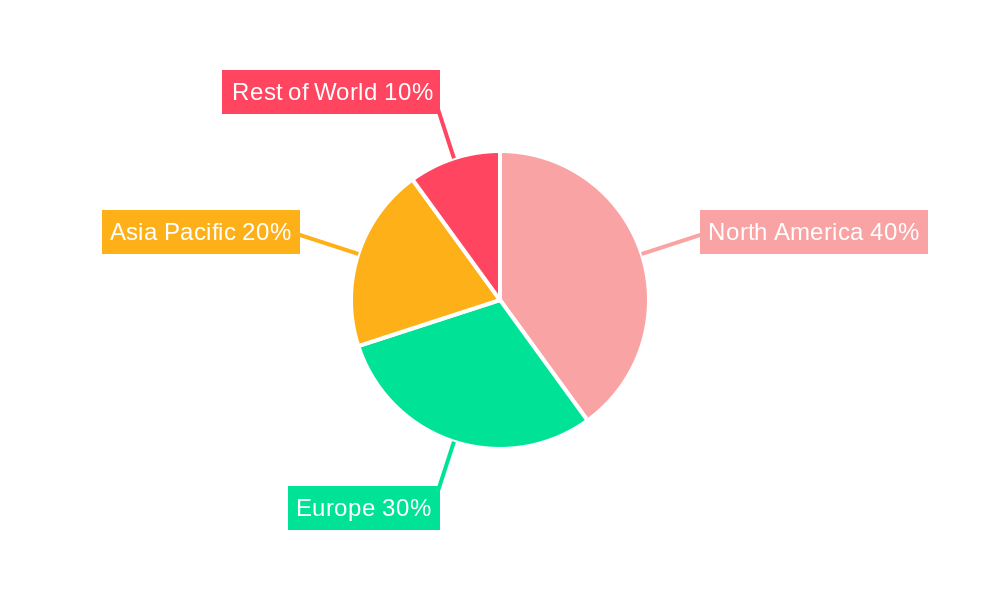
The North American region holds a dominant position in the global biosimilars market, driven by a robust regulatory framework, high healthcare expenditure, and a large patient population. However, the European and Asian markets are also witnessing significant growth, spurred by increasing healthcare awareness and rising demand for cost-effective treatments.
By Product Class:
- Monoclonal Antibodies: This segment dominates the market due to the high prevalence of diseases treatable with monoclonal antibodies and a robust pipeline of biosimilars in development. This is driven by large patient populations requiring these treatments, and ongoing research for improved formulations.
- Recombinant Hormones: This segment shows steady growth fueled by increasing demand for cost-effective hormonal therapies.
- Immunomodulators: This segment exhibits significant growth potential driven by the escalating prevalence of autoimmune diseases. Increased accessibility and lower costs are key drivers.
- Anti-Inflammatory Agents: This segment holds substantial market share due to the widespread use of anti-inflammatory drugs.
- Other Product Classes: This segment includes a diverse range of biosimilars, reflecting the growing scope of biosimilar development.
By Application:
- Oncology: The oncology segment is the largest application area, benefiting from the high prevalence of cancer and the high cost of cancer biologics.
- Chronic and Autoimmune Disorders: This segment demonstrates consistent growth owing to the increasing prevalence of chronic diseases such as rheumatoid arthritis, psoriasis, and Crohn’s disease.
- Blood Disorders: The blood disorder segment is also seeing significant adoption owing to the high cost of treatment and the potential of biosimilars to improve affordability.
- Growth Hormonal Deficiency: This segment demonstrates stable growth driven by ongoing demand for effective and accessible growth hormone replacement therapies.
- Other Applications: This segment encompasses a variety of therapeutic areas where biosimilars are gaining traction.
Growth drivers for these regions include factors such as robust healthcare infrastructure, increasing healthcare expenditure, and supportive government policies. The dominance of North America is attributed to high biosimilar adoption rates and a relatively established regulatory framework.
Biosimilars Market Product Developments
Recent advancements in biosimilar technology focus on improving product efficacy, safety, and manufacturing processes. The development of novel biosimilar formats, such as long-acting formulations and improved delivery systems, is gaining traction. This enhances patient compliance and improves therapeutic outcomes, giving companies a competitive edge. These advancements have led to the approval of several innovative biosimilars across various therapeutic areas, further driving market expansion.
Challenges in the Biosimilars Market Market
The biosimilars market faces several challenges including stringent regulatory approvals that require extensive clinical trials, complex biosimilarity assessments, and significant upfront investment in R&D. Supply chain disruptions can impact market stability, particularly during peak demand. Intense competition from originator biologics and other biosimilars necessitates a strong differentiation strategy. The impact of these challenges on market growth is estimated at approximately xx% reduction in overall market penetration.
Forces Driving Biosimilars Market Growth
Several factors contribute to the biosimilars market's growth. These include the increasing prevalence of chronic diseases, growing healthcare expenditure, and the rising demand for cost-effective treatment options. Favorable regulatory landscapes in several countries are accelerating market entry for biosimilars. Technological advancements in biomanufacturing and analytical techniques are also improving the quality and consistency of biosimilars. For example, the FDA's approval of several biosimilars highlights the growing acceptance and adoption of these products.
Long-Term Growth Catalysts in Biosimilars Market
Long-term growth will be driven by continuous innovation in biosimilar technology, leading to the development of more effective and safer products. Strategic partnerships between biosimilar manufacturers and global pharmaceutical companies will expand market reach and accelerate product development. The expansion into emerging markets with high unmet needs presents substantial growth opportunities.
Emerging Opportunities in Biosimilars Market
Emerging opportunities include the development of biosimilars for complex biologics, such as those targeting novel therapeutic targets or requiring advanced manufacturing technologies. The penetration of biosimilars into emerging markets, particularly in Asia and Latin America, offers significant growth potential. The increasing adoption of value-based healthcare models that prioritize cost-effectiveness favors biosimilar adoption.
Leading Players in the Biosimilars Market Sector
- Viatris Inc (Mylan)
- Novartis AG
- Amgen Inc
- Dr Reddy's Laboratories
- Intas Pharmaceutical Ltd
- Coherus Biosciences Inc
- Samsung Bioepis Co Ltd
- Eli Lilly and Company
- LG Life Sciences (LG Chem)
- Biocad
- Teva Pharmaceutical Industries Ltd
- Celltrion Healthcare
- Stada Arzneimittel AG
- Biocon Limited
- Pfizer Inc
Key Milestones in Biosimilars Market Industry
- May 2022: Amneal Pharmaceuticals received FDA approval for FYLNETRA (pegfilgrastim-pbbk), a biosimilar referencing Neulasta.
- September 2021: Samsung Bioepis and Biogen announced FDA approval of BYOOVIZ (ranibizumab-nuna), the first ophthalmology biosimilar approved in the US.
Strategic Outlook for Biosimilars Market Market
The biosimilars market presents a significant growth opportunity. Strategic partnerships, focused R&D efforts on complex biologics, and expansion into new markets will be key to maximizing market penetration. The long-term outlook is positive, with the potential for substantial market expansion driven by factors such as technological advancements, increasing demand for affordable healthcare, and supportive regulatory environments.
Biosimilars Market Segmentation
-
1. Product Class
- 1.1. Monoclonal Antibodies
- 1.2. Recombinant Hormones
- 1.3. Immunomodulators
- 1.4. Anti-Inflammatory Agents
- 1.5. Other Product Classes
-
2. Application
- 2.1. Blood Disorders
- 2.2. Growth Hormonal Deficiency
- 2.3. Chronic and Autoimmune Disorders
- 2.4. Oncology
- 2.5. Other Applications
Biosimilars Market Segmentation By Geography
-
1. North America
- 1.1. United States
- 1.2. Canada
- 1.3. Mexico
-
2. Europe
- 2.1. Germany
- 2.2. United Kingdom
- 2.3. France
- 2.4. Italy
- 2.5. Spain
- 2.6. Rest of Europe
-
3. Asia Pacific
- 3.1. China
- 3.2. Japan
- 3.3. India
- 3.4. Australia
- 3.5. South Korea
- 3.6. Rest of Asia Pacific
-
4. Middle East and Africa
- 4.1. GCC
- 4.2. South Africa
- 4.3. Rest of Middle East and Africa
-
5. South America
- 5.1. Brazil
- 5.2. Argentina
- 5.3. Rest of South America
Biosimilars Market REPORT HIGHLIGHTS
| Aspects | Details |
|---|---|
| Study Period | 2019-2033 |
| Base Year | 2024 |
| Estimated Year | 2025 |
| Forecast Period | 2025-2033 |
| Historical Period | 2019-2024 |
| Growth Rate | CAGR of 18.32% from 2019-2033 |
| Segmentation |
|
Table of Contents
- 1. Introduction
- 1.1. Research Scope
- 1.2. Market Segmentation
- 1.3. Research Methodology
- 1.4. Definitions and Assumptions
- 2. Executive Summary
- 2.1. Introduction
- 3. Market Dynamics
- 3.1. Introduction
- 3.2. Market Drivers
- 3.2.1. Several Blockbuster Biopharmaceuticals Going Off-patent over the Next Five to Ten Years; Growing Burden of Chronic Diseases and Increasing R&D Investments; Increasing Demand for Biosimilar Drugs Due to Their Cost Effectiveness
- 3.3. Market Restrains
- 3.3.1. Concerns Regarding Substitutability and Interchangeability; Regulatory Uncertainty and Growing Competition from Biobetters; High Cost Involvement and Complexities in Manufacturing
- 3.4. Market Trends
- 3.4.1. The Oncology Segment Holds the Major Share in the Global Biosimilars Industry
- 4. Market Factor Analysis
- 4.1. Porters Five Forces
- 4.2. Supply/Value Chain
- 4.3. PESTEL analysis
- 4.4. Market Entropy
- 4.5. Patent/Trademark Analysis
- 5. Global Biosimilars Market Analysis, Insights and Forecast, 2019-2031
- 5.1. Market Analysis, Insights and Forecast - by Product Class
- 5.1.1. Monoclonal Antibodies
- 5.1.2. Recombinant Hormones
- 5.1.3. Immunomodulators
- 5.1.4. Anti-Inflammatory Agents
- 5.1.5. Other Product Classes
- 5.2. Market Analysis, Insights and Forecast - by Application
- 5.2.1. Blood Disorders
- 5.2.2. Growth Hormonal Deficiency
- 5.2.3. Chronic and Autoimmune Disorders
- 5.2.4. Oncology
- 5.2.5. Other Applications
- 5.3. Market Analysis, Insights and Forecast - by Region
- 5.3.1. North America
- 5.3.2. Europe
- 5.3.3. Asia Pacific
- 5.3.4. Middle East and Africa
- 5.3.5. South America
- 5.1. Market Analysis, Insights and Forecast - by Product Class
- 6. North America Biosimilars Market Analysis, Insights and Forecast, 2019-2031
- 6.1. Market Analysis, Insights and Forecast - by Product Class
- 6.1.1. Monoclonal Antibodies
- 6.1.2. Recombinant Hormones
- 6.1.3. Immunomodulators
- 6.1.4. Anti-Inflammatory Agents
- 6.1.5. Other Product Classes
- 6.2. Market Analysis, Insights and Forecast - by Application
- 6.2.1. Blood Disorders
- 6.2.2. Growth Hormonal Deficiency
- 6.2.3. Chronic and Autoimmune Disorders
- 6.2.4. Oncology
- 6.2.5. Other Applications
- 6.1. Market Analysis, Insights and Forecast - by Product Class
- 7. Europe Biosimilars Market Analysis, Insights and Forecast, 2019-2031
- 7.1. Market Analysis, Insights and Forecast - by Product Class
- 7.1.1. Monoclonal Antibodies
- 7.1.2. Recombinant Hormones
- 7.1.3. Immunomodulators
- 7.1.4. Anti-Inflammatory Agents
- 7.1.5. Other Product Classes
- 7.2. Market Analysis, Insights and Forecast - by Application
- 7.2.1. Blood Disorders
- 7.2.2. Growth Hormonal Deficiency
- 7.2.3. Chronic and Autoimmune Disorders
- 7.2.4. Oncology
- 7.2.5. Other Applications
- 7.1. Market Analysis, Insights and Forecast - by Product Class
- 8. Asia Pacific Biosimilars Market Analysis, Insights and Forecast, 2019-2031
- 8.1. Market Analysis, Insights and Forecast - by Product Class
- 8.1.1. Monoclonal Antibodies
- 8.1.2. Recombinant Hormones
- 8.1.3. Immunomodulators
- 8.1.4. Anti-Inflammatory Agents
- 8.1.5. Other Product Classes
- 8.2. Market Analysis, Insights and Forecast - by Application
- 8.2.1. Blood Disorders
- 8.2.2. Growth Hormonal Deficiency
- 8.2.3. Chronic and Autoimmune Disorders
- 8.2.4. Oncology
- 8.2.5. Other Applications
- 8.1. Market Analysis, Insights and Forecast - by Product Class
- 9. Middle East and Africa Biosimilars Market Analysis, Insights and Forecast, 2019-2031
- 9.1. Market Analysis, Insights and Forecast - by Product Class
- 9.1.1. Monoclonal Antibodies
- 9.1.2. Recombinant Hormones
- 9.1.3. Immunomodulators
- 9.1.4. Anti-Inflammatory Agents
- 9.1.5. Other Product Classes
- 9.2. Market Analysis, Insights and Forecast - by Application
- 9.2.1. Blood Disorders
- 9.2.2. Growth Hormonal Deficiency
- 9.2.3. Chronic and Autoimmune Disorders
- 9.2.4. Oncology
- 9.2.5. Other Applications
- 9.1. Market Analysis, Insights and Forecast - by Product Class
- 10. South America Biosimilars Market Analysis, Insights and Forecast, 2019-2031
- 10.1. Market Analysis, Insights and Forecast - by Product Class
- 10.1.1. Monoclonal Antibodies
- 10.1.2. Recombinant Hormones
- 10.1.3. Immunomodulators
- 10.1.4. Anti-Inflammatory Agents
- 10.1.5. Other Product Classes
- 10.2. Market Analysis, Insights and Forecast - by Application
- 10.2.1. Blood Disorders
- 10.2.2. Growth Hormonal Deficiency
- 10.2.3. Chronic and Autoimmune Disorders
- 10.2.4. Oncology
- 10.2.5. Other Applications
- 10.1. Market Analysis, Insights and Forecast - by Product Class
- 11. North America Biosimilars Market Analysis, Insights and Forecast, 2019-2031
- 11.1. Market Analysis, Insights and Forecast - By Country/Sub-region
- 11.1.1 United States
- 11.1.2 Canada
- 11.1.3 Mexico
- 12. Europe Biosimilars Market Analysis, Insights and Forecast, 2019-2031
- 12.1. Market Analysis, Insights and Forecast - By Country/Sub-region
- 12.1.1 Germany
- 12.1.2 United Kingdom
- 12.1.3 France
- 12.1.4 Italy
- 12.1.5 Spain
- 12.1.6 Rest of Europe
- 13. Asia Pacific Biosimilars Market Analysis, Insights and Forecast, 2019-2031
- 13.1. Market Analysis, Insights and Forecast - By Country/Sub-region
- 13.1.1 China
- 13.1.2 Japan
- 13.1.3 India
- 13.1.4 Australia
- 13.1.5 South Korea
- 13.1.6 Rest of Asia Pacific
- 14. Middle East and Africa Biosimilars Market Analysis, Insights and Forecast, 2019-2031
- 14.1. Market Analysis, Insights and Forecast - By Country/Sub-region
- 14.1.1 GCC
- 14.1.2 South Africa
- 14.1.3 Rest of Middle East and Africa
- 15. South America Biosimilars Market Analysis, Insights and Forecast, 2019-2031
- 15.1. Market Analysis, Insights and Forecast - By Country/Sub-region
- 15.1.1 Brazil
- 15.1.2 Argentina
- 15.1.3 Rest of South America
- 16. Competitive Analysis
- 16.1. Global Market Share Analysis 2024
- 16.2. Company Profiles
- 16.2.1 Viatris Inc (Mylan)
- 16.2.1.1. Overview
- 16.2.1.2. Products
- 16.2.1.3. SWOT Analysis
- 16.2.1.4. Recent Developments
- 16.2.1.5. Financials (Based on Availability)
- 16.2.2 Novartis AG
- 16.2.2.1. Overview
- 16.2.2.2. Products
- 16.2.2.3. SWOT Analysis
- 16.2.2.4. Recent Developments
- 16.2.2.5. Financials (Based on Availability)
- 16.2.3 Amgen Inc
- 16.2.3.1. Overview
- 16.2.3.2. Products
- 16.2.3.3. SWOT Analysis
- 16.2.3.4. Recent Developments
- 16.2.3.5. Financials (Based on Availability)
- 16.2.4 Dr Reddy's Laboratories
- 16.2.4.1. Overview
- 16.2.4.2. Products
- 16.2.4.3. SWOT Analysis
- 16.2.4.4. Recent Developments
- 16.2.4.5. Financials (Based on Availability)
- 16.2.5 Intas Pharmaceutical Ltd
- 16.2.5.1. Overview
- 16.2.5.2. Products
- 16.2.5.3. SWOT Analysis
- 16.2.5.4. Recent Developments
- 16.2.5.5. Financials (Based on Availability)
- 16.2.6 Coherus Biosciences Inc
- 16.2.6.1. Overview
- 16.2.6.2. Products
- 16.2.6.3. SWOT Analysis
- 16.2.6.4. Recent Developments
- 16.2.6.5. Financials (Based on Availability)
- 16.2.7 Samsung Bioepis Co Ltd
- 16.2.7.1. Overview
- 16.2.7.2. Products
- 16.2.7.3. SWOT Analysis
- 16.2.7.4. Recent Developments
- 16.2.7.5. Financials (Based on Availability)
- 16.2.8 Eli Lilly and Company
- 16.2.8.1. Overview
- 16.2.8.2. Products
- 16.2.8.3. SWOT Analysis
- 16.2.8.4. Recent Developments
- 16.2.8.5. Financials (Based on Availability)
- 16.2.9 LG Life Sciences (LG Chem)
- 16.2.9.1. Overview
- 16.2.9.2. Products
- 16.2.9.3. SWOT Analysis
- 16.2.9.4. Recent Developments
- 16.2.9.5. Financials (Based on Availability)
- 16.2.10 Biocad
- 16.2.10.1. Overview
- 16.2.10.2. Products
- 16.2.10.3. SWOT Analysis
- 16.2.10.4. Recent Developments
- 16.2.10.5. Financials (Based on Availability)
- 16.2.11 Teva Pharmaceutical Industries Ltd
- 16.2.11.1. Overview
- 16.2.11.2. Products
- 16.2.11.3. SWOT Analysis
- 16.2.11.4. Recent Developments
- 16.2.11.5. Financials (Based on Availability)
- 16.2.12 Celltrion Healthcare
- 16.2.12.1. Overview
- 16.2.12.2. Products
- 16.2.12.3. SWOT Analysis
- 16.2.12.4. Recent Developments
- 16.2.12.5. Financials (Based on Availability)
- 16.2.13 Stada Arzneimittel AG
- 16.2.13.1. Overview
- 16.2.13.2. Products
- 16.2.13.3. SWOT Analysis
- 16.2.13.4. Recent Developments
- 16.2.13.5. Financials (Based on Availability)
- 16.2.14 Biocon Limited
- 16.2.14.1. Overview
- 16.2.14.2. Products
- 16.2.14.3. SWOT Analysis
- 16.2.14.4. Recent Developments
- 16.2.14.5. Financials (Based on Availability)
- 16.2.15 Pfizer Inc
- 16.2.15.1. Overview
- 16.2.15.2. Products
- 16.2.15.3. SWOT Analysis
- 16.2.15.4. Recent Developments
- 16.2.15.5. Financials (Based on Availability)
- 16.2.1 Viatris Inc (Mylan)
List of Figures
- Figure 1: Global Biosimilars Market Revenue Breakdown (Million, %) by Region 2024 & 2032
- Figure 2: Global Biosimilars Market Volume Breakdown (K Unit, %) by Region 2024 & 2032
- Figure 3: North America Biosimilars Market Revenue (Million), by Country 2024 & 2032
- Figure 4: North America Biosimilars Market Volume (K Unit), by Country 2024 & 2032
- Figure 5: North America Biosimilars Market Revenue Share (%), by Country 2024 & 2032
- Figure 6: North America Biosimilars Market Volume Share (%), by Country 2024 & 2032
- Figure 7: Europe Biosimilars Market Revenue (Million), by Country 2024 & 2032
- Figure 8: Europe Biosimilars Market Volume (K Unit), by Country 2024 & 2032
- Figure 9: Europe Biosimilars Market Revenue Share (%), by Country 2024 & 2032
- Figure 10: Europe Biosimilars Market Volume Share (%), by Country 2024 & 2032
- Figure 11: Asia Pacific Biosimilars Market Revenue (Million), by Country 2024 & 2032
- Figure 12: Asia Pacific Biosimilars Market Volume (K Unit), by Country 2024 & 2032
- Figure 13: Asia Pacific Biosimilars Market Revenue Share (%), by Country 2024 & 2032
- Figure 14: Asia Pacific Biosimilars Market Volume Share (%), by Country 2024 & 2032
- Figure 15: Middle East and Africa Biosimilars Market Revenue (Million), by Country 2024 & 2032
- Figure 16: Middle East and Africa Biosimilars Market Volume (K Unit), by Country 2024 & 2032
- Figure 17: Middle East and Africa Biosimilars Market Revenue Share (%), by Country 2024 & 2032
- Figure 18: Middle East and Africa Biosimilars Market Volume Share (%), by Country 2024 & 2032
- Figure 19: South America Biosimilars Market Revenue (Million), by Country 2024 & 2032
- Figure 20: South America Biosimilars Market Volume (K Unit), by Country 2024 & 2032
- Figure 21: South America Biosimilars Market Revenue Share (%), by Country 2024 & 2032
- Figure 22: South America Biosimilars Market Volume Share (%), by Country 2024 & 2032
- Figure 23: North America Biosimilars Market Revenue (Million), by Product Class 2024 & 2032
- Figure 24: North America Biosimilars Market Volume (K Unit), by Product Class 2024 & 2032
- Figure 25: North America Biosimilars Market Revenue Share (%), by Product Class 2024 & 2032
- Figure 26: North America Biosimilars Market Volume Share (%), by Product Class 2024 & 2032
- Figure 27: North America Biosimilars Market Revenue (Million), by Application 2024 & 2032
- Figure 28: North America Biosimilars Market Volume (K Unit), by Application 2024 & 2032
- Figure 29: North America Biosimilars Market Revenue Share (%), by Application 2024 & 2032
- Figure 30: North America Biosimilars Market Volume Share (%), by Application 2024 & 2032
- Figure 31: North America Biosimilars Market Revenue (Million), by Country 2024 & 2032
- Figure 32: North America Biosimilars Market Volume (K Unit), by Country 2024 & 2032
- Figure 33: North America Biosimilars Market Revenue Share (%), by Country 2024 & 2032
- Figure 34: North America Biosimilars Market Volume Share (%), by Country 2024 & 2032
- Figure 35: Europe Biosimilars Market Revenue (Million), by Product Class 2024 & 2032
- Figure 36: Europe Biosimilars Market Volume (K Unit), by Product Class 2024 & 2032
- Figure 37: Europe Biosimilars Market Revenue Share (%), by Product Class 2024 & 2032
- Figure 38: Europe Biosimilars Market Volume Share (%), by Product Class 2024 & 2032
- Figure 39: Europe Biosimilars Market Revenue (Million), by Application 2024 & 2032
- Figure 40: Europe Biosimilars Market Volume (K Unit), by Application 2024 & 2032
- Figure 41: Europe Biosimilars Market Revenue Share (%), by Application 2024 & 2032
- Figure 42: Europe Biosimilars Market Volume Share (%), by Application 2024 & 2032
- Figure 43: Europe Biosimilars Market Revenue (Million), by Country 2024 & 2032
- Figure 44: Europe Biosimilars Market Volume (K Unit), by Country 2024 & 2032
- Figure 45: Europe Biosimilars Market Revenue Share (%), by Country 2024 & 2032
- Figure 46: Europe Biosimilars Market Volume Share (%), by Country 2024 & 2032
- Figure 47: Asia Pacific Biosimilars Market Revenue (Million), by Product Class 2024 & 2032
- Figure 48: Asia Pacific Biosimilars Market Volume (K Unit), by Product Class 2024 & 2032
- Figure 49: Asia Pacific Biosimilars Market Revenue Share (%), by Product Class 2024 & 2032
- Figure 50: Asia Pacific Biosimilars Market Volume Share (%), by Product Class 2024 & 2032
- Figure 51: Asia Pacific Biosimilars Market Revenue (Million), by Application 2024 & 2032
- Figure 52: Asia Pacific Biosimilars Market Volume (K Unit), by Application 2024 & 2032
- Figure 53: Asia Pacific Biosimilars Market Revenue Share (%), by Application 2024 & 2032
- Figure 54: Asia Pacific Biosimilars Market Volume Share (%), by Application 2024 & 2032
- Figure 55: Asia Pacific Biosimilars Market Revenue (Million), by Country 2024 & 2032
- Figure 56: Asia Pacific Biosimilars Market Volume (K Unit), by Country 2024 & 2032
- Figure 57: Asia Pacific Biosimilars Market Revenue Share (%), by Country 2024 & 2032
- Figure 58: Asia Pacific Biosimilars Market Volume Share (%), by Country 2024 & 2032
- Figure 59: Middle East and Africa Biosimilars Market Revenue (Million), by Product Class 2024 & 2032
- Figure 60: Middle East and Africa Biosimilars Market Volume (K Unit), by Product Class 2024 & 2032
- Figure 61: Middle East and Africa Biosimilars Market Revenue Share (%), by Product Class 2024 & 2032
- Figure 62: Middle East and Africa Biosimilars Market Volume Share (%), by Product Class 2024 & 2032
- Figure 63: Middle East and Africa Biosimilars Market Revenue (Million), by Application 2024 & 2032
- Figure 64: Middle East and Africa Biosimilars Market Volume (K Unit), by Application 2024 & 2032
- Figure 65: Middle East and Africa Biosimilars Market Revenue Share (%), by Application 2024 & 2032
- Figure 66: Middle East and Africa Biosimilars Market Volume Share (%), by Application 2024 & 2032
- Figure 67: Middle East and Africa Biosimilars Market Revenue (Million), by Country 2024 & 2032
- Figure 68: Middle East and Africa Biosimilars Market Volume (K Unit), by Country 2024 & 2032
- Figure 69: Middle East and Africa Biosimilars Market Revenue Share (%), by Country 2024 & 2032
- Figure 70: Middle East and Africa Biosimilars Market Volume Share (%), by Country 2024 & 2032
- Figure 71: South America Biosimilars Market Revenue (Million), by Product Class 2024 & 2032
- Figure 72: South America Biosimilars Market Volume (K Unit), by Product Class 2024 & 2032
- Figure 73: South America Biosimilars Market Revenue Share (%), by Product Class 2024 & 2032
- Figure 74: South America Biosimilars Market Volume Share (%), by Product Class 2024 & 2032
- Figure 75: South America Biosimilars Market Revenue (Million), by Application 2024 & 2032
- Figure 76: South America Biosimilars Market Volume (K Unit), by Application 2024 & 2032
- Figure 77: South America Biosimilars Market Revenue Share (%), by Application 2024 & 2032
- Figure 78: South America Biosimilars Market Volume Share (%), by Application 2024 & 2032
- Figure 79: South America Biosimilars Market Revenue (Million), by Country 2024 & 2032
- Figure 80: South America Biosimilars Market Volume (K Unit), by Country 2024 & 2032
- Figure 81: South America Biosimilars Market Revenue Share (%), by Country 2024 & 2032
- Figure 82: South America Biosimilars Market Volume Share (%), by Country 2024 & 2032
List of Tables
- Table 1: Global Biosimilars Market Revenue Million Forecast, by Region 2019 & 2032
- Table 2: Global Biosimilars Market Volume K Unit Forecast, by Region 2019 & 2032
- Table 3: Global Biosimilars Market Revenue Million Forecast, by Product Class 2019 & 2032
- Table 4: Global Biosimilars Market Volume K Unit Forecast, by Product Class 2019 & 2032
- Table 5: Global Biosimilars Market Revenue Million Forecast, by Application 2019 & 2032
- Table 6: Global Biosimilars Market Volume K Unit Forecast, by Application 2019 & 2032
- Table 7: Global Biosimilars Market Revenue Million Forecast, by Region 2019 & 2032
- Table 8: Global Biosimilars Market Volume K Unit Forecast, by Region 2019 & 2032
- Table 9: Global Biosimilars Market Revenue Million Forecast, by Country 2019 & 2032
- Table 10: Global Biosimilars Market Volume K Unit Forecast, by Country 2019 & 2032
- Table 11: United States Biosimilars Market Revenue (Million) Forecast, by Application 2019 & 2032
- Table 12: United States Biosimilars Market Volume (K Unit) Forecast, by Application 2019 & 2032
- Table 13: Canada Biosimilars Market Revenue (Million) Forecast, by Application 2019 & 2032
- Table 14: Canada Biosimilars Market Volume (K Unit) Forecast, by Application 2019 & 2032
- Table 15: Mexico Biosimilars Market Revenue (Million) Forecast, by Application 2019 & 2032
- Table 16: Mexico Biosimilars Market Volume (K Unit) Forecast, by Application 2019 & 2032
- Table 17: Global Biosimilars Market Revenue Million Forecast, by Country 2019 & 2032
- Table 18: Global Biosimilars Market Volume K Unit Forecast, by Country 2019 & 2032
- Table 19: Germany Biosimilars Market Revenue (Million) Forecast, by Application 2019 & 2032
- Table 20: Germany Biosimilars Market Volume (K Unit) Forecast, by Application 2019 & 2032
- Table 21: United Kingdom Biosimilars Market Revenue (Million) Forecast, by Application 2019 & 2032
- Table 22: United Kingdom Biosimilars Market Volume (K Unit) Forecast, by Application 2019 & 2032
- Table 23: France Biosimilars Market Revenue (Million) Forecast, by Application 2019 & 2032
- Table 24: France Biosimilars Market Volume (K Unit) Forecast, by Application 2019 & 2032
- Table 25: Italy Biosimilars Market Revenue (Million) Forecast, by Application 2019 & 2032
- Table 26: Italy Biosimilars Market Volume (K Unit) Forecast, by Application 2019 & 2032
- Table 27: Spain Biosimilars Market Revenue (Million) Forecast, by Application 2019 & 2032
- Table 28: Spain Biosimilars Market Volume (K Unit) Forecast, by Application 2019 & 2032
- Table 29: Rest of Europe Biosimilars Market Revenue (Million) Forecast, by Application 2019 & 2032
- Table 30: Rest of Europe Biosimilars Market Volume (K Unit) Forecast, by Application 2019 & 2032
- Table 31: Global Biosimilars Market Revenue Million Forecast, by Country 2019 & 2032
- Table 32: Global Biosimilars Market Volume K Unit Forecast, by Country 2019 & 2032
- Table 33: China Biosimilars Market Revenue (Million) Forecast, by Application 2019 & 2032
- Table 34: China Biosimilars Market Volume (K Unit) Forecast, by Application 2019 & 2032
- Table 35: Japan Biosimilars Market Revenue (Million) Forecast, by Application 2019 & 2032
- Table 36: Japan Biosimilars Market Volume (K Unit) Forecast, by Application 2019 & 2032
- Table 37: India Biosimilars Market Revenue (Million) Forecast, by Application 2019 & 2032
- Table 38: India Biosimilars Market Volume (K Unit) Forecast, by Application 2019 & 2032
- Table 39: Australia Biosimilars Market Revenue (Million) Forecast, by Application 2019 & 2032
- Table 40: Australia Biosimilars Market Volume (K Unit) Forecast, by Application 2019 & 2032
- Table 41: South Korea Biosimilars Market Revenue (Million) Forecast, by Application 2019 & 2032
- Table 42: South Korea Biosimilars Market Volume (K Unit) Forecast, by Application 2019 & 2032
- Table 43: Rest of Asia Pacific Biosimilars Market Revenue (Million) Forecast, by Application 2019 & 2032
- Table 44: Rest of Asia Pacific Biosimilars Market Volume (K Unit) Forecast, by Application 2019 & 2032
- Table 45: Global Biosimilars Market Revenue Million Forecast, by Country 2019 & 2032
- Table 46: Global Biosimilars Market Volume K Unit Forecast, by Country 2019 & 2032
- Table 47: GCC Biosimilars Market Revenue (Million) Forecast, by Application 2019 & 2032
- Table 48: GCC Biosimilars Market Volume (K Unit) Forecast, by Application 2019 & 2032
- Table 49: South Africa Biosimilars Market Revenue (Million) Forecast, by Application 2019 & 2032
- Table 50: South Africa Biosimilars Market Volume (K Unit) Forecast, by Application 2019 & 2032
- Table 51: Rest of Middle East and Africa Biosimilars Market Revenue (Million) Forecast, by Application 2019 & 2032
- Table 52: Rest of Middle East and Africa Biosimilars Market Volume (K Unit) Forecast, by Application 2019 & 2032
- Table 53: Global Biosimilars Market Revenue Million Forecast, by Country 2019 & 2032
- Table 54: Global Biosimilars Market Volume K Unit Forecast, by Country 2019 & 2032
- Table 55: Brazil Biosimilars Market Revenue (Million) Forecast, by Application 2019 & 2032
- Table 56: Brazil Biosimilars Market Volume (K Unit) Forecast, by Application 2019 & 2032
- Table 57: Argentina Biosimilars Market Revenue (Million) Forecast, by Application 2019 & 2032
- Table 58: Argentina Biosimilars Market Volume (K Unit) Forecast, by Application 2019 & 2032
- Table 59: Rest of South America Biosimilars Market Revenue (Million) Forecast, by Application 2019 & 2032
- Table 60: Rest of South America Biosimilars Market Volume (K Unit) Forecast, by Application 2019 & 2032
- Table 61: Global Biosimilars Market Revenue Million Forecast, by Product Class 2019 & 2032
- Table 62: Global Biosimilars Market Volume K Unit Forecast, by Product Class 2019 & 2032
- Table 63: Global Biosimilars Market Revenue Million Forecast, by Application 2019 & 2032
- Table 64: Global Biosimilars Market Volume K Unit Forecast, by Application 2019 & 2032
- Table 65: Global Biosimilars Market Revenue Million Forecast, by Country 2019 & 2032
- Table 66: Global Biosimilars Market Volume K Unit Forecast, by Country 2019 & 2032
- Table 67: United States Biosimilars Market Revenue (Million) Forecast, by Application 2019 & 2032
- Table 68: United States Biosimilars Market Volume (K Unit) Forecast, by Application 2019 & 2032
- Table 69: Canada Biosimilars Market Revenue (Million) Forecast, by Application 2019 & 2032
- Table 70: Canada Biosimilars Market Volume (K Unit) Forecast, by Application 2019 & 2032
- Table 71: Mexico Biosimilars Market Revenue (Million) Forecast, by Application 2019 & 2032
- Table 72: Mexico Biosimilars Market Volume (K Unit) Forecast, by Application 2019 & 2032
- Table 73: Global Biosimilars Market Revenue Million Forecast, by Product Class 2019 & 2032
- Table 74: Global Biosimilars Market Volume K Unit Forecast, by Product Class 2019 & 2032
- Table 75: Global Biosimilars Market Revenue Million Forecast, by Application 2019 & 2032
- Table 76: Global Biosimilars Market Volume K Unit Forecast, by Application 2019 & 2032
- Table 77: Global Biosimilars Market Revenue Million Forecast, by Country 2019 & 2032
- Table 78: Global Biosimilars Market Volume K Unit Forecast, by Country 2019 & 2032
- Table 79: Germany Biosimilars Market Revenue (Million) Forecast, by Application 2019 & 2032
- Table 80: Germany Biosimilars Market Volume (K Unit) Forecast, by Application 2019 & 2032
- Table 81: United Kingdom Biosimilars Market Revenue (Million) Forecast, by Application 2019 & 2032
- Table 82: United Kingdom Biosimilars Market Volume (K Unit) Forecast, by Application 2019 & 2032
- Table 83: France Biosimilars Market Revenue (Million) Forecast, by Application 2019 & 2032
- Table 84: France Biosimilars Market Volume (K Unit) Forecast, by Application 2019 & 2032
- Table 85: Italy Biosimilars Market Revenue (Million) Forecast, by Application 2019 & 2032
- Table 86: Italy Biosimilars Market Volume (K Unit) Forecast, by Application 2019 & 2032
- Table 87: Spain Biosimilars Market Revenue (Million) Forecast, by Application 2019 & 2032
- Table 88: Spain Biosimilars Market Volume (K Unit) Forecast, by Application 2019 & 2032
- Table 89: Rest of Europe Biosimilars Market Revenue (Million) Forecast, by Application 2019 & 2032
- Table 90: Rest of Europe Biosimilars Market Volume (K Unit) Forecast, by Application 2019 & 2032
- Table 91: Global Biosimilars Market Revenue Million Forecast, by Product Class 2019 & 2032
- Table 92: Global Biosimilars Market Volume K Unit Forecast, by Product Class 2019 & 2032
- Table 93: Global Biosimilars Market Revenue Million Forecast, by Application 2019 & 2032
- Table 94: Global Biosimilars Market Volume K Unit Forecast, by Application 2019 & 2032
- Table 95: Global Biosimilars Market Revenue Million Forecast, by Country 2019 & 2032
- Table 96: Global Biosimilars Market Volume K Unit Forecast, by Country 2019 & 2032
- Table 97: China Biosimilars Market Revenue (Million) Forecast, by Application 2019 & 2032
- Table 98: China Biosimilars Market Volume (K Unit) Forecast, by Application 2019 & 2032
- Table 99: Japan Biosimilars Market Revenue (Million) Forecast, by Application 2019 & 2032
- Table 100: Japan Biosimilars Market Volume (K Unit) Forecast, by Application 2019 & 2032
- Table 101: India Biosimilars Market Revenue (Million) Forecast, by Application 2019 & 2032
- Table 102: India Biosimilars Market Volume (K Unit) Forecast, by Application 2019 & 2032
- Table 103: Australia Biosimilars Market Revenue (Million) Forecast, by Application 2019 & 2032
- Table 104: Australia Biosimilars Market Volume (K Unit) Forecast, by Application 2019 & 2032
- Table 105: South Korea Biosimilars Market Revenue (Million) Forecast, by Application 2019 & 2032
- Table 106: South Korea Biosimilars Market Volume (K Unit) Forecast, by Application 2019 & 2032
- Table 107: Rest of Asia Pacific Biosimilars Market Revenue (Million) Forecast, by Application 2019 & 2032
- Table 108: Rest of Asia Pacific Biosimilars Market Volume (K Unit) Forecast, by Application 2019 & 2032
- Table 109: Global Biosimilars Market Revenue Million Forecast, by Product Class 2019 & 2032
- Table 110: Global Biosimilars Market Volume K Unit Forecast, by Product Class 2019 & 2032
- Table 111: Global Biosimilars Market Revenue Million Forecast, by Application 2019 & 2032
- Table 112: Global Biosimilars Market Volume K Unit Forecast, by Application 2019 & 2032
- Table 113: Global Biosimilars Market Revenue Million Forecast, by Country 2019 & 2032
- Table 114: Global Biosimilars Market Volume K Unit Forecast, by Country 2019 & 2032
- Table 115: GCC Biosimilars Market Revenue (Million) Forecast, by Application 2019 & 2032
- Table 116: GCC Biosimilars Market Volume (K Unit) Forecast, by Application 2019 & 2032
- Table 117: South Africa Biosimilars Market Revenue (Million) Forecast, by Application 2019 & 2032
- Table 118: South Africa Biosimilars Market Volume (K Unit) Forecast, by Application 2019 & 2032
- Table 119: Rest of Middle East and Africa Biosimilars Market Revenue (Million) Forecast, by Application 2019 & 2032
- Table 120: Rest of Middle East and Africa Biosimilars Market Volume (K Unit) Forecast, by Application 2019 & 2032
- Table 121: Global Biosimilars Market Revenue Million Forecast, by Product Class 2019 & 2032
- Table 122: Global Biosimilars Market Volume K Unit Forecast, by Product Class 2019 & 2032
- Table 123: Global Biosimilars Market Revenue Million Forecast, by Application 2019 & 2032
- Table 124: Global Biosimilars Market Volume K Unit Forecast, by Application 2019 & 2032
- Table 125: Global Biosimilars Market Revenue Million Forecast, by Country 2019 & 2032
- Table 126: Global Biosimilars Market Volume K Unit Forecast, by Country 2019 & 2032
- Table 127: Brazil Biosimilars Market Revenue (Million) Forecast, by Application 2019 & 2032
- Table 128: Brazil Biosimilars Market Volume (K Unit) Forecast, by Application 2019 & 2032
- Table 129: Argentina Biosimilars Market Revenue (Million) Forecast, by Application 2019 & 2032
- Table 130: Argentina Biosimilars Market Volume (K Unit) Forecast, by Application 2019 & 2032
- Table 131: Rest of South America Biosimilars Market Revenue (Million) Forecast, by Application 2019 & 2032
- Table 132: Rest of South America Biosimilars Market Volume (K Unit) Forecast, by Application 2019 & 2032
Frequently Asked Questions
1. What is the projected Compound Annual Growth Rate (CAGR) of the Biosimilars Market?
The projected CAGR is approximately 18.32%.
2. Which companies are prominent players in the Biosimilars Market?
Key companies in the market include Viatris Inc (Mylan), Novartis AG, Amgen Inc, Dr Reddy's Laboratories, Intas Pharmaceutical Ltd, Coherus Biosciences Inc, Samsung Bioepis Co Ltd, Eli Lilly and Company, LG Life Sciences (LG Chem), Biocad, Teva Pharmaceutical Industries Ltd, Celltrion Healthcare, Stada Arzneimittel AG, Biocon Limited, Pfizer Inc.
3. What are the main segments of the Biosimilars Market?
The market segments include Product Class, Application.
4. Can you provide details about the market size?
The market size is estimated to be USD 35.47 Million as of 2022.
5. What are some drivers contributing to market growth?
Several Blockbuster Biopharmaceuticals Going Off-patent over the Next Five to Ten Years; Growing Burden of Chronic Diseases and Increasing R&D Investments; Increasing Demand for Biosimilar Drugs Due to Their Cost Effectiveness.
6. What are the notable trends driving market growth?
The Oncology Segment Holds the Major Share in the Global Biosimilars Industry.
7. Are there any restraints impacting market growth?
Concerns Regarding Substitutability and Interchangeability; Regulatory Uncertainty and Growing Competition from Biobetters; High Cost Involvement and Complexities in Manufacturing.
8. Can you provide examples of recent developments in the market?
In May 2022, Amneal Pharmaceuticals, Inc. received United States Food and Drug Administration ("FDA") approval for a Biologics License Application ("BLA") for pegfilgrastim-pbbk, a biosimilar referencing Neulasta. The product will be marketed under the proprietary name FYLNETRA.
9. What pricing options are available for accessing the report?
Pricing options include single-user, multi-user, and enterprise licenses priced at USD 4750, USD 5250, and USD 8750 respectively.
10. Is the market size provided in terms of value or volume?
The market size is provided in terms of value, measured in Million and volume, measured in K Unit.
11. Are there any specific market keywords associated with the report?
Yes, the market keyword associated with the report is "Biosimilars Market," which aids in identifying and referencing the specific market segment covered.
12. How do I determine which pricing option suits my needs best?
The pricing options vary based on user requirements and access needs. Individual users may opt for single-user licenses, while businesses requiring broader access may choose multi-user or enterprise licenses for cost-effective access to the report.
13. Are there any additional resources or data provided in the Biosimilars Market report?
While the report offers comprehensive insights, it's advisable to review the specific contents or supplementary materials provided to ascertain if additional resources or data are available.
14. How can I stay updated on further developments or reports in the Biosimilars Market?
To stay informed about further developments, trends, and reports in the Biosimilars Market, consider subscribing to industry newsletters, following relevant companies and organizations, or regularly checking reputable industry news sources and publications.
Methodology
Step 1 - Identification of Relevant Samples Size from Population Database


Step 2 - Approaches for Defining Global Market Size (Value, Volume* & Price*)

Note*: In applicable scenarios
Step 3 - Data Sources
Primary Research
- Web Analytics
- Survey Reports
- Research Institute
- Latest Research Reports
- Opinion Leaders
Secondary Research
- Annual Reports
- White Paper
- Latest Press Release
- Industry Association
- Paid Database
- Investor Presentations

Step 4 - Data Triangulation
Involves using different sources of information in order to increase the validity of a study
These sources are likely to be stakeholders in a program - participants, other researchers, program staff, other community members, and so on.
Then we put all data in single framework & apply various statistical tools to find out the dynamic on the market.
During the analysis stage, feedback from the stakeholder groups would be compared to determine areas of agreement as well as areas of divergence
