

Key Insights
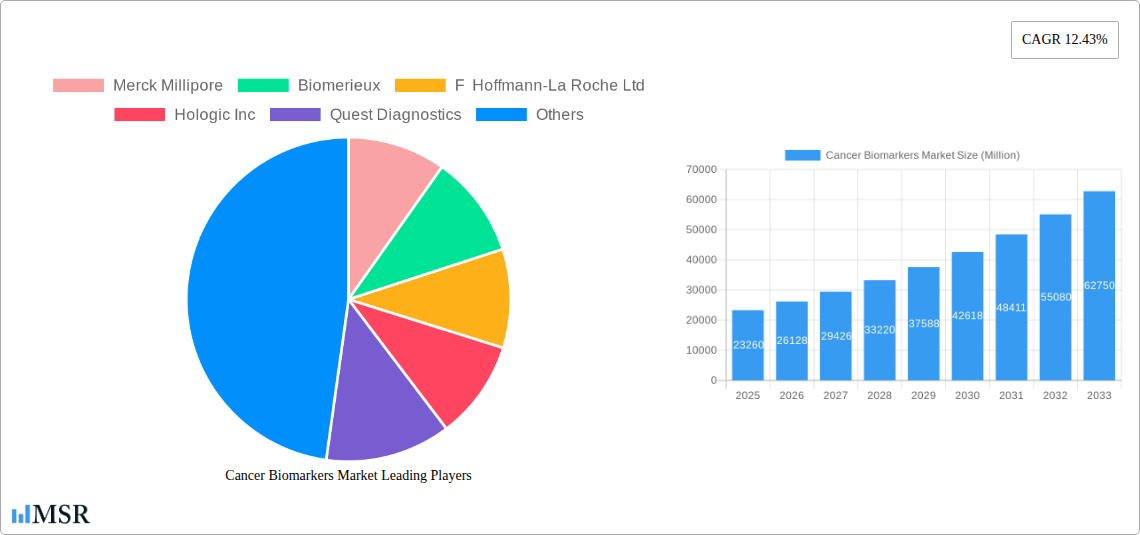
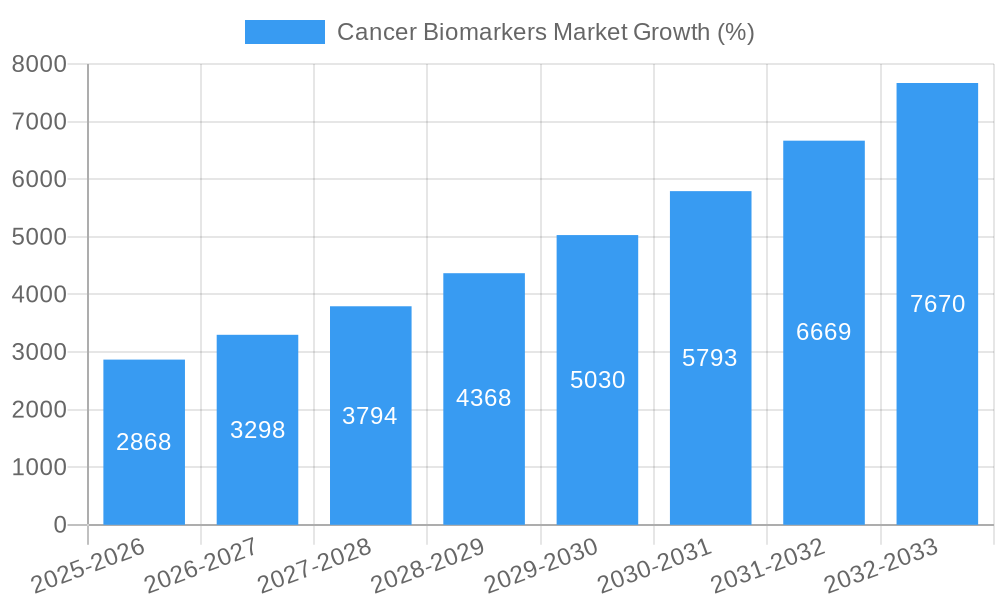
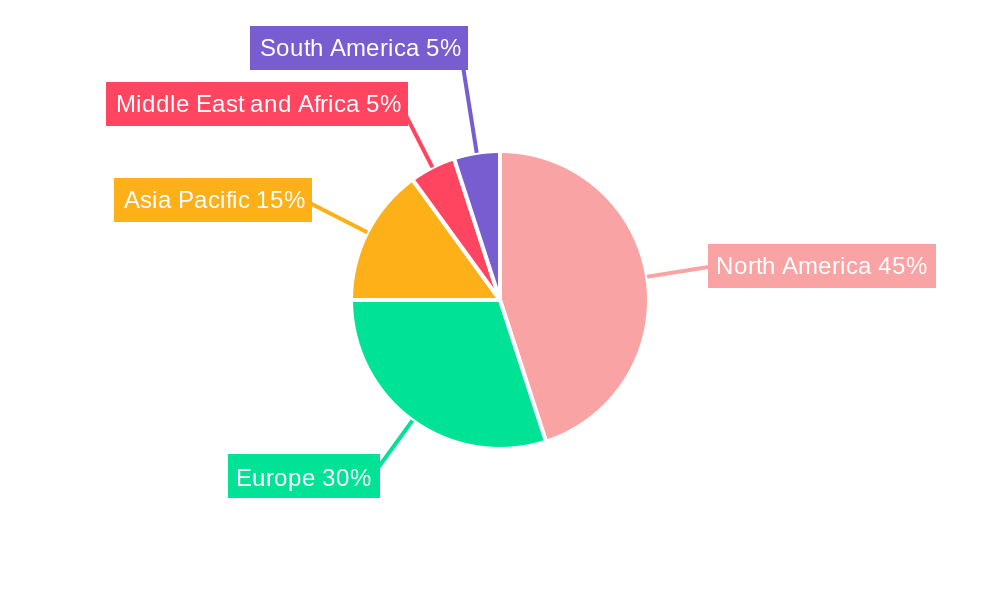
The global cancer biomarkers market, valued at $23.26 billion in 2025, is projected to experience robust growth, driven by the increasing prevalence of cancer globally, advancements in diagnostic technologies, and the rising demand for personalized medicine. The market's Compound Annual Growth Rate (CAGR) of 12.43% from 2025 to 2033 indicates significant expansion. Key drivers include the development of more sensitive and specific biomarkers for early cancer detection, improved treatment efficacy through targeted therapies, and the increasing adoption of OMICS technologies (genomics, proteomics, etc.) for biomarker discovery and profiling. The market segmentation reveals strong growth across various cancer types, with prostate, breast, lung, and colorectal cancers driving significant demand for biomarkers. Protein biomarkers currently hold a substantial market share, but genetic biomarkers are experiencing rapid growth, fueled by ongoing research and technological advancements in next-generation sequencing. Different profiling technologies are employed, with OMICS and immunoassays holding considerable market share, reflecting the diverse approaches used in biomarker detection and analysis. The North American market currently dominates, driven by advanced healthcare infrastructure and robust research funding, but Asia-Pacific is expected to show significant growth in the forecast period due to increasing healthcare expenditure and rising cancer incidence.
Leading players like Merck Millipore, Biomerieux, Roche, Hologic, and Qiagen are actively involved in developing and commercializing cancer biomarkers, further fueling market expansion. However, high development costs, regulatory hurdles, and the complexity of biomarker validation present challenges to market growth. Despite these restraints, the long-term outlook for the cancer biomarkers market remains exceptionally positive, fueled by the continuous need for improved early detection, diagnosis, and personalized treatment strategies in oncology. The market is expected to see further consolidation as companies strategically invest in research and development, partnerships, and acquisitions. The focus on liquid biopsies and minimally invasive diagnostic techniques is expected to further shape the market in the coming years, offering patients less invasive and more comfortable diagnostic options.
Cancer Biomarkers Market: A Comprehensive Report (2019-2033)
This comprehensive report provides an in-depth analysis of the Cancer Biomarkers Market, offering invaluable insights for industry stakeholders, investors, and researchers. Covering the period from 2019 to 2033, with a base year of 2025 and a forecast period of 2025-2033, this report meticulously examines market dynamics, trends, and future prospects. Key segments analyzed include By Disease (Prostate, Breast, Lung, Colorectal, Cervical, and Other Cancers), By Type (Protein, Genetic, and Other Biomarkers), and By Profiling Technology (OMICS, Imaging, Immunoassays, and Others). Leading players such as Merck Millipore, Biomerieux, F Hoffmann-La Roche Ltd, Hologic Inc, Quest Diagnostics, Qiagen, Thermo Fisher Scientific, Illumina Inc, Abbott Laboratories Inc, and Agilent Technologies are profiled, highlighting their market share and strategic initiatives. The global market size is predicted to reach xx Million by 2033, exhibiting a CAGR of xx%.
Cancer Biomarkers Market Concentration & Dynamics
The Cancer Biomarkers Market exhibits a moderately concentrated landscape, with a few large players holding significant market share. However, the presence of numerous smaller companies specializing in niche areas fosters innovation and competition. The market is characterized by a dynamic innovation ecosystem, fueled by ongoing research and development in advanced profiling technologies like OMICS and next-generation sequencing (NGS). Regulatory frameworks, particularly those concerning diagnostic approvals and data privacy, significantly influence market dynamics. Substitute products, such as traditional diagnostic methods, pose a competitive challenge, while evolving end-user trends toward personalized medicine drive market growth. Mergers and acquisitions (M&A) activities are frequent, reflecting industry consolidation and strategic expansion efforts. In the period 2019-2024, an estimated xx M&A deals occurred, with a predicted xx deals in the forecast period, leading to shifts in market share amongst key players.
- Market Share Concentration: Top 5 players hold approximately xx% of the market share (2024).
- Innovation Ecosystem: High R&D investment, focusing on novel biomarkers and advanced technologies.
- Regulatory Landscape: Stringent regulatory approvals needed for new biomarker tests.
- Substitute Products: Traditional diagnostic methods compete with biomarker-based tests.
- End-User Trends: Increasing demand for personalized medicine and early cancer detection.
- M&A Activity: Significant consolidation activity observed in recent years, with an estimated xx deals annually (2019-2024).
Cancer Biomarkers Market Industry Insights & Trends
The Cancer Biomarkers Market is experiencing robust growth, driven by several key factors. The rising prevalence of cancer globally, coupled with the increasing demand for early diagnosis and personalized treatment, is a major catalyst. Technological advancements in genomics, proteomics, and imaging technologies are enabling the development of more accurate and sensitive biomarker tests, further propelling market expansion. Changing consumer behavior, with increased awareness of cancer risk and proactive health management, contributes to the growing market demand. The market size was estimated at xx Million in 2024 and is projected to reach xx Million by 2033, representing a notable CAGR of xx%. Challenges include the high cost of biomarker testing and the complexity of biomarker validation and clinical interpretation. However, these challenges are being addressed through technological innovations and improved reimbursement policies.
Key Markets & Segments Leading Cancer Biomarkers Market
The North American region currently dominates the Cancer Biomarkers Market, driven by factors such as robust healthcare infrastructure, high adoption rates of advanced diagnostic technologies, and significant research funding. Within disease segments, prostate, breast, and lung cancers hold the largest shares due to their high prevalence and established biomarker testing landscapes. Protein biomarkers currently constitute the largest type segment, due to their relative maturity and established clinical utility. OMICS technology is the leading profiling technology segment due to its potential for high-throughput analysis and identification of novel biomarkers. However, Immunoassays and Imaging technologies show promising growth potential.
- Dominant Region: North America
- Dominant Disease Segment: Prostate, Breast, and Lung Cancer
- Dominant Biomarker Type: Protein Biomarkers
- Dominant Profiling Technology: OMICS Technology
Drivers for Regional Dominance (North America):
- Advanced Healthcare Infrastructure
- High Adoption of Advanced Technologies
- Robust Research and Development Funding
- Favorable Reimbursement Policies
Cancer Biomarkers Market Product Developments
Significant advancements in cancer biomarker technology have led to the introduction of novel tests with improved sensitivity, specificity, and turnaround time. For example, the OncoDEEP Solid Tumor Biomarker Test Kit (OncoDNA, February 2022) provides a comprehensive NGS solution, and the Oncuria immunoassay (Nonagen Bioscience, June 2022) offers a multiplex urine test for bladder cancer detection. These and other developments showcase the ongoing quest for more accurate, accessible, and cost-effective cancer diagnostics, driving the market's competitive landscape. The focus on liquid biopsies and minimally invasive sampling techniques further enhances the accessibility and patient compliance for biomarker testing.
Challenges in the Cancer Biomarkers Market Market
The Cancer Biomarkers Market faces several challenges, including the high cost of development and validation of new biomarker tests. Regulatory hurdles for obtaining approvals pose significant barriers to market entry. Supply chain disruptions, particularly concerning reagents and equipment, can impact the availability and cost of tests. Intense competition among established and emerging players requires continuous innovation and strategic partnerships to maintain a competitive edge. The lack of standardization in biomarker assays and the complexities associated with data interpretation present additional hurdles for widespread adoption. The reimbursement challenges for biomarker tests can further limit their accessibility, especially in resource-constrained settings.
Forces Driving Cancer Biomarkers Market Growth
Several factors are driving the growth of the Cancer Biomarkers Market, including the increasing prevalence of cancer and the ongoing advancements in biomarker discovery technologies like genomics and proteomics. Government initiatives aimed at improving cancer diagnosis and treatment also stimulate market expansion. The rising demand for personalized medicine, allowing targeted therapies based on individual patient profiles, is another key driver. Furthermore, increased investment in research and development is generating a pipeline of novel biomarker tests. The continuous technological advancements in NGS, improving speed, precision, and cost-effectiveness for biomarker profiling, are contributing significantly to this growth.
Long-Term Growth Catalysts in the Cancer Biomarkers Market
Long-term growth in the Cancer Biomarkers Market will be fueled by continued advancements in technologies like liquid biopsies and artificial intelligence (AI)-driven diagnostic tools that enhance the accuracy and efficiency of cancer detection. Strategic partnerships between pharmaceutical companies, diagnostic providers, and technology developers will create synergistic opportunities for innovation. Market expansion into emerging economies with increasing cancer prevalence and improving healthcare infrastructure will contribute to significant growth potential. The continued development of personalized cancer therapies tailored to specific biomarkers will sustain market growth for the foreseeable future.
Emerging Opportunities in Cancer Biomarkers Market
Emerging opportunities exist in the development of novel biomarkers for early cancer detection and monitoring of treatment response. The application of AI and machine learning for improved biomarker analysis and diagnostics offers substantial potential. Expanding into underserved markets and developing cost-effective testing solutions for resource-limited settings represents a crucial growth area. Developing combination biomarker tests that provide more comprehensive diagnostic information and better risk stratification is another major opportunity. The increasing utilization of point-of-care testing and remote diagnostics opens new avenues for market expansion.
Leading Players in the Cancer Biomarkers Market Sector
- Merck Millipore
- Biomerieux
- F Hoffmann-La Roche Ltd
- Hologic Inc
- Quest Diagnostics
- Qiagen
- Thermo Fisher Scientific
- Illumina Inc
- Abbott Laboratories Inc
- Agilent Technologies
Key Milestones in Cancer Biomarkers Market Industry
- February 2022: OncoDNA launched the OncoDEEP Solid Tumor Biomarker Test Kit, a comprehensive NGS solution leveraging Twist Bioscience's technology. This significantly enhanced the capabilities of labs conducting comprehensive tumor analysis.
- June 2022: Nonagen Bioscience received CE marking for its Oncuria immunoassay for bladder cancer, representing a significant advancement in early detection capabilities for this cancer type.
Strategic Outlook for Cancer Biomarkers Market Market
The Cancer Biomarkers Market holds immense future potential, driven by the converging trends of increasing cancer prevalence, technological advancements in diagnostics, and the growing demand for personalized medicine. Strategic opportunities lie in investing in R&D for novel biomarkers, leveraging AI for improved diagnostics, and expanding market reach through strategic partnerships and global collaborations. Companies focusing on developing cost-effective and accessible testing solutions will be well-positioned to capture significant market share. A focus on addressing the challenges in standardization and reimbursement policies will be crucial for sustainable growth.
Cancer Biomarkers Market Segmentation
-
1. Disease
- 1.1. Prostate Cancer
- 1.2. Breast Cancer
- 1.3. Lung Cancer
- 1.4. Colorectal Cancer
- 1.5. Cervical Cancer
- 1.6. Other Diseases
-
2. Type
- 2.1. Protein Biomarkers
- 2.2. Genetic Biomarkers
- 2.3. Other Types
-
3. Profiling Technology
- 3.1. OMICS Technology
- 3.2. Imaging Technology
- 3.3. Immunoassays
- 3.4. Others
Cancer Biomarkers Market Segmentation By Geography
-
1. North America
- 1.1. United States
- 1.2. Canada
- 1.3. Mexico
-
2. Europe
- 2.1. Germany
- 2.2. United Kingdom
- 2.3. France
- 2.4. Italy
- 2.5. Spain
- 2.6. Rest of Europe
-
3. Asia Pacific
- 3.1. China
- 3.2. Japan
- 3.3. India
- 3.4. Australia
- 3.5. South Korea
- 3.6. Rest of Asia Pacific
-
4. Middle East and Africa
- 4.1. GCC
- 4.2. South Africa
- 4.3. Rest of Middle East and Africa
-
5. South America
- 5.1. Brazil
- 5.2. Argentina
- 5.3. Rest of South America
Cancer Biomarkers Market REPORT HIGHLIGHTS
| Aspects | Details |
|---|---|
| Study Period | 2019-2033 |
| Base Year | 2024 |
| Estimated Year | 2025 |
| Forecast Period | 2025-2033 |
| Historical Period | 2019-2024 |
| Growth Rate | CAGR of 12.43% from 2019-2033 |
| Segmentation |
|
Table of Contents
- 1. Introduction
- 1.1. Research Scope
- 1.2. Market Segmentation
- 1.3. Research Methodology
- 1.4. Definitions and Assumptions
- 2. Executive Summary
- 2.1. Introduction
- 3. Market Dynamics
- 3.1. Introduction
- 3.2. Market Drivers
- 3.2.1. Surge in Prevalence of Cancer Across the Globe; Paradigm Shift in Healthcare from Disease Diagnosis to Risk Assessment or Early Diagnosis; Increasing Focus on Innovative Drug Development
- 3.3. Market Restrains
- 3.3.1. High Cost of Cancer Diagnosis with Biomarkers; Reimbursement Issues with Biomarker Testing
- 3.4. Market Trends
- 3.4.1. Lung Cancer Segment is Expected to Hold a Significant Market Share in the Cancer Biomarkers Market
- 4. Market Factor Analysis
- 4.1. Porters Five Forces
- 4.2. Supply/Value Chain
- 4.3. PESTEL analysis
- 4.4. Market Entropy
- 4.5. Patent/Trademark Analysis
- 5. Global Cancer Biomarkers Market Analysis, Insights and Forecast, 2019-2031
- 5.1. Market Analysis, Insights and Forecast - by Disease
- 5.1.1. Prostate Cancer
- 5.1.2. Breast Cancer
- 5.1.3. Lung Cancer
- 5.1.4. Colorectal Cancer
- 5.1.5. Cervical Cancer
- 5.1.6. Other Diseases
- 5.2. Market Analysis, Insights and Forecast - by Type
- 5.2.1. Protein Biomarkers
- 5.2.2. Genetic Biomarkers
- 5.2.3. Other Types
- 5.3. Market Analysis, Insights and Forecast - by Profiling Technology
- 5.3.1. OMICS Technology
- 5.3.2. Imaging Technology
- 5.3.3. Immunoassays
- 5.3.4. Others
- 5.4. Market Analysis, Insights and Forecast - by Region
- 5.4.1. North America
- 5.4.2. Europe
- 5.4.3. Asia Pacific
- 5.4.4. Middle East and Africa
- 5.4.5. South America
- 5.1. Market Analysis, Insights and Forecast - by Disease
- 6. North America Cancer Biomarkers Market Analysis, Insights and Forecast, 2019-2031
- 6.1. Market Analysis, Insights and Forecast - by Disease
- 6.1.1. Prostate Cancer
- 6.1.2. Breast Cancer
- 6.1.3. Lung Cancer
- 6.1.4. Colorectal Cancer
- 6.1.5. Cervical Cancer
- 6.1.6. Other Diseases
- 6.2. Market Analysis, Insights and Forecast - by Type
- 6.2.1. Protein Biomarkers
- 6.2.2. Genetic Biomarkers
- 6.2.3. Other Types
- 6.3. Market Analysis, Insights and Forecast - by Profiling Technology
- 6.3.1. OMICS Technology
- 6.3.2. Imaging Technology
- 6.3.3. Immunoassays
- 6.3.4. Others
- 6.1. Market Analysis, Insights and Forecast - by Disease
- 7. Europe Cancer Biomarkers Market Analysis, Insights and Forecast, 2019-2031
- 7.1. Market Analysis, Insights and Forecast - by Disease
- 7.1.1. Prostate Cancer
- 7.1.2. Breast Cancer
- 7.1.3. Lung Cancer
- 7.1.4. Colorectal Cancer
- 7.1.5. Cervical Cancer
- 7.1.6. Other Diseases
- 7.2. Market Analysis, Insights and Forecast - by Type
- 7.2.1. Protein Biomarkers
- 7.2.2. Genetic Biomarkers
- 7.2.3. Other Types
- 7.3. Market Analysis, Insights and Forecast - by Profiling Technology
- 7.3.1. OMICS Technology
- 7.3.2. Imaging Technology
- 7.3.3. Immunoassays
- 7.3.4. Others
- 7.1. Market Analysis, Insights and Forecast - by Disease
- 8. Asia Pacific Cancer Biomarkers Market Analysis, Insights and Forecast, 2019-2031
- 8.1. Market Analysis, Insights and Forecast - by Disease
- 8.1.1. Prostate Cancer
- 8.1.2. Breast Cancer
- 8.1.3. Lung Cancer
- 8.1.4. Colorectal Cancer
- 8.1.5. Cervical Cancer
- 8.1.6. Other Diseases
- 8.2. Market Analysis, Insights and Forecast - by Type
- 8.2.1. Protein Biomarkers
- 8.2.2. Genetic Biomarkers
- 8.2.3. Other Types
- 8.3. Market Analysis, Insights and Forecast - by Profiling Technology
- 8.3.1. OMICS Technology
- 8.3.2. Imaging Technology
- 8.3.3. Immunoassays
- 8.3.4. Others
- 8.1. Market Analysis, Insights and Forecast - by Disease
- 9. Middle East and Africa Cancer Biomarkers Market Analysis, Insights and Forecast, 2019-2031
- 9.1. Market Analysis, Insights and Forecast - by Disease
- 9.1.1. Prostate Cancer
- 9.1.2. Breast Cancer
- 9.1.3. Lung Cancer
- 9.1.4. Colorectal Cancer
- 9.1.5. Cervical Cancer
- 9.1.6. Other Diseases
- 9.2. Market Analysis, Insights and Forecast - by Type
- 9.2.1. Protein Biomarkers
- 9.2.2. Genetic Biomarkers
- 9.2.3. Other Types
- 9.3. Market Analysis, Insights and Forecast - by Profiling Technology
- 9.3.1. OMICS Technology
- 9.3.2. Imaging Technology
- 9.3.3. Immunoassays
- 9.3.4. Others
- 9.1. Market Analysis, Insights and Forecast - by Disease
- 10. South America Cancer Biomarkers Market Analysis, Insights and Forecast, 2019-2031
- 10.1. Market Analysis, Insights and Forecast - by Disease
- 10.1.1. Prostate Cancer
- 10.1.2. Breast Cancer
- 10.1.3. Lung Cancer
- 10.1.4. Colorectal Cancer
- 10.1.5. Cervical Cancer
- 10.1.6. Other Diseases
- 10.2. Market Analysis, Insights and Forecast - by Type
- 10.2.1. Protein Biomarkers
- 10.2.2. Genetic Biomarkers
- 10.2.3. Other Types
- 10.3. Market Analysis, Insights and Forecast - by Profiling Technology
- 10.3.1. OMICS Technology
- 10.3.2. Imaging Technology
- 10.3.3. Immunoassays
- 10.3.4. Others
- 10.1. Market Analysis, Insights and Forecast - by Disease
- 11. North America Cancer Biomarkers Market Analysis, Insights and Forecast, 2019-2031
- 11.1. Market Analysis, Insights and Forecast - By Country/Sub-region
- 11.1.1 United States
- 11.1.2 Canada
- 11.1.3 Mexico
- 12. Europe Cancer Biomarkers Market Analysis, Insights and Forecast, 2019-2031
- 12.1. Market Analysis, Insights and Forecast - By Country/Sub-region
- 12.1.1 Germany
- 12.1.2 United Kingdom
- 12.1.3 France
- 12.1.4 Italy
- 12.1.5 Spain
- 12.1.6 Rest of Europe
- 13. Asia Pacific Cancer Biomarkers Market Analysis, Insights and Forecast, 2019-2031
- 13.1. Market Analysis, Insights and Forecast - By Country/Sub-region
- 13.1.1 China
- 13.1.2 Japan
- 13.1.3 India
- 13.1.4 Australia
- 13.1.5 South Korea
- 13.1.6 Rest of Asia Pacific
- 14. Middle East and Africa Cancer Biomarkers Market Analysis, Insights and Forecast, 2019-2031
- 14.1. Market Analysis, Insights and Forecast - By Country/Sub-region
- 14.1.1 GCC
- 14.1.2 South Africa
- 14.1.3 Rest of Middle East and Africa
- 15. South America Cancer Biomarkers Market Analysis, Insights and Forecast, 2019-2031
- 15.1. Market Analysis, Insights and Forecast - By Country/Sub-region
- 15.1.1 Brazil
- 15.1.2 Argentina
- 15.1.3 Rest of South America
- 16. Competitive Analysis
- 16.1. Global Market Share Analysis 2024
- 16.2. Company Profiles
- 16.2.1 Merck Millipore
- 16.2.1.1. Overview
- 16.2.1.2. Products
- 16.2.1.3. SWOT Analysis
- 16.2.1.4. Recent Developments
- 16.2.1.5. Financials (Based on Availability)
- 16.2.2 Biomerieux
- 16.2.2.1. Overview
- 16.2.2.2. Products
- 16.2.2.3. SWOT Analysis
- 16.2.2.4. Recent Developments
- 16.2.2.5. Financials (Based on Availability)
- 16.2.3 F Hoffmann-La Roche Ltd
- 16.2.3.1. Overview
- 16.2.3.2. Products
- 16.2.3.3. SWOT Analysis
- 16.2.3.4. Recent Developments
- 16.2.3.5. Financials (Based on Availability)
- 16.2.4 Hologic Inc
- 16.2.4.1. Overview
- 16.2.4.2. Products
- 16.2.4.3. SWOT Analysis
- 16.2.4.4. Recent Developments
- 16.2.4.5. Financials (Based on Availability)
- 16.2.5 Quest Diagnostics
- 16.2.5.1. Overview
- 16.2.5.2. Products
- 16.2.5.3. SWOT Analysis
- 16.2.5.4. Recent Developments
- 16.2.5.5. Financials (Based on Availability)
- 16.2.6 Qiagen
- 16.2.6.1. Overview
- 16.2.6.2. Products
- 16.2.6.3. SWOT Analysis
- 16.2.6.4. Recent Developments
- 16.2.6.5. Financials (Based on Availability)
- 16.2.7 Thermo Fisher Scientific
- 16.2.7.1. Overview
- 16.2.7.2. Products
- 16.2.7.3. SWOT Analysis
- 16.2.7.4. Recent Developments
- 16.2.7.5. Financials (Based on Availability)
- 16.2.8 Illumina Inc
- 16.2.8.1. Overview
- 16.2.8.2. Products
- 16.2.8.3. SWOT Analysis
- 16.2.8.4. Recent Developments
- 16.2.8.5. Financials (Based on Availability)
- 16.2.9 Abbott Laboratories Inc
- 16.2.9.1. Overview
- 16.2.9.2. Products
- 16.2.9.3. SWOT Analysis
- 16.2.9.4. Recent Developments
- 16.2.9.5. Financials (Based on Availability)
- 16.2.10 Agilent Technologies
- 16.2.10.1. Overview
- 16.2.10.2. Products
- 16.2.10.3. SWOT Analysis
- 16.2.10.4. Recent Developments
- 16.2.10.5. Financials (Based on Availability)
- 16.2.1 Merck Millipore
List of Figures
- Figure 1: Global Cancer Biomarkers Market Revenue Breakdown (Million, %) by Region 2024 & 2032
- Figure 2: Global Cancer Biomarkers Market Volume Breakdown (K Unit, %) by Region 2024 & 2032
- Figure 3: North America Cancer Biomarkers Market Revenue (Million), by Country 2024 & 2032
- Figure 4: North America Cancer Biomarkers Market Volume (K Unit), by Country 2024 & 2032
- Figure 5: North America Cancer Biomarkers Market Revenue Share (%), by Country 2024 & 2032
- Figure 6: North America Cancer Biomarkers Market Volume Share (%), by Country 2024 & 2032
- Figure 7: Europe Cancer Biomarkers Market Revenue (Million), by Country 2024 & 2032
- Figure 8: Europe Cancer Biomarkers Market Volume (K Unit), by Country 2024 & 2032
- Figure 9: Europe Cancer Biomarkers Market Revenue Share (%), by Country 2024 & 2032
- Figure 10: Europe Cancer Biomarkers Market Volume Share (%), by Country 2024 & 2032
- Figure 11: Asia Pacific Cancer Biomarkers Market Revenue (Million), by Country 2024 & 2032
- Figure 12: Asia Pacific Cancer Biomarkers Market Volume (K Unit), by Country 2024 & 2032
- Figure 13: Asia Pacific Cancer Biomarkers Market Revenue Share (%), by Country 2024 & 2032
- Figure 14: Asia Pacific Cancer Biomarkers Market Volume Share (%), by Country 2024 & 2032
- Figure 15: Middle East and Africa Cancer Biomarkers Market Revenue (Million), by Country 2024 & 2032
- Figure 16: Middle East and Africa Cancer Biomarkers Market Volume (K Unit), by Country 2024 & 2032
- Figure 17: Middle East and Africa Cancer Biomarkers Market Revenue Share (%), by Country 2024 & 2032
- Figure 18: Middle East and Africa Cancer Biomarkers Market Volume Share (%), by Country 2024 & 2032
- Figure 19: South America Cancer Biomarkers Market Revenue (Million), by Country 2024 & 2032
- Figure 20: South America Cancer Biomarkers Market Volume (K Unit), by Country 2024 & 2032
- Figure 21: South America Cancer Biomarkers Market Revenue Share (%), by Country 2024 & 2032
- Figure 22: South America Cancer Biomarkers Market Volume Share (%), by Country 2024 & 2032
- Figure 23: North America Cancer Biomarkers Market Revenue (Million), by Disease 2024 & 2032
- Figure 24: North America Cancer Biomarkers Market Volume (K Unit), by Disease 2024 & 2032
- Figure 25: North America Cancer Biomarkers Market Revenue Share (%), by Disease 2024 & 2032
- Figure 26: North America Cancer Biomarkers Market Volume Share (%), by Disease 2024 & 2032
- Figure 27: North America Cancer Biomarkers Market Revenue (Million), by Type 2024 & 2032
- Figure 28: North America Cancer Biomarkers Market Volume (K Unit), by Type 2024 & 2032
- Figure 29: North America Cancer Biomarkers Market Revenue Share (%), by Type 2024 & 2032
- Figure 30: North America Cancer Biomarkers Market Volume Share (%), by Type 2024 & 2032
- Figure 31: North America Cancer Biomarkers Market Revenue (Million), by Profiling Technology 2024 & 2032
- Figure 32: North America Cancer Biomarkers Market Volume (K Unit), by Profiling Technology 2024 & 2032
- Figure 33: North America Cancer Biomarkers Market Revenue Share (%), by Profiling Technology 2024 & 2032
- Figure 34: North America Cancer Biomarkers Market Volume Share (%), by Profiling Technology 2024 & 2032
- Figure 35: North America Cancer Biomarkers Market Revenue (Million), by Country 2024 & 2032
- Figure 36: North America Cancer Biomarkers Market Volume (K Unit), by Country 2024 & 2032
- Figure 37: North America Cancer Biomarkers Market Revenue Share (%), by Country 2024 & 2032
- Figure 38: North America Cancer Biomarkers Market Volume Share (%), by Country 2024 & 2032
- Figure 39: Europe Cancer Biomarkers Market Revenue (Million), by Disease 2024 & 2032
- Figure 40: Europe Cancer Biomarkers Market Volume (K Unit), by Disease 2024 & 2032
- Figure 41: Europe Cancer Biomarkers Market Revenue Share (%), by Disease 2024 & 2032
- Figure 42: Europe Cancer Biomarkers Market Volume Share (%), by Disease 2024 & 2032
- Figure 43: Europe Cancer Biomarkers Market Revenue (Million), by Type 2024 & 2032
- Figure 44: Europe Cancer Biomarkers Market Volume (K Unit), by Type 2024 & 2032
- Figure 45: Europe Cancer Biomarkers Market Revenue Share (%), by Type 2024 & 2032
- Figure 46: Europe Cancer Biomarkers Market Volume Share (%), by Type 2024 & 2032
- Figure 47: Europe Cancer Biomarkers Market Revenue (Million), by Profiling Technology 2024 & 2032
- Figure 48: Europe Cancer Biomarkers Market Volume (K Unit), by Profiling Technology 2024 & 2032
- Figure 49: Europe Cancer Biomarkers Market Revenue Share (%), by Profiling Technology 2024 & 2032
- Figure 50: Europe Cancer Biomarkers Market Volume Share (%), by Profiling Technology 2024 & 2032
- Figure 51: Europe Cancer Biomarkers Market Revenue (Million), by Country 2024 & 2032
- Figure 52: Europe Cancer Biomarkers Market Volume (K Unit), by Country 2024 & 2032
- Figure 53: Europe Cancer Biomarkers Market Revenue Share (%), by Country 2024 & 2032
- Figure 54: Europe Cancer Biomarkers Market Volume Share (%), by Country 2024 & 2032
- Figure 55: Asia Pacific Cancer Biomarkers Market Revenue (Million), by Disease 2024 & 2032
- Figure 56: Asia Pacific Cancer Biomarkers Market Volume (K Unit), by Disease 2024 & 2032
- Figure 57: Asia Pacific Cancer Biomarkers Market Revenue Share (%), by Disease 2024 & 2032
- Figure 58: Asia Pacific Cancer Biomarkers Market Volume Share (%), by Disease 2024 & 2032
- Figure 59: Asia Pacific Cancer Biomarkers Market Revenue (Million), by Type 2024 & 2032
- Figure 60: Asia Pacific Cancer Biomarkers Market Volume (K Unit), by Type 2024 & 2032
- Figure 61: Asia Pacific Cancer Biomarkers Market Revenue Share (%), by Type 2024 & 2032
- Figure 62: Asia Pacific Cancer Biomarkers Market Volume Share (%), by Type 2024 & 2032
- Figure 63: Asia Pacific Cancer Biomarkers Market Revenue (Million), by Profiling Technology 2024 & 2032
- Figure 64: Asia Pacific Cancer Biomarkers Market Volume (K Unit), by Profiling Technology 2024 & 2032
- Figure 65: Asia Pacific Cancer Biomarkers Market Revenue Share (%), by Profiling Technology 2024 & 2032
- Figure 66: Asia Pacific Cancer Biomarkers Market Volume Share (%), by Profiling Technology 2024 & 2032
- Figure 67: Asia Pacific Cancer Biomarkers Market Revenue (Million), by Country 2024 & 2032
- Figure 68: Asia Pacific Cancer Biomarkers Market Volume (K Unit), by Country 2024 & 2032
- Figure 69: Asia Pacific Cancer Biomarkers Market Revenue Share (%), by Country 2024 & 2032
- Figure 70: Asia Pacific Cancer Biomarkers Market Volume Share (%), by Country 2024 & 2032
- Figure 71: Middle East and Africa Cancer Biomarkers Market Revenue (Million), by Disease 2024 & 2032
- Figure 72: Middle East and Africa Cancer Biomarkers Market Volume (K Unit), by Disease 2024 & 2032
- Figure 73: Middle East and Africa Cancer Biomarkers Market Revenue Share (%), by Disease 2024 & 2032
- Figure 74: Middle East and Africa Cancer Biomarkers Market Volume Share (%), by Disease 2024 & 2032
- Figure 75: Middle East and Africa Cancer Biomarkers Market Revenue (Million), by Type 2024 & 2032
- Figure 76: Middle East and Africa Cancer Biomarkers Market Volume (K Unit), by Type 2024 & 2032
- Figure 77: Middle East and Africa Cancer Biomarkers Market Revenue Share (%), by Type 2024 & 2032
- Figure 78: Middle East and Africa Cancer Biomarkers Market Volume Share (%), by Type 2024 & 2032
- Figure 79: Middle East and Africa Cancer Biomarkers Market Revenue (Million), by Profiling Technology 2024 & 2032
- Figure 80: Middle East and Africa Cancer Biomarkers Market Volume (K Unit), by Profiling Technology 2024 & 2032
- Figure 81: Middle East and Africa Cancer Biomarkers Market Revenue Share (%), by Profiling Technology 2024 & 2032
- Figure 82: Middle East and Africa Cancer Biomarkers Market Volume Share (%), by Profiling Technology 2024 & 2032
- Figure 83: Middle East and Africa Cancer Biomarkers Market Revenue (Million), by Country 2024 & 2032
- Figure 84: Middle East and Africa Cancer Biomarkers Market Volume (K Unit), by Country 2024 & 2032
- Figure 85: Middle East and Africa Cancer Biomarkers Market Revenue Share (%), by Country 2024 & 2032
- Figure 86: Middle East and Africa Cancer Biomarkers Market Volume Share (%), by Country 2024 & 2032
- Figure 87: South America Cancer Biomarkers Market Revenue (Million), by Disease 2024 & 2032
- Figure 88: South America Cancer Biomarkers Market Volume (K Unit), by Disease 2024 & 2032
- Figure 89: South America Cancer Biomarkers Market Revenue Share (%), by Disease 2024 & 2032
- Figure 90: South America Cancer Biomarkers Market Volume Share (%), by Disease 2024 & 2032
- Figure 91: South America Cancer Biomarkers Market Revenue (Million), by Type 2024 & 2032
- Figure 92: South America Cancer Biomarkers Market Volume (K Unit), by Type 2024 & 2032
- Figure 93: South America Cancer Biomarkers Market Revenue Share (%), by Type 2024 & 2032
- Figure 94: South America Cancer Biomarkers Market Volume Share (%), by Type 2024 & 2032
- Figure 95: South America Cancer Biomarkers Market Revenue (Million), by Profiling Technology 2024 & 2032
- Figure 96: South America Cancer Biomarkers Market Volume (K Unit), by Profiling Technology 2024 & 2032
- Figure 97: South America Cancer Biomarkers Market Revenue Share (%), by Profiling Technology 2024 & 2032
- Figure 98: South America Cancer Biomarkers Market Volume Share (%), by Profiling Technology 2024 & 2032
- Figure 99: South America Cancer Biomarkers Market Revenue (Million), by Country 2024 & 2032
- Figure 100: South America Cancer Biomarkers Market Volume (K Unit), by Country 2024 & 2032
- Figure 101: South America Cancer Biomarkers Market Revenue Share (%), by Country 2024 & 2032
- Figure 102: South America Cancer Biomarkers Market Volume Share (%), by Country 2024 & 2032
List of Tables
- Table 1: Global Cancer Biomarkers Market Revenue Million Forecast, by Region 2019 & 2032
- Table 2: Global Cancer Biomarkers Market Volume K Unit Forecast, by Region 2019 & 2032
- Table 3: Global Cancer Biomarkers Market Revenue Million Forecast, by Disease 2019 & 2032
- Table 4: Global Cancer Biomarkers Market Volume K Unit Forecast, by Disease 2019 & 2032
- Table 5: Global Cancer Biomarkers Market Revenue Million Forecast, by Type 2019 & 2032
- Table 6: Global Cancer Biomarkers Market Volume K Unit Forecast, by Type 2019 & 2032
- Table 7: Global Cancer Biomarkers Market Revenue Million Forecast, by Profiling Technology 2019 & 2032
- Table 8: Global Cancer Biomarkers Market Volume K Unit Forecast, by Profiling Technology 2019 & 2032
- Table 9: Global Cancer Biomarkers Market Revenue Million Forecast, by Region 2019 & 2032
- Table 10: Global Cancer Biomarkers Market Volume K Unit Forecast, by Region 2019 & 2032
- Table 11: Global Cancer Biomarkers Market Revenue Million Forecast, by Country 2019 & 2032
- Table 12: Global Cancer Biomarkers Market Volume K Unit Forecast, by Country 2019 & 2032
- Table 13: United States Cancer Biomarkers Market Revenue (Million) Forecast, by Application 2019 & 2032
- Table 14: United States Cancer Biomarkers Market Volume (K Unit) Forecast, by Application 2019 & 2032
- Table 15: Canada Cancer Biomarkers Market Revenue (Million) Forecast, by Application 2019 & 2032
- Table 16: Canada Cancer Biomarkers Market Volume (K Unit) Forecast, by Application 2019 & 2032
- Table 17: Mexico Cancer Biomarkers Market Revenue (Million) Forecast, by Application 2019 & 2032
- Table 18: Mexico Cancer Biomarkers Market Volume (K Unit) Forecast, by Application 2019 & 2032
- Table 19: Global Cancer Biomarkers Market Revenue Million Forecast, by Country 2019 & 2032
- Table 20: Global Cancer Biomarkers Market Volume K Unit Forecast, by Country 2019 & 2032
- Table 21: Germany Cancer Biomarkers Market Revenue (Million) Forecast, by Application 2019 & 2032
- Table 22: Germany Cancer Biomarkers Market Volume (K Unit) Forecast, by Application 2019 & 2032
- Table 23: United Kingdom Cancer Biomarkers Market Revenue (Million) Forecast, by Application 2019 & 2032
- Table 24: United Kingdom Cancer Biomarkers Market Volume (K Unit) Forecast, by Application 2019 & 2032
- Table 25: France Cancer Biomarkers Market Revenue (Million) Forecast, by Application 2019 & 2032
- Table 26: France Cancer Biomarkers Market Volume (K Unit) Forecast, by Application 2019 & 2032
- Table 27: Italy Cancer Biomarkers Market Revenue (Million) Forecast, by Application 2019 & 2032
- Table 28: Italy Cancer Biomarkers Market Volume (K Unit) Forecast, by Application 2019 & 2032
- Table 29: Spain Cancer Biomarkers Market Revenue (Million) Forecast, by Application 2019 & 2032
- Table 30: Spain Cancer Biomarkers Market Volume (K Unit) Forecast, by Application 2019 & 2032
- Table 31: Rest of Europe Cancer Biomarkers Market Revenue (Million) Forecast, by Application 2019 & 2032
- Table 32: Rest of Europe Cancer Biomarkers Market Volume (K Unit) Forecast, by Application 2019 & 2032
- Table 33: Global Cancer Biomarkers Market Revenue Million Forecast, by Country 2019 & 2032
- Table 34: Global Cancer Biomarkers Market Volume K Unit Forecast, by Country 2019 & 2032
- Table 35: China Cancer Biomarkers Market Revenue (Million) Forecast, by Application 2019 & 2032
- Table 36: China Cancer Biomarkers Market Volume (K Unit) Forecast, by Application 2019 & 2032
- Table 37: Japan Cancer Biomarkers Market Revenue (Million) Forecast, by Application 2019 & 2032
- Table 38: Japan Cancer Biomarkers Market Volume (K Unit) Forecast, by Application 2019 & 2032
- Table 39: India Cancer Biomarkers Market Revenue (Million) Forecast, by Application 2019 & 2032
- Table 40: India Cancer Biomarkers Market Volume (K Unit) Forecast, by Application 2019 & 2032
- Table 41: Australia Cancer Biomarkers Market Revenue (Million) Forecast, by Application 2019 & 2032
- Table 42: Australia Cancer Biomarkers Market Volume (K Unit) Forecast, by Application 2019 & 2032
- Table 43: South Korea Cancer Biomarkers Market Revenue (Million) Forecast, by Application 2019 & 2032
- Table 44: South Korea Cancer Biomarkers Market Volume (K Unit) Forecast, by Application 2019 & 2032
- Table 45: Rest of Asia Pacific Cancer Biomarkers Market Revenue (Million) Forecast, by Application 2019 & 2032
- Table 46: Rest of Asia Pacific Cancer Biomarkers Market Volume (K Unit) Forecast, by Application 2019 & 2032
- Table 47: Global Cancer Biomarkers Market Revenue Million Forecast, by Country 2019 & 2032
- Table 48: Global Cancer Biomarkers Market Volume K Unit Forecast, by Country 2019 & 2032
- Table 49: GCC Cancer Biomarkers Market Revenue (Million) Forecast, by Application 2019 & 2032
- Table 50: GCC Cancer Biomarkers Market Volume (K Unit) Forecast, by Application 2019 & 2032
- Table 51: South Africa Cancer Biomarkers Market Revenue (Million) Forecast, by Application 2019 & 2032
- Table 52: South Africa Cancer Biomarkers Market Volume (K Unit) Forecast, by Application 2019 & 2032
- Table 53: Rest of Middle East and Africa Cancer Biomarkers Market Revenue (Million) Forecast, by Application 2019 & 2032
- Table 54: Rest of Middle East and Africa Cancer Biomarkers Market Volume (K Unit) Forecast, by Application 2019 & 2032
- Table 55: Global Cancer Biomarkers Market Revenue Million Forecast, by Country 2019 & 2032
- Table 56: Global Cancer Biomarkers Market Volume K Unit Forecast, by Country 2019 & 2032
- Table 57: Brazil Cancer Biomarkers Market Revenue (Million) Forecast, by Application 2019 & 2032
- Table 58: Brazil Cancer Biomarkers Market Volume (K Unit) Forecast, by Application 2019 & 2032
- Table 59: Argentina Cancer Biomarkers Market Revenue (Million) Forecast, by Application 2019 & 2032
- Table 60: Argentina Cancer Biomarkers Market Volume (K Unit) Forecast, by Application 2019 & 2032
- Table 61: Rest of South America Cancer Biomarkers Market Revenue (Million) Forecast, by Application 2019 & 2032
- Table 62: Rest of South America Cancer Biomarkers Market Volume (K Unit) Forecast, by Application 2019 & 2032
- Table 63: Global Cancer Biomarkers Market Revenue Million Forecast, by Disease 2019 & 2032
- Table 64: Global Cancer Biomarkers Market Volume K Unit Forecast, by Disease 2019 & 2032
- Table 65: Global Cancer Biomarkers Market Revenue Million Forecast, by Type 2019 & 2032
- Table 66: Global Cancer Biomarkers Market Volume K Unit Forecast, by Type 2019 & 2032
- Table 67: Global Cancer Biomarkers Market Revenue Million Forecast, by Profiling Technology 2019 & 2032
- Table 68: Global Cancer Biomarkers Market Volume K Unit Forecast, by Profiling Technology 2019 & 2032
- Table 69: Global Cancer Biomarkers Market Revenue Million Forecast, by Country 2019 & 2032
- Table 70: Global Cancer Biomarkers Market Volume K Unit Forecast, by Country 2019 & 2032
- Table 71: United States Cancer Biomarkers Market Revenue (Million) Forecast, by Application 2019 & 2032
- Table 72: United States Cancer Biomarkers Market Volume (K Unit) Forecast, by Application 2019 & 2032
- Table 73: Canada Cancer Biomarkers Market Revenue (Million) Forecast, by Application 2019 & 2032
- Table 74: Canada Cancer Biomarkers Market Volume (K Unit) Forecast, by Application 2019 & 2032
- Table 75: Mexico Cancer Biomarkers Market Revenue (Million) Forecast, by Application 2019 & 2032
- Table 76: Mexico Cancer Biomarkers Market Volume (K Unit) Forecast, by Application 2019 & 2032
- Table 77: Global Cancer Biomarkers Market Revenue Million Forecast, by Disease 2019 & 2032
- Table 78: Global Cancer Biomarkers Market Volume K Unit Forecast, by Disease 2019 & 2032
- Table 79: Global Cancer Biomarkers Market Revenue Million Forecast, by Type 2019 & 2032
- Table 80: Global Cancer Biomarkers Market Volume K Unit Forecast, by Type 2019 & 2032
- Table 81: Global Cancer Biomarkers Market Revenue Million Forecast, by Profiling Technology 2019 & 2032
- Table 82: Global Cancer Biomarkers Market Volume K Unit Forecast, by Profiling Technology 2019 & 2032
- Table 83: Global Cancer Biomarkers Market Revenue Million Forecast, by Country 2019 & 2032
- Table 84: Global Cancer Biomarkers Market Volume K Unit Forecast, by Country 2019 & 2032
- Table 85: Germany Cancer Biomarkers Market Revenue (Million) Forecast, by Application 2019 & 2032
- Table 86: Germany Cancer Biomarkers Market Volume (K Unit) Forecast, by Application 2019 & 2032
- Table 87: United Kingdom Cancer Biomarkers Market Revenue (Million) Forecast, by Application 2019 & 2032
- Table 88: United Kingdom Cancer Biomarkers Market Volume (K Unit) Forecast, by Application 2019 & 2032
- Table 89: France Cancer Biomarkers Market Revenue (Million) Forecast, by Application 2019 & 2032
- Table 90: France Cancer Biomarkers Market Volume (K Unit) Forecast, by Application 2019 & 2032
- Table 91: Italy Cancer Biomarkers Market Revenue (Million) Forecast, by Application 2019 & 2032
- Table 92: Italy Cancer Biomarkers Market Volume (K Unit) Forecast, by Application 2019 & 2032
- Table 93: Spain Cancer Biomarkers Market Revenue (Million) Forecast, by Application 2019 & 2032
- Table 94: Spain Cancer Biomarkers Market Volume (K Unit) Forecast, by Application 2019 & 2032
- Table 95: Rest of Europe Cancer Biomarkers Market Revenue (Million) Forecast, by Application 2019 & 2032
- Table 96: Rest of Europe Cancer Biomarkers Market Volume (K Unit) Forecast, by Application 2019 & 2032
- Table 97: Global Cancer Biomarkers Market Revenue Million Forecast, by Disease 2019 & 2032
- Table 98: Global Cancer Biomarkers Market Volume K Unit Forecast, by Disease 2019 & 2032
- Table 99: Global Cancer Biomarkers Market Revenue Million Forecast, by Type 2019 & 2032
- Table 100: Global Cancer Biomarkers Market Volume K Unit Forecast, by Type 2019 & 2032
- Table 101: Global Cancer Biomarkers Market Revenue Million Forecast, by Profiling Technology 2019 & 2032
- Table 102: Global Cancer Biomarkers Market Volume K Unit Forecast, by Profiling Technology 2019 & 2032
- Table 103: Global Cancer Biomarkers Market Revenue Million Forecast, by Country 2019 & 2032
- Table 104: Global Cancer Biomarkers Market Volume K Unit Forecast, by Country 2019 & 2032
- Table 105: China Cancer Biomarkers Market Revenue (Million) Forecast, by Application 2019 & 2032
- Table 106: China Cancer Biomarkers Market Volume (K Unit) Forecast, by Application 2019 & 2032
- Table 107: Japan Cancer Biomarkers Market Revenue (Million) Forecast, by Application 2019 & 2032
- Table 108: Japan Cancer Biomarkers Market Volume (K Unit) Forecast, by Application 2019 & 2032
- Table 109: India Cancer Biomarkers Market Revenue (Million) Forecast, by Application 2019 & 2032
- Table 110: India Cancer Biomarkers Market Volume (K Unit) Forecast, by Application 2019 & 2032
- Table 111: Australia Cancer Biomarkers Market Revenue (Million) Forecast, by Application 2019 & 2032
- Table 112: Australia Cancer Biomarkers Market Volume (K Unit) Forecast, by Application 2019 & 2032
- Table 113: South Korea Cancer Biomarkers Market Revenue (Million) Forecast, by Application 2019 & 2032
- Table 114: South Korea Cancer Biomarkers Market Volume (K Unit) Forecast, by Application 2019 & 2032
- Table 115: Rest of Asia Pacific Cancer Biomarkers Market Revenue (Million) Forecast, by Application 2019 & 2032
- Table 116: Rest of Asia Pacific Cancer Biomarkers Market Volume (K Unit) Forecast, by Application 2019 & 2032
- Table 117: Global Cancer Biomarkers Market Revenue Million Forecast, by Disease 2019 & 2032
- Table 118: Global Cancer Biomarkers Market Volume K Unit Forecast, by Disease 2019 & 2032
- Table 119: Global Cancer Biomarkers Market Revenue Million Forecast, by Type 2019 & 2032
- Table 120: Global Cancer Biomarkers Market Volume K Unit Forecast, by Type 2019 & 2032
- Table 121: Global Cancer Biomarkers Market Revenue Million Forecast, by Profiling Technology 2019 & 2032
- Table 122: Global Cancer Biomarkers Market Volume K Unit Forecast, by Profiling Technology 2019 & 2032
- Table 123: Global Cancer Biomarkers Market Revenue Million Forecast, by Country 2019 & 2032
- Table 124: Global Cancer Biomarkers Market Volume K Unit Forecast, by Country 2019 & 2032
- Table 125: GCC Cancer Biomarkers Market Revenue (Million) Forecast, by Application 2019 & 2032
- Table 126: GCC Cancer Biomarkers Market Volume (K Unit) Forecast, by Application 2019 & 2032
- Table 127: South Africa Cancer Biomarkers Market Revenue (Million) Forecast, by Application 2019 & 2032
- Table 128: South Africa Cancer Biomarkers Market Volume (K Unit) Forecast, by Application 2019 & 2032
- Table 129: Rest of Middle East and Africa Cancer Biomarkers Market Revenue (Million) Forecast, by Application 2019 & 2032
- Table 130: Rest of Middle East and Africa Cancer Biomarkers Market Volume (K Unit) Forecast, by Application 2019 & 2032
- Table 131: Global Cancer Biomarkers Market Revenue Million Forecast, by Disease 2019 & 2032
- Table 132: Global Cancer Biomarkers Market Volume K Unit Forecast, by Disease 2019 & 2032
- Table 133: Global Cancer Biomarkers Market Revenue Million Forecast, by Type 2019 & 2032
- Table 134: Global Cancer Biomarkers Market Volume K Unit Forecast, by Type 2019 & 2032
- Table 135: Global Cancer Biomarkers Market Revenue Million Forecast, by Profiling Technology 2019 & 2032
- Table 136: Global Cancer Biomarkers Market Volume K Unit Forecast, by Profiling Technology 2019 & 2032
- Table 137: Global Cancer Biomarkers Market Revenue Million Forecast, by Country 2019 & 2032
- Table 138: Global Cancer Biomarkers Market Volume K Unit Forecast, by Country 2019 & 2032
- Table 139: Brazil Cancer Biomarkers Market Revenue (Million) Forecast, by Application 2019 & 2032
- Table 140: Brazil Cancer Biomarkers Market Volume (K Unit) Forecast, by Application 2019 & 2032
- Table 141: Argentina Cancer Biomarkers Market Revenue (Million) Forecast, by Application 2019 & 2032
- Table 142: Argentina Cancer Biomarkers Market Volume (K Unit) Forecast, by Application 2019 & 2032
- Table 143: Rest of South America Cancer Biomarkers Market Revenue (Million) Forecast, by Application 2019 & 2032
- Table 144: Rest of South America Cancer Biomarkers Market Volume (K Unit) Forecast, by Application 2019 & 2032
Frequently Asked Questions
1. What is the projected Compound Annual Growth Rate (CAGR) of the Cancer Biomarkers Market?
The projected CAGR is approximately 12.43%.
2. Which companies are prominent players in the Cancer Biomarkers Market?
Key companies in the market include Merck Millipore, Biomerieux, F Hoffmann-La Roche Ltd, Hologic Inc, Quest Diagnostics, Qiagen, Thermo Fisher Scientific, Illumina Inc, Abbott Laboratories Inc, Agilent Technologies.
3. What are the main segments of the Cancer Biomarkers Market?
The market segments include Disease, Type, Profiling Technology.
4. Can you provide details about the market size?
The market size is estimated to be USD 23.26 Million as of 2022.
5. What are some drivers contributing to market growth?
Surge in Prevalence of Cancer Across the Globe; Paradigm Shift in Healthcare from Disease Diagnosis to Risk Assessment or Early Diagnosis; Increasing Focus on Innovative Drug Development.
6. What are the notable trends driving market growth?
Lung Cancer Segment is Expected to Hold a Significant Market Share in the Cancer Biomarkers Market.
7. Are there any restraints impacting market growth?
High Cost of Cancer Diagnosis with Biomarkers; Reimbursement Issues with Biomarker Testing.
8. Can you provide examples of recent developments in the market?
February 2022: OncoDNA introduced the OncoDEEP Solid Tumor Biomarker Test Kit. The OncoDEEP kit, which includes Twist Bioscience's enrichment and library preparation solutions, will give labs a complete and reliable solution for performing comprehensive NGS analysis of tumor samples.
9. What pricing options are available for accessing the report?
Pricing options include single-user, multi-user, and enterprise licenses priced at USD 4750, USD 5250, and USD 8750 respectively.
10. Is the market size provided in terms of value or volume?
The market size is provided in terms of value, measured in Million and volume, measured in K Unit.
11. Are there any specific market keywords associated with the report?
Yes, the market keyword associated with the report is "Cancer Biomarkers Market," which aids in identifying and referencing the specific market segment covered.
12. How do I determine which pricing option suits my needs best?
The pricing options vary based on user requirements and access needs. Individual users may opt for single-user licenses, while businesses requiring broader access may choose multi-user or enterprise licenses for cost-effective access to the report.
13. Are there any additional resources or data provided in the Cancer Biomarkers Market report?
While the report offers comprehensive insights, it's advisable to review the specific contents or supplementary materials provided to ascertain if additional resources or data are available.
14. How can I stay updated on further developments or reports in the Cancer Biomarkers Market?
To stay informed about further developments, trends, and reports in the Cancer Biomarkers Market, consider subscribing to industry newsletters, following relevant companies and organizations, or regularly checking reputable industry news sources and publications.
Methodology
Step 1 - Identification of Relevant Samples Size from Population Database


Step 2 - Approaches for Defining Global Market Size (Value, Volume* & Price*)

Note*: In applicable scenarios
Step 3 - Data Sources
Primary Research
- Web Analytics
- Survey Reports
- Research Institute
- Latest Research Reports
- Opinion Leaders
Secondary Research
- Annual Reports
- White Paper
- Latest Press Release
- Industry Association
- Paid Database
- Investor Presentations

Step 4 - Data Triangulation
Involves using different sources of information in order to increase the validity of a study
These sources are likely to be stakeholders in a program - participants, other researchers, program staff, other community members, and so on.
Then we put all data in single framework & apply various statistical tools to find out the dynamic on the market.
During the analysis stage, feedback from the stakeholder groups would be compared to determine areas of agreement as well as areas of divergence
