

Key Insights
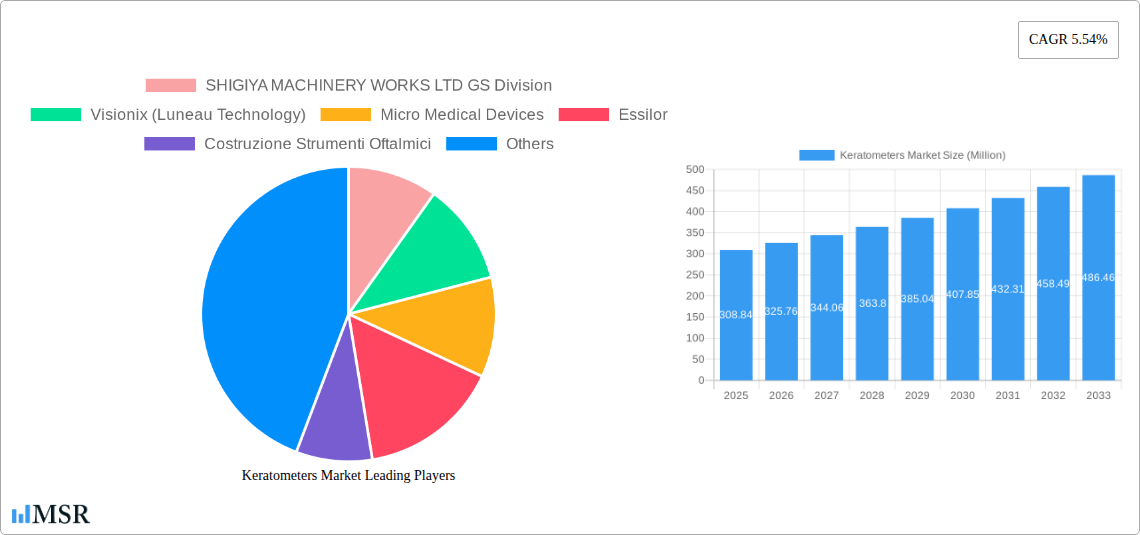
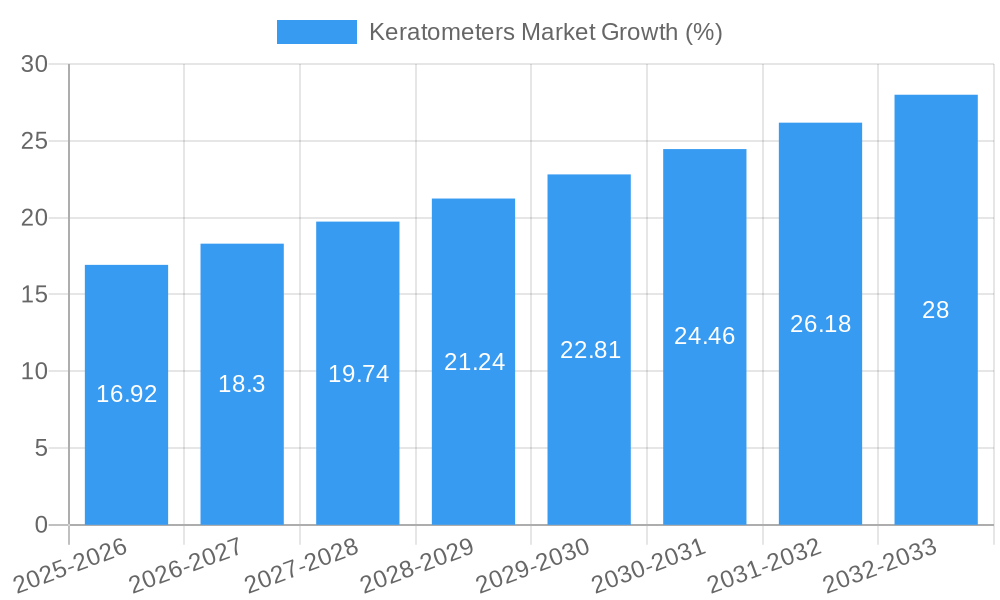
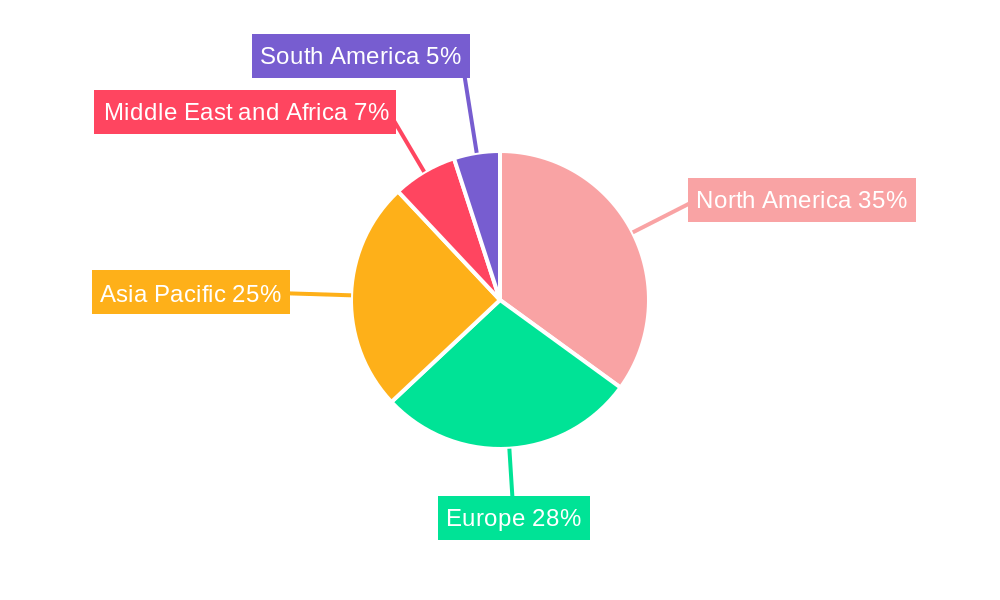
The global keratometers market, valued at $308.84 million in 2025, is projected to experience robust growth, driven by several key factors. The increasing prevalence of refractive errors globally, coupled with rising awareness about early detection and correction, fuels demand for accurate and efficient keratometry devices. Technological advancements, such as the development of automated and portable keratometers offering improved accuracy and ease of use, are further stimulating market expansion. Hospitals and eye clinics represent the largest end-user segments, reflecting the crucial role of keratometers in comprehensive eye examinations and refractive surgery planning. The market is witnessing a shift towards advanced technologies incorporating features like topographic mapping and wavefront analysis, leading to more precise diagnostic capabilities. Competition among established players like Topcon, Nidek, and Zeiss, along with emerging players introducing innovative solutions, is fostering innovation and driving down costs, making keratometry accessible to a wider patient base. Growth is expected across all regions, with North America and Europe maintaining significant market share due to established healthcare infrastructure and higher adoption rates. However, Asia-Pacific is anticipated to exhibit the fastest growth rate due to increasing ophthalmological services and rising disposable incomes.
Despite the positive outlook, certain challenges could restrain market growth. The high cost of advanced keratometers might limit their accessibility in developing countries. Furthermore, the market is somewhat susceptible to technological advancements and regulatory changes. However, the overall trend favors continued expansion driven by the increasing need for precise refractive error diagnosis and the ongoing innovation in keratometry technologies. The integration of keratometers into wider ophthalmic diagnostic platforms and the development of user-friendly, cost-effective devices are likely to further enhance market penetration in the coming years. The forecast period, 2025-2033, anticipates continued market growth, supported by sustained investment in eye healthcare and ongoing technological improvements.
Keratometers Market: A Comprehensive Report (2019-2033)
This comprehensive report offers a deep dive into the global Keratometers Market, providing a detailed analysis of market dynamics, key players, and future growth opportunities. With a study period spanning from 2019 to 2033, including a base year of 2025 and a forecast period from 2025 to 2033, this report is an indispensable resource for industry stakeholders, investors, and market researchers seeking to understand the evolving landscape of keratometry. The market is segmented by type (Stationary Type Keratometers, Portable Type Keratometers) and end-user (Hospitals, Eye Clinics, Others). The global market size is estimated at xx Million in 2025 and is projected to reach xx Million by 2033, exhibiting a CAGR of xx% during the forecast period.
Keratometers Market Concentration & Dynamics
The Keratometers market exhibits a moderately consolidated structure, with several key players holding significant market share. While exact market share figures for each company are proprietary data, the leading players include SHIGIYA MACHINERY WORKS LTD GS Division, Visionix (Luneau Technology), Micro Medical Devices, Essilor, Costruzione Strumenti Oftalmici, Reichert Inc, Carl Zeiss AG, Naugra Medical, Topcon Corporation, Canon Medical Systems Corporation, NIDEK CO LTD, and TOMEY GmbH. However, the market also features several smaller, specialized players, creating a dynamic competitive landscape.
- Market Concentration: The Herfindahl-Hirschman Index (HHI) is estimated to be around xx, suggesting a moderately concentrated market.
- Innovation Ecosystems: Significant R&D investments are driving innovation in areas like improved image processing, miniaturization, and integration with other ophthalmic diagnostic tools.
- Regulatory Frameworks: Stringent regulatory approvals for medical devices influence market entry and product development strategies. Compliance with regulations like FDA (in the US) and CE marking (in Europe) is crucial.
- Substitute Products: While no direct substitutes exist for keratometers, advancements in other ophthalmic imaging technologies might influence market adoption.
- End-User Trends: The increasing prevalence of refractive errors and the growing demand for advanced eye care services are driving market growth.
- M&A Activities: The number of M&A deals in the keratometers market during the historical period (2019-2024) was estimated at xx. Consolidation is expected to continue as larger players seek to expand their market share.
Keratometers Market Industry Insights & Trends
The global keratometers market is experiencing substantial growth fueled by several factors. The rising prevalence of refractive errors globally, particularly myopia, is a primary driver. Increased awareness of eye health and the growing adoption of advanced diagnostic tools in ophthalmology practices are also contributing to market expansion. Technological advancements, such as the integration of digital imaging and automation, are improving the accuracy and efficiency of keratometry, further boosting market demand. The preference for non-invasive diagnostic methods is also positively impacting the market. Furthermore, the increasing number of eye clinics and hospitals, coupled with favorable reimbursement policies in several regions, are accelerating market growth. The market's growth trajectory is projected to remain positive throughout the forecast period, driven by ongoing technological innovations and the increasing demand for advanced eye care.
Key Markets & Segments Leading Keratometers Market
The North American region currently holds a dominant position in the global keratometers market, owing to advanced healthcare infrastructure, high adoption rates of advanced diagnostic tools, and a substantial investment in ophthalmic research and development. However, the Asia-Pacific region is projected to experience significant growth in the coming years, fueled by the rapidly expanding healthcare sector and the rising prevalence of refractive errors in developing economies.
By Type:
- Stationary Type Keratometers: This segment holds a larger market share due to its superior accuracy and features.
- Portable Type Keratometers: This segment is growing at a faster rate due to increasing demand for point-of-care diagnostics and ease of use.
By End User:
- Hospitals: Hospitals represent a significant portion of the market due to their high volume of patients and need for precise diagnostic tools.
- Eye Clinics: The increasing number of private eye clinics is driving growth in this segment.
- Others: This segment includes research institutions and academic settings.
Drivers:
- North America: Strong healthcare infrastructure, high technological adoption, favorable reimbursement policies.
- Asia-Pacific: Rapidly growing healthcare sector, rising prevalence of refractive errors, increasing disposable incomes.
- Europe: Well-established healthcare systems, increasing investments in ophthalmology.
Keratometers Market Product Developments
Recent advancements in keratometry technology have focused on improving image quality, enhancing measurement accuracy, and incorporating automated analysis features. The integration of digital imaging, advanced algorithms, and user-friendly interfaces has made keratometers more efficient and accessible to healthcare professionals. Innovations such as the WaveDyn Vision Analyzer, launched in March 2023, further highlight the trend towards more sophisticated and dynamic systems. These advancements are contributing to improved diagnostic accuracy and better patient care, giving manufacturers a competitive edge.
Challenges in the Keratometers Market Market
Several factors pose challenges to the growth of the keratometers market. High costs associated with advanced systems can limit accessibility, particularly in resource-constrained settings. Stringent regulatory approvals and compliance requirements add to the complexity and cost of product development and market entry. Furthermore, competition from other ophthalmic diagnostic tools and the potential for technological disruptions could impact market dynamics. Supply chain disruptions can affect the availability of components and manufacturing processes, potentially impacting overall market growth.
Forces Driving Keratometers Market Growth
The market's growth is propelled by technological advancements leading to improved accuracy and efficiency in keratometry. The rising prevalence of refractive errors, particularly myopia, globally fuels demand for diagnostic tools. Favorable reimbursement policies in several regions enhance accessibility and adoption. Increased awareness of eye health and proactive eye care practices are also contributing to market expansion. The development of integrated systems combining keratometry with other diagnostic tests further enhances market appeal.
Long-Term Growth Catalysts in the Keratometers Market
Long-term growth in the keratometers market will be driven by continued innovation in imaging technologies, leading to more accurate and efficient devices. Strategic partnerships between manufacturers and healthcare providers will enhance market penetration and distribution. Expanding into emerging markets with high unmet needs, particularly in regions with rising prevalence of refractive errors, will contribute to future growth.
Emerging Opportunities in Keratometers Market
Emerging opportunities lie in the development of portable and point-of-care keratometers, expanding access to diagnostics in remote areas and improving convenience for patients. Integrating artificial intelligence and machine learning algorithms into keratometers can enhance diagnostic accuracy and automate analysis. The development of cloud-based platforms for data management and analysis represents another significant opportunity. Focusing on personalized medicine and tailoring treatments based on precise keratometric measurements will also drive market growth.
Leading Players in the Keratometers Market Sector
- SHIGIYA MACHINERY WORKS LTD GS Division
- Visionix (Luneau Technology)
- Micro Medical Devices
- Essilor
- Costruzione Strumenti Oftalmici
- Reichert Inc
- Carl Zeiss AG
- Naugra Medical
- Topcon Corporation
- Canon Medical Systems Corporation
- NIDEK CO LTD
- TOMEY GmbH
Key Milestones in Keratometers Market Industry
- June 2023: EssilorLuxottica and the World Society of Paediatric Ophthalmology and Strabismus collaborated to advance knowledge and education of myopia management globally. This collaboration is expected to drive increased demand for myopia management tools, indirectly benefiting the keratometers market.
- March 2023: WaveFront Dynamics Inc. launched the WaveDyn Vision Analyzer, a dynamic aberrometry measurement system that also performs keratometry, demonstrating innovation in the field and potentially impacting market competition.
Strategic Outlook for Keratometers Market Market
The future of the keratometers market is bright, driven by technological innovation, increasing prevalence of refractive errors, and growing demand for advanced eye care. Strategic partnerships, expansion into new markets, and a focus on personalized medicine will be key to achieving sustained growth. Companies that invest in R&D and adopt innovative business models will be best positioned to capture market share and capitalize on emerging opportunities in this dynamic sector.
Keratometers Market Segmentation
-
1. Type
- 1.1. Stationary Type Keratometers
- 1.2. Portable Type Keratometers
-
2. End User
- 2.1. Hospitals
- 2.2. Eye Clinics
- 2.3. Others
Keratometers Market Segmentation By Geography
-
1. North America
- 1.1. United States
- 1.2. Canada
- 1.3. Mexico
-
2. Europe
- 2.1. Germany
- 2.2. United Kingdom
- 2.3. France
- 2.4. Italy
- 2.5. Spain
- 2.6. Rest of Europe
-
3. Asia Pacific
- 3.1. China
- 3.2. Japan
- 3.3. India
- 3.4. Australia
- 3.5. South Korea
- 3.6. Rest of Asia Pacific
-
4. Middle East and Africa
- 4.1. GCC
- 4.2. South Africa
- 4.3. Rest of Middle East and Africa
-
5. South America
- 5.1. Brazil
- 5.2. Argentina
- 5.3. Rest of South America
Keratometers Market REPORT HIGHLIGHTS
| Aspects | Details |
|---|---|
| Study Period | 2019-2033 |
| Base Year | 2024 |
| Estimated Year | 2025 |
| Forecast Period | 2025-2033 |
| Historical Period | 2019-2024 |
| Growth Rate | CAGR of 5.54% from 2019-2033 |
| Segmentation |
|
Table of Contents
- 1. Introduction
- 1.1. Research Scope
- 1.2. Market Segmentation
- 1.3. Research Methodology
- 1.4. Definitions and Assumptions
- 2. Executive Summary
- 2.1. Introduction
- 3. Market Dynamics
- 3.1. Introduction
- 3.2. Market Drivers
- 3.2.1 Increasing Burden of Eye Disorders; Growing Investments
- 3.2.2 Funds
- 3.2.3 and Grants on Eye Care Devices
- 3.3. Market Restrains
- 3.3.1. Lack of Primary Infrastructure For Eye Related Diseases in Underdeveloped and Developing Countries
- 3.4. Market Trends
- 3.4.1. Hospitals are Expected to Hold a Significant Market Share Over the Forecast Period
- 4. Market Factor Analysis
- 4.1. Porters Five Forces
- 4.2. Supply/Value Chain
- 4.3. PESTEL analysis
- 4.4. Market Entropy
- 4.5. Patent/Trademark Analysis
- 5. Global Keratometers Market Analysis, Insights and Forecast, 2019-2031
- 5.1. Market Analysis, Insights and Forecast - by Type
- 5.1.1. Stationary Type Keratometers
- 5.1.2. Portable Type Keratometers
- 5.2. Market Analysis, Insights and Forecast - by End User
- 5.2.1. Hospitals
- 5.2.2. Eye Clinics
- 5.2.3. Others
- 5.3. Market Analysis, Insights and Forecast - by Region
- 5.3.1. North America
- 5.3.2. Europe
- 5.3.3. Asia Pacific
- 5.3.4. Middle East and Africa
- 5.3.5. South America
- 5.1. Market Analysis, Insights and Forecast - by Type
- 6. North America Keratometers Market Analysis, Insights and Forecast, 2019-2031
- 6.1. Market Analysis, Insights and Forecast - by Type
- 6.1.1. Stationary Type Keratometers
- 6.1.2. Portable Type Keratometers
- 6.2. Market Analysis, Insights and Forecast - by End User
- 6.2.1. Hospitals
- 6.2.2. Eye Clinics
- 6.2.3. Others
- 6.1. Market Analysis, Insights and Forecast - by Type
- 7. Europe Keratometers Market Analysis, Insights and Forecast, 2019-2031
- 7.1. Market Analysis, Insights and Forecast - by Type
- 7.1.1. Stationary Type Keratometers
- 7.1.2. Portable Type Keratometers
- 7.2. Market Analysis, Insights and Forecast - by End User
- 7.2.1. Hospitals
- 7.2.2. Eye Clinics
- 7.2.3. Others
- 7.1. Market Analysis, Insights and Forecast - by Type
- 8. Asia Pacific Keratometers Market Analysis, Insights and Forecast, 2019-2031
- 8.1. Market Analysis, Insights and Forecast - by Type
- 8.1.1. Stationary Type Keratometers
- 8.1.2. Portable Type Keratometers
- 8.2. Market Analysis, Insights and Forecast - by End User
- 8.2.1. Hospitals
- 8.2.2. Eye Clinics
- 8.2.3. Others
- 8.1. Market Analysis, Insights and Forecast - by Type
- 9. Middle East and Africa Keratometers Market Analysis, Insights and Forecast, 2019-2031
- 9.1. Market Analysis, Insights and Forecast - by Type
- 9.1.1. Stationary Type Keratometers
- 9.1.2. Portable Type Keratometers
- 9.2. Market Analysis, Insights and Forecast - by End User
- 9.2.1. Hospitals
- 9.2.2. Eye Clinics
- 9.2.3. Others
- 9.1. Market Analysis, Insights and Forecast - by Type
- 10. South America Keratometers Market Analysis, Insights and Forecast, 2019-2031
- 10.1. Market Analysis, Insights and Forecast - by Type
- 10.1.1. Stationary Type Keratometers
- 10.1.2. Portable Type Keratometers
- 10.2. Market Analysis, Insights and Forecast - by End User
- 10.2.1. Hospitals
- 10.2.2. Eye Clinics
- 10.2.3. Others
- 10.1. Market Analysis, Insights and Forecast - by Type
- 11. North America Keratometers Market Analysis, Insights and Forecast, 2019-2031
- 11.1. Market Analysis, Insights and Forecast - By Country/Sub-region
- 11.1.1 United States
- 11.1.2 Canada
- 11.1.3 Mexico
- 12. Europe Keratometers Market Analysis, Insights and Forecast, 2019-2031
- 12.1. Market Analysis, Insights and Forecast - By Country/Sub-region
- 12.1.1 Germany
- 12.1.2 United Kingdom
- 12.1.3 France
- 12.1.4 Italy
- 12.1.5 Spain
- 12.1.6 Rest of Europe
- 13. Asia Pacific Keratometers Market Analysis, Insights and Forecast, 2019-2031
- 13.1. Market Analysis, Insights and Forecast - By Country/Sub-region
- 13.1.1 China
- 13.1.2 Japan
- 13.1.3 India
- 13.1.4 Australia
- 13.1.5 South Korea
- 13.1.6 Rest of Asia Pacific
- 14. Middle East and Africa Keratometers Market Analysis, Insights and Forecast, 2019-2031
- 14.1. Market Analysis, Insights and Forecast - By Country/Sub-region
- 14.1.1 GCC
- 14.1.2 South Africa
- 14.1.3 Rest of Middle East and Africa
- 15. South America Keratometers Market Analysis, Insights and Forecast, 2019-2031
- 15.1. Market Analysis, Insights and Forecast - By Country/Sub-region
- 15.1.1 Brazil
- 15.1.2 Argentina
- 15.1.3 Rest of South America
- 16. Competitive Analysis
- 16.1. Global Market Share Analysis 2024
- 16.2. Company Profiles
- 16.2.1 SHIGIYA MACHINERY WORKS LTD GS Division
- 16.2.1.1. Overview
- 16.2.1.2. Products
- 16.2.1.3. SWOT Analysis
- 16.2.1.4. Recent Developments
- 16.2.1.5. Financials (Based on Availability)
- 16.2.2 Visionix (Luneau Technology)
- 16.2.2.1. Overview
- 16.2.2.2. Products
- 16.2.2.3. SWOT Analysis
- 16.2.2.4. Recent Developments
- 16.2.2.5. Financials (Based on Availability)
- 16.2.3 Micro Medical Devices
- 16.2.3.1. Overview
- 16.2.3.2. Products
- 16.2.3.3. SWOT Analysis
- 16.2.3.4. Recent Developments
- 16.2.3.5. Financials (Based on Availability)
- 16.2.4 Essilor
- 16.2.4.1. Overview
- 16.2.4.2. Products
- 16.2.4.3. SWOT Analysis
- 16.2.4.4. Recent Developments
- 16.2.4.5. Financials (Based on Availability)
- 16.2.5 Costruzione Strumenti Oftalmici
- 16.2.5.1. Overview
- 16.2.5.2. Products
- 16.2.5.3. SWOT Analysis
- 16.2.5.4. Recent Developments
- 16.2.5.5. Financials (Based on Availability)
- 16.2.6 Reichert Inc
- 16.2.6.1. Overview
- 16.2.6.2. Products
- 16.2.6.3. SWOT Analysis
- 16.2.6.4. Recent Developments
- 16.2.6.5. Financials (Based on Availability)
- 16.2.7 Carl Zeiss AG
- 16.2.7.1. Overview
- 16.2.7.2. Products
- 16.2.7.3. SWOT Analysis
- 16.2.7.4. Recent Developments
- 16.2.7.5. Financials (Based on Availability)
- 16.2.8 Naugra Medical
- 16.2.8.1. Overview
- 16.2.8.2. Products
- 16.2.8.3. SWOT Analysis
- 16.2.8.4. Recent Developments
- 16.2.8.5. Financials (Based on Availability)
- 16.2.9 Topcon Corporation
- 16.2.9.1. Overview
- 16.2.9.2. Products
- 16.2.9.3. SWOT Analysis
- 16.2.9.4. Recent Developments
- 16.2.9.5. Financials (Based on Availability)
- 16.2.10 Canon Medical Systems Corporation*List Not Exhaustive
- 16.2.10.1. Overview
- 16.2.10.2. Products
- 16.2.10.3. SWOT Analysis
- 16.2.10.4. Recent Developments
- 16.2.10.5. Financials (Based on Availability)
- 16.2.11 NIDEK CO LTD
- 16.2.11.1. Overview
- 16.2.11.2. Products
- 16.2.11.3. SWOT Analysis
- 16.2.11.4. Recent Developments
- 16.2.11.5. Financials (Based on Availability)
- 16.2.12 TOMEY GmbH
- 16.2.12.1. Overview
- 16.2.12.2. Products
- 16.2.12.3. SWOT Analysis
- 16.2.12.4. Recent Developments
- 16.2.12.5. Financials (Based on Availability)
- 16.2.1 SHIGIYA MACHINERY WORKS LTD GS Division
List of Figures
- Figure 1: Global Keratometers Market Revenue Breakdown (Million, %) by Region 2024 & 2032
- Figure 2: North America Keratometers Market Revenue (Million), by Country 2024 & 2032
- Figure 3: North America Keratometers Market Revenue Share (%), by Country 2024 & 2032
- Figure 4: Europe Keratometers Market Revenue (Million), by Country 2024 & 2032
- Figure 5: Europe Keratometers Market Revenue Share (%), by Country 2024 & 2032
- Figure 6: Asia Pacific Keratometers Market Revenue (Million), by Country 2024 & 2032
- Figure 7: Asia Pacific Keratometers Market Revenue Share (%), by Country 2024 & 2032
- Figure 8: Middle East and Africa Keratometers Market Revenue (Million), by Country 2024 & 2032
- Figure 9: Middle East and Africa Keratometers Market Revenue Share (%), by Country 2024 & 2032
- Figure 10: South America Keratometers Market Revenue (Million), by Country 2024 & 2032
- Figure 11: South America Keratometers Market Revenue Share (%), by Country 2024 & 2032
- Figure 12: North America Keratometers Market Revenue (Million), by Type 2024 & 2032
- Figure 13: North America Keratometers Market Revenue Share (%), by Type 2024 & 2032
- Figure 14: North America Keratometers Market Revenue (Million), by End User 2024 & 2032
- Figure 15: North America Keratometers Market Revenue Share (%), by End User 2024 & 2032
- Figure 16: North America Keratometers Market Revenue (Million), by Country 2024 & 2032
- Figure 17: North America Keratometers Market Revenue Share (%), by Country 2024 & 2032
- Figure 18: Europe Keratometers Market Revenue (Million), by Type 2024 & 2032
- Figure 19: Europe Keratometers Market Revenue Share (%), by Type 2024 & 2032
- Figure 20: Europe Keratometers Market Revenue (Million), by End User 2024 & 2032
- Figure 21: Europe Keratometers Market Revenue Share (%), by End User 2024 & 2032
- Figure 22: Europe Keratometers Market Revenue (Million), by Country 2024 & 2032
- Figure 23: Europe Keratometers Market Revenue Share (%), by Country 2024 & 2032
- Figure 24: Asia Pacific Keratometers Market Revenue (Million), by Type 2024 & 2032
- Figure 25: Asia Pacific Keratometers Market Revenue Share (%), by Type 2024 & 2032
- Figure 26: Asia Pacific Keratometers Market Revenue (Million), by End User 2024 & 2032
- Figure 27: Asia Pacific Keratometers Market Revenue Share (%), by End User 2024 & 2032
- Figure 28: Asia Pacific Keratometers Market Revenue (Million), by Country 2024 & 2032
- Figure 29: Asia Pacific Keratometers Market Revenue Share (%), by Country 2024 & 2032
- Figure 30: Middle East and Africa Keratometers Market Revenue (Million), by Type 2024 & 2032
- Figure 31: Middle East and Africa Keratometers Market Revenue Share (%), by Type 2024 & 2032
- Figure 32: Middle East and Africa Keratometers Market Revenue (Million), by End User 2024 & 2032
- Figure 33: Middle East and Africa Keratometers Market Revenue Share (%), by End User 2024 & 2032
- Figure 34: Middle East and Africa Keratometers Market Revenue (Million), by Country 2024 & 2032
- Figure 35: Middle East and Africa Keratometers Market Revenue Share (%), by Country 2024 & 2032
- Figure 36: South America Keratometers Market Revenue (Million), by Type 2024 & 2032
- Figure 37: South America Keratometers Market Revenue Share (%), by Type 2024 & 2032
- Figure 38: South America Keratometers Market Revenue (Million), by End User 2024 & 2032
- Figure 39: South America Keratometers Market Revenue Share (%), by End User 2024 & 2032
- Figure 40: South America Keratometers Market Revenue (Million), by Country 2024 & 2032
- Figure 41: South America Keratometers Market Revenue Share (%), by Country 2024 & 2032
List of Tables
- Table 1: Global Keratometers Market Revenue Million Forecast, by Region 2019 & 2032
- Table 2: Global Keratometers Market Revenue Million Forecast, by Type 2019 & 2032
- Table 3: Global Keratometers Market Revenue Million Forecast, by End User 2019 & 2032
- Table 4: Global Keratometers Market Revenue Million Forecast, by Region 2019 & 2032
- Table 5: Global Keratometers Market Revenue Million Forecast, by Country 2019 & 2032
- Table 6: United States Keratometers Market Revenue (Million) Forecast, by Application 2019 & 2032
- Table 7: Canada Keratometers Market Revenue (Million) Forecast, by Application 2019 & 2032
- Table 8: Mexico Keratometers Market Revenue (Million) Forecast, by Application 2019 & 2032
- Table 9: Global Keratometers Market Revenue Million Forecast, by Country 2019 & 2032
- Table 10: Germany Keratometers Market Revenue (Million) Forecast, by Application 2019 & 2032
- Table 11: United Kingdom Keratometers Market Revenue (Million) Forecast, by Application 2019 & 2032
- Table 12: France Keratometers Market Revenue (Million) Forecast, by Application 2019 & 2032
- Table 13: Italy Keratometers Market Revenue (Million) Forecast, by Application 2019 & 2032
- Table 14: Spain Keratometers Market Revenue (Million) Forecast, by Application 2019 & 2032
- Table 15: Rest of Europe Keratometers Market Revenue (Million) Forecast, by Application 2019 & 2032
- Table 16: Global Keratometers Market Revenue Million Forecast, by Country 2019 & 2032
- Table 17: China Keratometers Market Revenue (Million) Forecast, by Application 2019 & 2032
- Table 18: Japan Keratometers Market Revenue (Million) Forecast, by Application 2019 & 2032
- Table 19: India Keratometers Market Revenue (Million) Forecast, by Application 2019 & 2032
- Table 20: Australia Keratometers Market Revenue (Million) Forecast, by Application 2019 & 2032
- Table 21: South Korea Keratometers Market Revenue (Million) Forecast, by Application 2019 & 2032
- Table 22: Rest of Asia Pacific Keratometers Market Revenue (Million) Forecast, by Application 2019 & 2032
- Table 23: Global Keratometers Market Revenue Million Forecast, by Country 2019 & 2032
- Table 24: GCC Keratometers Market Revenue (Million) Forecast, by Application 2019 & 2032
- Table 25: South Africa Keratometers Market Revenue (Million) Forecast, by Application 2019 & 2032
- Table 26: Rest of Middle East and Africa Keratometers Market Revenue (Million) Forecast, by Application 2019 & 2032
- Table 27: Global Keratometers Market Revenue Million Forecast, by Country 2019 & 2032
- Table 28: Brazil Keratometers Market Revenue (Million) Forecast, by Application 2019 & 2032
- Table 29: Argentina Keratometers Market Revenue (Million) Forecast, by Application 2019 & 2032
- Table 30: Rest of South America Keratometers Market Revenue (Million) Forecast, by Application 2019 & 2032
- Table 31: Global Keratometers Market Revenue Million Forecast, by Type 2019 & 2032
- Table 32: Global Keratometers Market Revenue Million Forecast, by End User 2019 & 2032
- Table 33: Global Keratometers Market Revenue Million Forecast, by Country 2019 & 2032
- Table 34: United States Keratometers Market Revenue (Million) Forecast, by Application 2019 & 2032
- Table 35: Canada Keratometers Market Revenue (Million) Forecast, by Application 2019 & 2032
- Table 36: Mexico Keratometers Market Revenue (Million) Forecast, by Application 2019 & 2032
- Table 37: Global Keratometers Market Revenue Million Forecast, by Type 2019 & 2032
- Table 38: Global Keratometers Market Revenue Million Forecast, by End User 2019 & 2032
- Table 39: Global Keratometers Market Revenue Million Forecast, by Country 2019 & 2032
- Table 40: Germany Keratometers Market Revenue (Million) Forecast, by Application 2019 & 2032
- Table 41: United Kingdom Keratometers Market Revenue (Million) Forecast, by Application 2019 & 2032
- Table 42: France Keratometers Market Revenue (Million) Forecast, by Application 2019 & 2032
- Table 43: Italy Keratometers Market Revenue (Million) Forecast, by Application 2019 & 2032
- Table 44: Spain Keratometers Market Revenue (Million) Forecast, by Application 2019 & 2032
- Table 45: Rest of Europe Keratometers Market Revenue (Million) Forecast, by Application 2019 & 2032
- Table 46: Global Keratometers Market Revenue Million Forecast, by Type 2019 & 2032
- Table 47: Global Keratometers Market Revenue Million Forecast, by End User 2019 & 2032
- Table 48: Global Keratometers Market Revenue Million Forecast, by Country 2019 & 2032
- Table 49: China Keratometers Market Revenue (Million) Forecast, by Application 2019 & 2032
- Table 50: Japan Keratometers Market Revenue (Million) Forecast, by Application 2019 & 2032
- Table 51: India Keratometers Market Revenue (Million) Forecast, by Application 2019 & 2032
- Table 52: Australia Keratometers Market Revenue (Million) Forecast, by Application 2019 & 2032
- Table 53: South Korea Keratometers Market Revenue (Million) Forecast, by Application 2019 & 2032
- Table 54: Rest of Asia Pacific Keratometers Market Revenue (Million) Forecast, by Application 2019 & 2032
- Table 55: Global Keratometers Market Revenue Million Forecast, by Type 2019 & 2032
- Table 56: Global Keratometers Market Revenue Million Forecast, by End User 2019 & 2032
- Table 57: Global Keratometers Market Revenue Million Forecast, by Country 2019 & 2032
- Table 58: GCC Keratometers Market Revenue (Million) Forecast, by Application 2019 & 2032
- Table 59: South Africa Keratometers Market Revenue (Million) Forecast, by Application 2019 & 2032
- Table 60: Rest of Middle East and Africa Keratometers Market Revenue (Million) Forecast, by Application 2019 & 2032
- Table 61: Global Keratometers Market Revenue Million Forecast, by Type 2019 & 2032
- Table 62: Global Keratometers Market Revenue Million Forecast, by End User 2019 & 2032
- Table 63: Global Keratometers Market Revenue Million Forecast, by Country 2019 & 2032
- Table 64: Brazil Keratometers Market Revenue (Million) Forecast, by Application 2019 & 2032
- Table 65: Argentina Keratometers Market Revenue (Million) Forecast, by Application 2019 & 2032
- Table 66: Rest of South America Keratometers Market Revenue (Million) Forecast, by Application 2019 & 2032
Frequently Asked Questions
1. What is the projected Compound Annual Growth Rate (CAGR) of the Keratometers Market?
The projected CAGR is approximately 5.54%.
2. Which companies are prominent players in the Keratometers Market?
Key companies in the market include SHIGIYA MACHINERY WORKS LTD GS Division, Visionix (Luneau Technology), Micro Medical Devices, Essilor, Costruzione Strumenti Oftalmici, Reichert Inc, Carl Zeiss AG, Naugra Medical, Topcon Corporation, Canon Medical Systems Corporation*List Not Exhaustive, NIDEK CO LTD, TOMEY GmbH.
3. What are the main segments of the Keratometers Market?
The market segments include Type, End User.
4. Can you provide details about the market size?
The market size is estimated to be USD 308.84 Million as of 2022.
5. What are some drivers contributing to market growth?
Increasing Burden of Eye Disorders; Growing Investments. Funds. and Grants on Eye Care Devices.
6. What are the notable trends driving market growth?
Hospitals are Expected to Hold a Significant Market Share Over the Forecast Period.
7. Are there any restraints impacting market growth?
Lack of Primary Infrastructure For Eye Related Diseases in Underdeveloped and Developing Countries.
8. Can you provide examples of recent developments in the market?
June 2023: EssilorLuxottica and the World Society of Paediatric Ophthalmology and Strabismus collaborated to advance knowledge and education of myopia management globally. This collaboration is expected to contribute to educating further and help eye care professionals successfully integrate myopia management in practice and guide their patients on how to manage their myopia.
9. What pricing options are available for accessing the report?
Pricing options include single-user, multi-user, and enterprise licenses priced at USD 4750, USD 5250, and USD 8750 respectively.
10. Is the market size provided in terms of value or volume?
The market size is provided in terms of value, measured in Million.
11. Are there any specific market keywords associated with the report?
Yes, the market keyword associated with the report is "Keratometers Market," which aids in identifying and referencing the specific market segment covered.
12. How do I determine which pricing option suits my needs best?
The pricing options vary based on user requirements and access needs. Individual users may opt for single-user licenses, while businesses requiring broader access may choose multi-user or enterprise licenses for cost-effective access to the report.
13. Are there any additional resources or data provided in the Keratometers Market report?
While the report offers comprehensive insights, it's advisable to review the specific contents or supplementary materials provided to ascertain if additional resources or data are available.
14. How can I stay updated on further developments or reports in the Keratometers Market?
To stay informed about further developments, trends, and reports in the Keratometers Market, consider subscribing to industry newsletters, following relevant companies and organizations, or regularly checking reputable industry news sources and publications.
Methodology
Step 1 - Identification of Relevant Samples Size from Population Database


Step 2 - Approaches for Defining Global Market Size (Value, Volume* & Price*)

Note*: In applicable scenarios
Step 3 - Data Sources
Primary Research
- Web Analytics
- Survey Reports
- Research Institute
- Latest Research Reports
- Opinion Leaders
Secondary Research
- Annual Reports
- White Paper
- Latest Press Release
- Industry Association
- Paid Database
- Investor Presentations

Step 4 - Data Triangulation
Involves using different sources of information in order to increase the validity of a study
These sources are likely to be stakeholders in a program - participants, other researchers, program staff, other community members, and so on.
Then we put all data in single framework & apply various statistical tools to find out the dynamic on the market.
During the analysis stage, feedback from the stakeholder groups would be compared to determine areas of agreement as well as areas of divergence
