

Key Insights
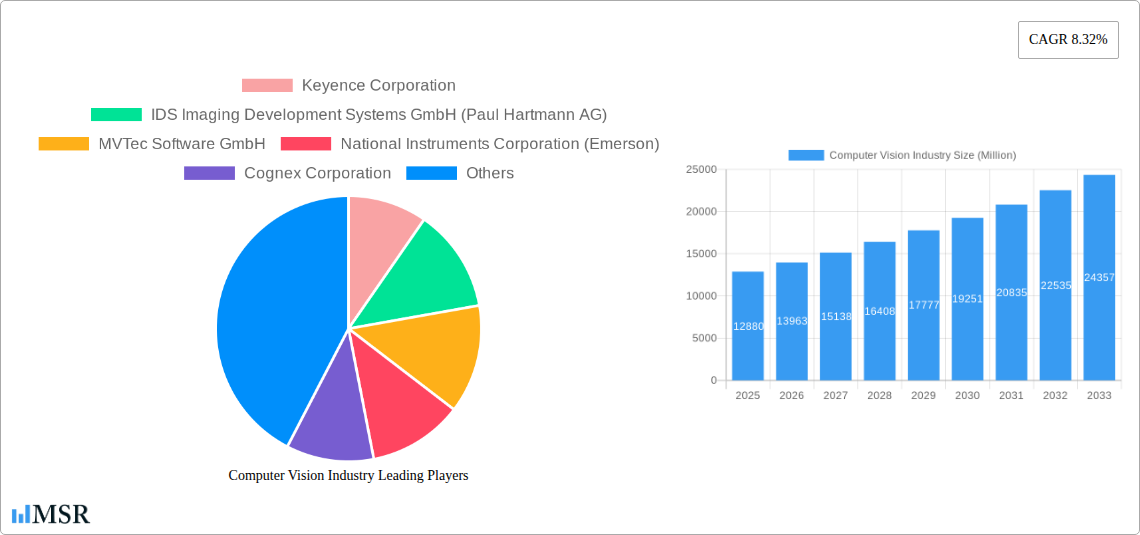
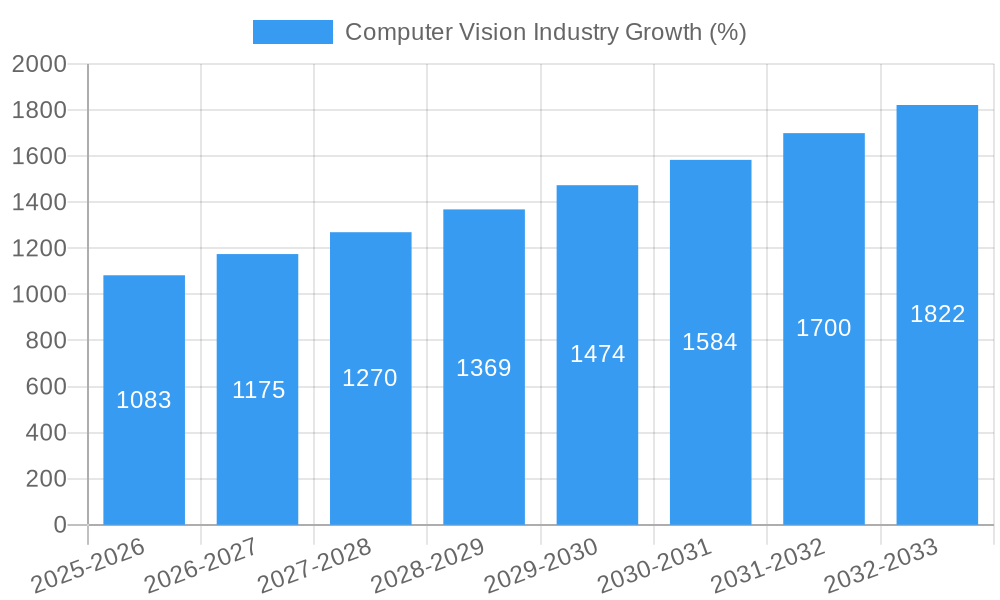
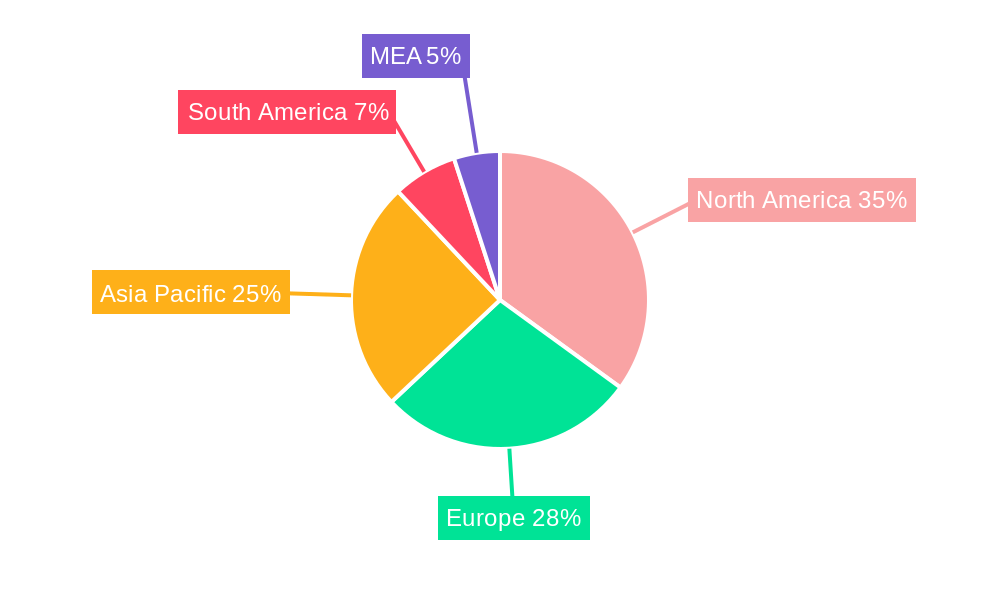
The computer vision market, valued at $12.88 billion in 2025, is projected to experience robust growth, driven by increasing automation across various sectors and advancements in artificial intelligence (AI). A compound annual growth rate (CAGR) of 8.32% from 2025 to 2033 indicates significant expansion, reaching an estimated market size of approximately $26.5 billion by 2033. Key drivers include the rising demand for automated quality control in manufacturing, the proliferation of smart cameras in surveillance and security systems, and the increasing adoption of computer vision in autonomous vehicles. The market is segmented by component (hardware and software), product (PC-based and smart camera-based), and end-user industry (food and beverage, healthcare, logistics, automotive, electronics, and others). Software solutions are witnessing rapid growth due to the development of sophisticated algorithms and the availability of cloud-based platforms. Smart camera-based systems are gaining traction due to their ease of deployment and integration. Geographically, North America and Asia Pacific currently dominate the market, but emerging economies in regions like South America and the Middle East and Africa are expected to show significant growth potential in the coming years. The competitive landscape is characterized by a mix of established players like Keyence, Cognex, and Teledyne DALSA, and innovative startups focusing on niche applications.
The continued development of deep learning techniques is expected to further fuel market expansion. Enhanced image processing capabilities, improved accuracy in object recognition, and the decreasing cost of hardware components are further contributing factors. However, challenges such as data privacy concerns, the need for high-quality training data, and the complexity of integrating computer vision systems into existing infrastructure could potentially restrain market growth. Despite these challenges, the overall outlook for the computer vision market remains positive, fueled by the ongoing technological advancements and increasing adoption across a wide spectrum of industries. The market's future success hinges on the continuous development of more robust, reliable, and cost-effective solutions catering to diverse industry-specific needs.
Computer Vision Industry Market Report: 2019-2033
This comprehensive report provides a detailed analysis of the Computer Vision industry, encompassing market size, growth drivers, key players, and future trends. With a study period spanning 2019-2033, a base year of 2025, and a forecast period of 2025-2033, this report is an invaluable resource for industry stakeholders, investors, and strategic decision-makers. The global Computer Vision market is projected to reach xx Million by 2033, exhibiting a robust CAGR of xx% during the forecast period.
Computer Vision Industry Market Concentration & Dynamics
The Computer Vision industry is characterized by a moderately concentrated market structure, with a few major players holding significant market share. Keyence Corporation, Cognex Corporation, and Omron Corporation are among the leading companies, collectively accounting for an estimated xx% of the global market in 2025. However, the market is also witnessing increasing participation from smaller, specialized firms, particularly in niche segments like software solutions and specialized hardware components.
The industry's dynamics are shaped by several key factors:
- Innovation Ecosystems: Rapid technological advancements, particularly in deep learning and AI, are driving continuous product innovation and market expansion. The emergence of open-source platforms and collaborative research initiatives further fuels innovation.
- Regulatory Frameworks: Government regulations concerning data privacy and security are increasingly influencing the development and deployment of Computer Vision technologies, particularly in sensitive sectors like healthcare and surveillance.
- Substitute Products: While Computer Vision offers unique capabilities, alternative technologies like traditional sensor systems and manual inspection methods remain relevant in certain applications. The competitive landscape is further shaped by the increasing adoption of alternative technologies.
- End-User Trends: The growing adoption of automation across various industries, coupled with the increasing demand for enhanced productivity and efficiency, is a key driver of Computer Vision market growth. Specific end-user trends are analyzed in detail later in this report.
- M&A Activities: The Computer Vision industry has witnessed several mergers and acquisitions in recent years, with larger companies acquiring smaller firms to expand their product portfolios and market reach. The number of M&A deals in the period 2019-2024 is estimated at xx, indicating a moderate level of consolidation.
Computer Vision Industry Industry Insights & Trends
The global Computer Vision market is experiencing significant growth, driven by several key factors. The market size is estimated at xx Million in 2025 and is projected to reach xx Million by 2033, exhibiting a Compound Annual Growth Rate (CAGR) of xx%. This substantial growth is fuelled by the increasing demand for automation across various industries, particularly in manufacturing, logistics, and healthcare. Technological advancements, such as the development of more powerful and efficient processors, sophisticated algorithms, and improved sensor technologies, are further propelling market expansion.
The rising adoption of artificial intelligence (AI) and machine learning (ML) in Computer Vision applications is also a major contributor to market growth. AI-powered Computer Vision systems offer improved accuracy, speed, and scalability, making them suitable for a wide range of applications. Moreover, the decreasing cost of hardware components, including cameras, sensors, and processing units, is making Computer Vision technology more accessible to businesses of all sizes. Evolving consumer behaviors, such as the growing preference for personalized experiences and efficient service delivery, are driving demand for advanced Computer Vision solutions in sectors like retail and e-commerce.
Key Markets & Segments Leading Computer Vision Industry
The Computer Vision market is geographically diverse, with significant contributions from North America, Europe, and Asia-Pacific. However, the Asia-Pacific region is expected to exhibit the fastest growth rate during the forecast period, driven by factors such as the rapid industrialization and rising adoption of automation in countries like China, Japan, and India.
By Component: The hardware segment currently dominates the market, representing approximately xx% of the total market value in 2025. However, the software segment is experiencing faster growth, driven by increasing demand for advanced algorithms and analytics.
By Product: Smart Camera-based systems are gaining significant traction, accounting for xx% of the market in 2025, due to their ease of integration and cost-effectiveness. However, PC-based systems still retain a significant market share, owing to their versatility and adaptability to complex applications.
By End-user Industry: The Automotive, Electronics and Semiconductors, and Logistics and Retail industries are the key end-user segments driving market growth. The Automotive sector is witnessing robust adoption of Computer Vision technologies in Advanced Driver-Assistance Systems (ADAS) and autonomous driving, whereas the Electronics and Semiconductors sectors utilize Computer Vision for quality control and inspection. Logistics and Retail are also increasingly leveraging Computer Vision for enhanced efficiency and security.
Automotive: High demand for driverless vehicles and ADAS.
Electronics and Semiconductors: Stringent quality control needs and automated manufacturing.
Logistics and Retail: Optimized supply chains and enhanced customer experience.
The dominance of these segments is attributed to several factors, including high investments in automation, stringent quality control requirements, and the availability of skilled workforce.
Computer Vision Industry Product Developments
Recent advancements in Computer Vision include the development of more efficient algorithms, improved sensor technologies, and the integration of AI and ML capabilities. These developments have led to the creation of more accurate, robust, and versatile Computer Vision systems, expanding their applicability across diverse industries. Key innovations include advanced image processing techniques, improved object detection and recognition algorithms, and the development of specialized hardware for real-time processing. The emergence of edge computing is enabling the deployment of Computer Vision solutions in resource-constrained environments, while advancements in 3D vision technologies are opening new possibilities in robotics, augmented reality (AR), and other applications. These developments offer significant competitive advantages to companies by improving accuracy, efficiency, and cost-effectiveness.
Challenges in the Computer Vision Industry Market
The Computer Vision industry faces several challenges, including high initial investment costs, the need for specialized expertise, data privacy and security concerns, and the potential for algorithmic bias. Supply chain disruptions can impact the availability of key components, while intense competition among established players and new entrants creates pressure on pricing and profitability. Regulatory hurdles can also hamper market expansion, especially in sectors with stringent data protection regulations. These challenges could potentially restrain market growth in the near term.
Forces Driving Computer Vision Industry Growth
Technological advancements, particularly in deep learning, AI, and improved sensor technology, are driving significant growth. Increasing automation needs across diverse sectors like manufacturing, healthcare, and logistics are creating high demand. Government initiatives promoting technological adoption and R&D funding are further bolstering the sector.
Challenges in the Computer Vision Industry Market
Long-term growth catalysts include partnerships between tech companies and industry leaders to develop tailored solutions, expansion into new emerging markets, and continuous innovation in algorithms and hardware.
Emerging Opportunities in Computer Vision Industry
Emerging opportunities exist in areas like medical imaging analysis, improved drone technology for inspection and mapping, security and surveillance enhancements, and increased agricultural precision through automated crop monitoring. The increasing adoption of Computer Vision in smart cities and the integration of Computer Vision into IoT devices present substantial growth potential.
Leading Players in the Computer Vision Industry Sector
- Keyence Corporation
- IDS Imaging Development Systems GmbH (Paul Hartmann AG)
- MVTec Software GmbH
- National Instruments Corporation (Emerson)
- Cognex Corporation
- Teledyne DALSA (Teledyne Technologies Company)
- Isra Vision AG (Atlas Copco Group)
- Omron Corporation
- Toshiba Corporation
- Sony Group Corporation
Key Milestones in Computer Vision Industry Industry
- October 2023: Keyence Corporation launched its new VS series smart camera vision systems, featuring advanced lens control technology. This significantly improves the adaptability and usability of smart cameras.
- November 2023: Basler AG and MVTec Software GmbH partnered with Siemens to integrate machine vision solutions directly into customers' automation systems, simplifying implementation and lowering barriers to entry.
Strategic Outlook for Computer Vision Industry Market
The Computer Vision market presents significant long-term growth potential driven by ongoing technological advancements, expanding applications across diverse industries, and increasing demand for automation and efficiency. Strategic opportunities for companies involve investing in R&D to develop advanced algorithms and hardware, forging strategic partnerships to expand market reach, and focusing on developing specialized solutions for niche market segments. Companies that can effectively address the challenges related to data privacy, security, and ethical considerations will be well-positioned to capitalize on the immense growth opportunities within this dynamic market.
Computer Vision Industry Segmentation
-
1. Component
-
1.1. Hardware
- 1.1.1. Vision Systems
- 1.1.2. Cameras
- 1.1.3. Optics and Illumination Systems
- 1.1.4. Frame Grabbers
- 1.1.5. Other Types of Hardware
- 1.2. Software
-
1.1. Hardware
-
2. Product
- 2.1. PC-based
- 2.2. Smart Camera-based
-
3. End-user Industry
- 3.1. Food and Beverage
- 3.2. Healthcare and Pharmaceutical
- 3.3. Logistics and Retail
- 3.4. Automotive
- 3.5. Electronics and Semiconductors
- 3.6. Other End-user Industries
Computer Vision Industry Segmentation By Geography
-
1. North America
- 1.1. United States
- 1.2. Canada
-
2. Europe
- 2.1. Germany
- 2.2. United Kingdom
- 2.3. France
- 2.4. Italy
- 2.5. Spain
-
3. Asia
- 3.1. China
- 3.2. Japan
- 3.3. South Korea
- 3.4. India
- 4. Australia and New Zealand
Computer Vision Industry REPORT HIGHLIGHTS
| Aspects | Details |
|---|---|
| Study Period | 2019-2033 |
| Base Year | 2024 |
| Estimated Year | 2025 |
| Forecast Period | 2025-2033 |
| Historical Period | 2019-2024 |
| Growth Rate | CAGR of 8.32% from 2019-2033 |
| Segmentation |
|
Table of Contents
- 1. Introduction
- 1.1. Research Scope
- 1.2. Market Segmentation
- 1.3. Research Methodology
- 1.4. Definitions and Assumptions
- 2. Executive Summary
- 2.1. Introduction
- 3. Market Dynamics
- 3.1. Introduction
- 3.2. Market Drivers
- 3.2.1. Rising Need for Quality Inspections; Increasing Demand for Vision-guided Robotic Systems
- 3.3. Market Restrains
- 3.3.1. Scarcity of Flexible Machine Vision Solutions
- 3.4. Market Trends
- 3.4.1. Cameras to be the Largest Hardware Segment
- 4. Market Factor Analysis
- 4.1. Porters Five Forces
- 4.2. Supply/Value Chain
- 4.3. PESTEL analysis
- 4.4. Market Entropy
- 4.5. Patent/Trademark Analysis
- 5. Global Computer Vision Industry Analysis, Insights and Forecast, 2019-2031
- 5.1. Market Analysis, Insights and Forecast - by Component
- 5.1.1. Hardware
- 5.1.1.1. Vision Systems
- 5.1.1.2. Cameras
- 5.1.1.3. Optics and Illumination Systems
- 5.1.1.4. Frame Grabbers
- 5.1.1.5. Other Types of Hardware
- 5.1.2. Software
- 5.1.1. Hardware
- 5.2. Market Analysis, Insights and Forecast - by Product
- 5.2.1. PC-based
- 5.2.2. Smart Camera-based
- 5.3. Market Analysis, Insights and Forecast - by End-user Industry
- 5.3.1. Food and Beverage
- 5.3.2. Healthcare and Pharmaceutical
- 5.3.3. Logistics and Retail
- 5.3.4. Automotive
- 5.3.5. Electronics and Semiconductors
- 5.3.6. Other End-user Industries
- 5.4. Market Analysis, Insights and Forecast - by Region
- 5.4.1. North America
- 5.4.2. Europe
- 5.4.3. Asia
- 5.4.4. Australia and New Zealand
- 5.1. Market Analysis, Insights and Forecast - by Component
- 6. North America Computer Vision Industry Analysis, Insights and Forecast, 2019-2031
- 6.1. Market Analysis, Insights and Forecast - by Component
- 6.1.1. Hardware
- 6.1.1.1. Vision Systems
- 6.1.1.2. Cameras
- 6.1.1.3. Optics and Illumination Systems
- 6.1.1.4. Frame Grabbers
- 6.1.1.5. Other Types of Hardware
- 6.1.2. Software
- 6.1.1. Hardware
- 6.2. Market Analysis, Insights and Forecast - by Product
- 6.2.1. PC-based
- 6.2.2. Smart Camera-based
- 6.3. Market Analysis, Insights and Forecast - by End-user Industry
- 6.3.1. Food and Beverage
- 6.3.2. Healthcare and Pharmaceutical
- 6.3.3. Logistics and Retail
- 6.3.4. Automotive
- 6.3.5. Electronics and Semiconductors
- 6.3.6. Other End-user Industries
- 6.1. Market Analysis, Insights and Forecast - by Component
- 7. Europe Computer Vision Industry Analysis, Insights and Forecast, 2019-2031
- 7.1. Market Analysis, Insights and Forecast - by Component
- 7.1.1. Hardware
- 7.1.1.1. Vision Systems
- 7.1.1.2. Cameras
- 7.1.1.3. Optics and Illumination Systems
- 7.1.1.4. Frame Grabbers
- 7.1.1.5. Other Types of Hardware
- 7.1.2. Software
- 7.1.1. Hardware
- 7.2. Market Analysis, Insights and Forecast - by Product
- 7.2.1. PC-based
- 7.2.2. Smart Camera-based
- 7.3. Market Analysis, Insights and Forecast - by End-user Industry
- 7.3.1. Food and Beverage
- 7.3.2. Healthcare and Pharmaceutical
- 7.3.3. Logistics and Retail
- 7.3.4. Automotive
- 7.3.5. Electronics and Semiconductors
- 7.3.6. Other End-user Industries
- 7.1. Market Analysis, Insights and Forecast - by Component
- 8. Asia Computer Vision Industry Analysis, Insights and Forecast, 2019-2031
- 8.1. Market Analysis, Insights and Forecast - by Component
- 8.1.1. Hardware
- 8.1.1.1. Vision Systems
- 8.1.1.2. Cameras
- 8.1.1.3. Optics and Illumination Systems
- 8.1.1.4. Frame Grabbers
- 8.1.1.5. Other Types of Hardware
- 8.1.2. Software
- 8.1.1. Hardware
- 8.2. Market Analysis, Insights and Forecast - by Product
- 8.2.1. PC-based
- 8.2.2. Smart Camera-based
- 8.3. Market Analysis, Insights and Forecast - by End-user Industry
- 8.3.1. Food and Beverage
- 8.3.2. Healthcare and Pharmaceutical
- 8.3.3. Logistics and Retail
- 8.3.4. Automotive
- 8.3.5. Electronics and Semiconductors
- 8.3.6. Other End-user Industries
- 8.1. Market Analysis, Insights and Forecast - by Component
- 9. Australia and New Zealand Computer Vision Industry Analysis, Insights and Forecast, 2019-2031
- 9.1. Market Analysis, Insights and Forecast - by Component
- 9.1.1. Hardware
- 9.1.1.1. Vision Systems
- 9.1.1.2. Cameras
- 9.1.1.3. Optics and Illumination Systems
- 9.1.1.4. Frame Grabbers
- 9.1.1.5. Other Types of Hardware
- 9.1.2. Software
- 9.1.1. Hardware
- 9.2. Market Analysis, Insights and Forecast - by Product
- 9.2.1. PC-based
- 9.2.2. Smart Camera-based
- 9.3. Market Analysis, Insights and Forecast - by End-user Industry
- 9.3.1. Food and Beverage
- 9.3.2. Healthcare and Pharmaceutical
- 9.3.3. Logistics and Retail
- 9.3.4. Automotive
- 9.3.5. Electronics and Semiconductors
- 9.3.6. Other End-user Industries
- 9.1. Market Analysis, Insights and Forecast - by Component
- 10. North America Computer Vision Industry Analysis, Insights and Forecast, 2019-2031
- 10.1. Market Analysis, Insights and Forecast - By Country/Sub-region
- 10.1.1 United States
- 10.1.2 Canada
- 10.1.3 Mexico
- 11. Europe Computer Vision Industry Analysis, Insights and Forecast, 2019-2031
- 11.1. Market Analysis, Insights and Forecast - By Country/Sub-region
- 11.1.1 Germany
- 11.1.2 United Kingdom
- 11.1.3 France
- 11.1.4 Spain
- 11.1.5 Italy
- 11.1.6 Spain
- 11.1.7 Belgium
- 11.1.8 Netherland
- 11.1.9 Nordics
- 11.1.10 Rest of Europe
- 12. Asia Pacific Computer Vision Industry Analysis, Insights and Forecast, 2019-2031
- 12.1. Market Analysis, Insights and Forecast - By Country/Sub-region
- 12.1.1 China
- 12.1.2 Japan
- 12.1.3 India
- 12.1.4 South Korea
- 12.1.5 Southeast Asia
- 12.1.6 Australia
- 12.1.7 Indonesia
- 12.1.8 Phillipes
- 12.1.9 Singapore
- 12.1.10 Thailandc
- 12.1.11 Rest of Asia Pacific
- 13. South America Computer Vision Industry Analysis, Insights and Forecast, 2019-2031
- 13.1. Market Analysis, Insights and Forecast - By Country/Sub-region
- 13.1.1 Brazil
- 13.1.2 Argentina
- 13.1.3 Peru
- 13.1.4 Chile
- 13.1.5 Colombia
- 13.1.6 Ecuador
- 13.1.7 Venezuela
- 13.1.8 Rest of South America
- 14. North America Computer Vision Industry Analysis, Insights and Forecast, 2019-2031
- 14.1. Market Analysis, Insights and Forecast - By Country/Sub-region
- 14.1.1 United States
- 14.1.2 Canada
- 14.1.3 Mexico
- 15. MEA Computer Vision Industry Analysis, Insights and Forecast, 2019-2031
- 15.1. Market Analysis, Insights and Forecast - By Country/Sub-region
- 15.1.1 United Arab Emirates
- 15.1.2 Saudi Arabia
- 15.1.3 South Africa
- 15.1.4 Rest of Middle East and Africa
- 16. Competitive Analysis
- 16.1. Global Market Share Analysis 2024
- 16.2. Company Profiles
- 16.2.1 Keyence Corporation
- 16.2.1.1. Overview
- 16.2.1.2. Products
- 16.2.1.3. SWOT Analysis
- 16.2.1.4. Recent Developments
- 16.2.1.5. Financials (Based on Availability)
- 16.2.2 IDS Imaging Development Systems GmbH (Paul Hartmann AG)
- 16.2.2.1. Overview
- 16.2.2.2. Products
- 16.2.2.3. SWOT Analysis
- 16.2.2.4. Recent Developments
- 16.2.2.5. Financials (Based on Availability)
- 16.2.3 MVTec Software GmbH
- 16.2.3.1. Overview
- 16.2.3.2. Products
- 16.2.3.3. SWOT Analysis
- 16.2.3.4. Recent Developments
- 16.2.3.5. Financials (Based on Availability)
- 16.2.4 National Instruments Corporation (Emerson)
- 16.2.4.1. Overview
- 16.2.4.2. Products
- 16.2.4.3. SWOT Analysis
- 16.2.4.4. Recent Developments
- 16.2.4.5. Financials (Based on Availability)
- 16.2.5 Cognex Corporation
- 16.2.5.1. Overview
- 16.2.5.2. Products
- 16.2.5.3. SWOT Analysis
- 16.2.5.4. Recent Developments
- 16.2.5.5. Financials (Based on Availability)
- 16.2.6 Teledyne DALSA (Teledyne Technologies Company)
- 16.2.6.1. Overview
- 16.2.6.2. Products
- 16.2.6.3. SWOT Analysis
- 16.2.6.4. Recent Developments
- 16.2.6.5. Financials (Based on Availability)
- 16.2.7 Isra Vision AG (Atlas Copco Group)
- 16.2.7.1. Overview
- 16.2.7.2. Products
- 16.2.7.3. SWOT Analysis
- 16.2.7.4. Recent Developments
- 16.2.7.5. Financials (Based on Availability)
- 16.2.8 Omron Corporation
- 16.2.8.1. Overview
- 16.2.8.2. Products
- 16.2.8.3. SWOT Analysis
- 16.2.8.4. Recent Developments
- 16.2.8.5. Financials (Based on Availability)
- 16.2.9 Toshiba Corporation
- 16.2.9.1. Overview
- 16.2.9.2. Products
- 16.2.9.3. SWOT Analysis
- 16.2.9.4. Recent Developments
- 16.2.9.5. Financials (Based on Availability)
- 16.2.10 Sony Group Corporation
- 16.2.10.1. Overview
- 16.2.10.2. Products
- 16.2.10.3. SWOT Analysis
- 16.2.10.4. Recent Developments
- 16.2.10.5. Financials (Based on Availability)
- 16.2.1 Keyence Corporation
List of Figures
- Figure 1: Global Computer Vision Industry Revenue Breakdown (Million, %) by Region 2024 & 2032
- Figure 2: North America Computer Vision Industry Revenue (Million), by Country 2024 & 2032
- Figure 3: North America Computer Vision Industry Revenue Share (%), by Country 2024 & 2032
- Figure 4: Europe Computer Vision Industry Revenue (Million), by Country 2024 & 2032
- Figure 5: Europe Computer Vision Industry Revenue Share (%), by Country 2024 & 2032
- Figure 6: Asia Pacific Computer Vision Industry Revenue (Million), by Country 2024 & 2032
- Figure 7: Asia Pacific Computer Vision Industry Revenue Share (%), by Country 2024 & 2032
- Figure 8: South America Computer Vision Industry Revenue (Million), by Country 2024 & 2032
- Figure 9: South America Computer Vision Industry Revenue Share (%), by Country 2024 & 2032
- Figure 10: North America Computer Vision Industry Revenue (Million), by Country 2024 & 2032
- Figure 11: North America Computer Vision Industry Revenue Share (%), by Country 2024 & 2032
- Figure 12: MEA Computer Vision Industry Revenue (Million), by Country 2024 & 2032
- Figure 13: MEA Computer Vision Industry Revenue Share (%), by Country 2024 & 2032
- Figure 14: North America Computer Vision Industry Revenue (Million), by Component 2024 & 2032
- Figure 15: North America Computer Vision Industry Revenue Share (%), by Component 2024 & 2032
- Figure 16: North America Computer Vision Industry Revenue (Million), by Product 2024 & 2032
- Figure 17: North America Computer Vision Industry Revenue Share (%), by Product 2024 & 2032
- Figure 18: North America Computer Vision Industry Revenue (Million), by End-user Industry 2024 & 2032
- Figure 19: North America Computer Vision Industry Revenue Share (%), by End-user Industry 2024 & 2032
- Figure 20: North America Computer Vision Industry Revenue (Million), by Country 2024 & 2032
- Figure 21: North America Computer Vision Industry Revenue Share (%), by Country 2024 & 2032
- Figure 22: Europe Computer Vision Industry Revenue (Million), by Component 2024 & 2032
- Figure 23: Europe Computer Vision Industry Revenue Share (%), by Component 2024 & 2032
- Figure 24: Europe Computer Vision Industry Revenue (Million), by Product 2024 & 2032
- Figure 25: Europe Computer Vision Industry Revenue Share (%), by Product 2024 & 2032
- Figure 26: Europe Computer Vision Industry Revenue (Million), by End-user Industry 2024 & 2032
- Figure 27: Europe Computer Vision Industry Revenue Share (%), by End-user Industry 2024 & 2032
- Figure 28: Europe Computer Vision Industry Revenue (Million), by Country 2024 & 2032
- Figure 29: Europe Computer Vision Industry Revenue Share (%), by Country 2024 & 2032
- Figure 30: Asia Computer Vision Industry Revenue (Million), by Component 2024 & 2032
- Figure 31: Asia Computer Vision Industry Revenue Share (%), by Component 2024 & 2032
- Figure 32: Asia Computer Vision Industry Revenue (Million), by Product 2024 & 2032
- Figure 33: Asia Computer Vision Industry Revenue Share (%), by Product 2024 & 2032
- Figure 34: Asia Computer Vision Industry Revenue (Million), by End-user Industry 2024 & 2032
- Figure 35: Asia Computer Vision Industry Revenue Share (%), by End-user Industry 2024 & 2032
- Figure 36: Asia Computer Vision Industry Revenue (Million), by Country 2024 & 2032
- Figure 37: Asia Computer Vision Industry Revenue Share (%), by Country 2024 & 2032
- Figure 38: Australia and New Zealand Computer Vision Industry Revenue (Million), by Component 2024 & 2032
- Figure 39: Australia and New Zealand Computer Vision Industry Revenue Share (%), by Component 2024 & 2032
- Figure 40: Australia and New Zealand Computer Vision Industry Revenue (Million), by Product 2024 & 2032
- Figure 41: Australia and New Zealand Computer Vision Industry Revenue Share (%), by Product 2024 & 2032
- Figure 42: Australia and New Zealand Computer Vision Industry Revenue (Million), by End-user Industry 2024 & 2032
- Figure 43: Australia and New Zealand Computer Vision Industry Revenue Share (%), by End-user Industry 2024 & 2032
- Figure 44: Australia and New Zealand Computer Vision Industry Revenue (Million), by Country 2024 & 2032
- Figure 45: Australia and New Zealand Computer Vision Industry Revenue Share (%), by Country 2024 & 2032
List of Tables
- Table 1: Global Computer Vision Industry Revenue Million Forecast, by Region 2019 & 2032
- Table 2: Global Computer Vision Industry Revenue Million Forecast, by Component 2019 & 2032
- Table 3: Global Computer Vision Industry Revenue Million Forecast, by Product 2019 & 2032
- Table 4: Global Computer Vision Industry Revenue Million Forecast, by End-user Industry 2019 & 2032
- Table 5: Global Computer Vision Industry Revenue Million Forecast, by Region 2019 & 2032
- Table 6: Global Computer Vision Industry Revenue Million Forecast, by Country 2019 & 2032
- Table 7: United States Computer Vision Industry Revenue (Million) Forecast, by Application 2019 & 2032
- Table 8: Canada Computer Vision Industry Revenue (Million) Forecast, by Application 2019 & 2032
- Table 9: Mexico Computer Vision Industry Revenue (Million) Forecast, by Application 2019 & 2032
- Table 10: Global Computer Vision Industry Revenue Million Forecast, by Country 2019 & 2032
- Table 11: Germany Computer Vision Industry Revenue (Million) Forecast, by Application 2019 & 2032
- Table 12: United Kingdom Computer Vision Industry Revenue (Million) Forecast, by Application 2019 & 2032
- Table 13: France Computer Vision Industry Revenue (Million) Forecast, by Application 2019 & 2032
- Table 14: Spain Computer Vision Industry Revenue (Million) Forecast, by Application 2019 & 2032
- Table 15: Italy Computer Vision Industry Revenue (Million) Forecast, by Application 2019 & 2032
- Table 16: Spain Computer Vision Industry Revenue (Million) Forecast, by Application 2019 & 2032
- Table 17: Belgium Computer Vision Industry Revenue (Million) Forecast, by Application 2019 & 2032
- Table 18: Netherland Computer Vision Industry Revenue (Million) Forecast, by Application 2019 & 2032
- Table 19: Nordics Computer Vision Industry Revenue (Million) Forecast, by Application 2019 & 2032
- Table 20: Rest of Europe Computer Vision Industry Revenue (Million) Forecast, by Application 2019 & 2032
- Table 21: Global Computer Vision Industry Revenue Million Forecast, by Country 2019 & 2032
- Table 22: China Computer Vision Industry Revenue (Million) Forecast, by Application 2019 & 2032
- Table 23: Japan Computer Vision Industry Revenue (Million) Forecast, by Application 2019 & 2032
- Table 24: India Computer Vision Industry Revenue (Million) Forecast, by Application 2019 & 2032
- Table 25: South Korea Computer Vision Industry Revenue (Million) Forecast, by Application 2019 & 2032
- Table 26: Southeast Asia Computer Vision Industry Revenue (Million) Forecast, by Application 2019 & 2032
- Table 27: Australia Computer Vision Industry Revenue (Million) Forecast, by Application 2019 & 2032
- Table 28: Indonesia Computer Vision Industry Revenue (Million) Forecast, by Application 2019 & 2032
- Table 29: Phillipes Computer Vision Industry Revenue (Million) Forecast, by Application 2019 & 2032
- Table 30: Singapore Computer Vision Industry Revenue (Million) Forecast, by Application 2019 & 2032
- Table 31: Thailandc Computer Vision Industry Revenue (Million) Forecast, by Application 2019 & 2032
- Table 32: Rest of Asia Pacific Computer Vision Industry Revenue (Million) Forecast, by Application 2019 & 2032
- Table 33: Global Computer Vision Industry Revenue Million Forecast, by Country 2019 & 2032
- Table 34: Brazil Computer Vision Industry Revenue (Million) Forecast, by Application 2019 & 2032
- Table 35: Argentina Computer Vision Industry Revenue (Million) Forecast, by Application 2019 & 2032
- Table 36: Peru Computer Vision Industry Revenue (Million) Forecast, by Application 2019 & 2032
- Table 37: Chile Computer Vision Industry Revenue (Million) Forecast, by Application 2019 & 2032
- Table 38: Colombia Computer Vision Industry Revenue (Million) Forecast, by Application 2019 & 2032
- Table 39: Ecuador Computer Vision Industry Revenue (Million) Forecast, by Application 2019 & 2032
- Table 40: Venezuela Computer Vision Industry Revenue (Million) Forecast, by Application 2019 & 2032
- Table 41: Rest of South America Computer Vision Industry Revenue (Million) Forecast, by Application 2019 & 2032
- Table 42: Global Computer Vision Industry Revenue Million Forecast, by Country 2019 & 2032
- Table 43: United States Computer Vision Industry Revenue (Million) Forecast, by Application 2019 & 2032
- Table 44: Canada Computer Vision Industry Revenue (Million) Forecast, by Application 2019 & 2032
- Table 45: Mexico Computer Vision Industry Revenue (Million) Forecast, by Application 2019 & 2032
- Table 46: Global Computer Vision Industry Revenue Million Forecast, by Country 2019 & 2032
- Table 47: United Arab Emirates Computer Vision Industry Revenue (Million) Forecast, by Application 2019 & 2032
- Table 48: Saudi Arabia Computer Vision Industry Revenue (Million) Forecast, by Application 2019 & 2032
- Table 49: South Africa Computer Vision Industry Revenue (Million) Forecast, by Application 2019 & 2032
- Table 50: Rest of Middle East and Africa Computer Vision Industry Revenue (Million) Forecast, by Application 2019 & 2032
- Table 51: Global Computer Vision Industry Revenue Million Forecast, by Component 2019 & 2032
- Table 52: Global Computer Vision Industry Revenue Million Forecast, by Product 2019 & 2032
- Table 53: Global Computer Vision Industry Revenue Million Forecast, by End-user Industry 2019 & 2032
- Table 54: Global Computer Vision Industry Revenue Million Forecast, by Country 2019 & 2032
- Table 55: United States Computer Vision Industry Revenue (Million) Forecast, by Application 2019 & 2032
- Table 56: Canada Computer Vision Industry Revenue (Million) Forecast, by Application 2019 & 2032
- Table 57: Global Computer Vision Industry Revenue Million Forecast, by Component 2019 & 2032
- Table 58: Global Computer Vision Industry Revenue Million Forecast, by Product 2019 & 2032
- Table 59: Global Computer Vision Industry Revenue Million Forecast, by End-user Industry 2019 & 2032
- Table 60: Global Computer Vision Industry Revenue Million Forecast, by Country 2019 & 2032
- Table 61: Germany Computer Vision Industry Revenue (Million) Forecast, by Application 2019 & 2032
- Table 62: United Kingdom Computer Vision Industry Revenue (Million) Forecast, by Application 2019 & 2032
- Table 63: France Computer Vision Industry Revenue (Million) Forecast, by Application 2019 & 2032
- Table 64: Italy Computer Vision Industry Revenue (Million) Forecast, by Application 2019 & 2032
- Table 65: Spain Computer Vision Industry Revenue (Million) Forecast, by Application 2019 & 2032
- Table 66: Global Computer Vision Industry Revenue Million Forecast, by Component 2019 & 2032
- Table 67: Global Computer Vision Industry Revenue Million Forecast, by Product 2019 & 2032
- Table 68: Global Computer Vision Industry Revenue Million Forecast, by End-user Industry 2019 & 2032
- Table 69: Global Computer Vision Industry Revenue Million Forecast, by Country 2019 & 2032
- Table 70: China Computer Vision Industry Revenue (Million) Forecast, by Application 2019 & 2032
- Table 71: Japan Computer Vision Industry Revenue (Million) Forecast, by Application 2019 & 2032
- Table 72: South Korea Computer Vision Industry Revenue (Million) Forecast, by Application 2019 & 2032
- Table 73: India Computer Vision Industry Revenue (Million) Forecast, by Application 2019 & 2032
- Table 74: Global Computer Vision Industry Revenue Million Forecast, by Component 2019 & 2032
- Table 75: Global Computer Vision Industry Revenue Million Forecast, by Product 2019 & 2032
- Table 76: Global Computer Vision Industry Revenue Million Forecast, by End-user Industry 2019 & 2032
- Table 77: Global Computer Vision Industry Revenue Million Forecast, by Country 2019 & 2032
Frequently Asked Questions
1. What is the projected Compound Annual Growth Rate (CAGR) of the Computer Vision Industry?
The projected CAGR is approximately 8.32%.
2. Which companies are prominent players in the Computer Vision Industry?
Key companies in the market include Keyence Corporation, IDS Imaging Development Systems GmbH (Paul Hartmann AG), MVTec Software GmbH, National Instruments Corporation (Emerson), Cognex Corporation, Teledyne DALSA (Teledyne Technologies Company), Isra Vision AG (Atlas Copco Group), Omron Corporation, Toshiba Corporation, Sony Group Corporation.
3. What are the main segments of the Computer Vision Industry?
The market segments include Component, Product, End-user Industry.
4. Can you provide details about the market size?
The market size is estimated to be USD 12.88 Million as of 2022.
5. What are some drivers contributing to market growth?
Rising Need for Quality Inspections; Increasing Demand for Vision-guided Robotic Systems.
6. What are the notable trends driving market growth?
Cameras to be the Largest Hardware Segment.
7. Are there any restraints impacting market growth?
Scarcity of Flexible Machine Vision Solutions.
8. Can you provide examples of recent developments in the market?
November 2023: Basler AG and MVTec Software GmbH partnered with Siemens to bring machine vision solutions directly to customers’ machines and systems. The new partnerships between Basler AG and Siemens enable customers to integrate machine vision apps directly into their automation technology. Siemens’ experience with industrial automation and digitization, combined with MVTec’s expertise in machine vision, reduces the complexity for customers. It significantly reduces the barrier to entry for machine vision solutions.
9. What pricing options are available for accessing the report?
Pricing options include single-user, multi-user, and enterprise licenses priced at USD 4750, USD 5250, and USD 8750 respectively.
10. Is the market size provided in terms of value or volume?
The market size is provided in terms of value, measured in Million.
11. Are there any specific market keywords associated with the report?
Yes, the market keyword associated with the report is "Computer Vision Industry," which aids in identifying and referencing the specific market segment covered.
12. How do I determine which pricing option suits my needs best?
The pricing options vary based on user requirements and access needs. Individual users may opt for single-user licenses, while businesses requiring broader access may choose multi-user or enterprise licenses for cost-effective access to the report.
13. Are there any additional resources or data provided in the Computer Vision Industry report?
While the report offers comprehensive insights, it's advisable to review the specific contents or supplementary materials provided to ascertain if additional resources or data are available.
14. How can I stay updated on further developments or reports in the Computer Vision Industry?
To stay informed about further developments, trends, and reports in the Computer Vision Industry, consider subscribing to industry newsletters, following relevant companies and organizations, or regularly checking reputable industry news sources and publications.
Methodology
Step 1 - Identification of Relevant Samples Size from Population Database


Step 2 - Approaches for Defining Global Market Size (Value, Volume* & Price*)

Note*: In applicable scenarios
Step 3 - Data Sources
Primary Research
- Web Analytics
- Survey Reports
- Research Institute
- Latest Research Reports
- Opinion Leaders
Secondary Research
- Annual Reports
- White Paper
- Latest Press Release
- Industry Association
- Paid Database
- Investor Presentations

Step 4 - Data Triangulation
Involves using different sources of information in order to increase the validity of a study
These sources are likely to be stakeholders in a program - participants, other researchers, program staff, other community members, and so on.
Then we put all data in single framework & apply various statistical tools to find out the dynamic on the market.
During the analysis stage, feedback from the stakeholder groups would be compared to determine areas of agreement as well as areas of divergence
