

Key Insights
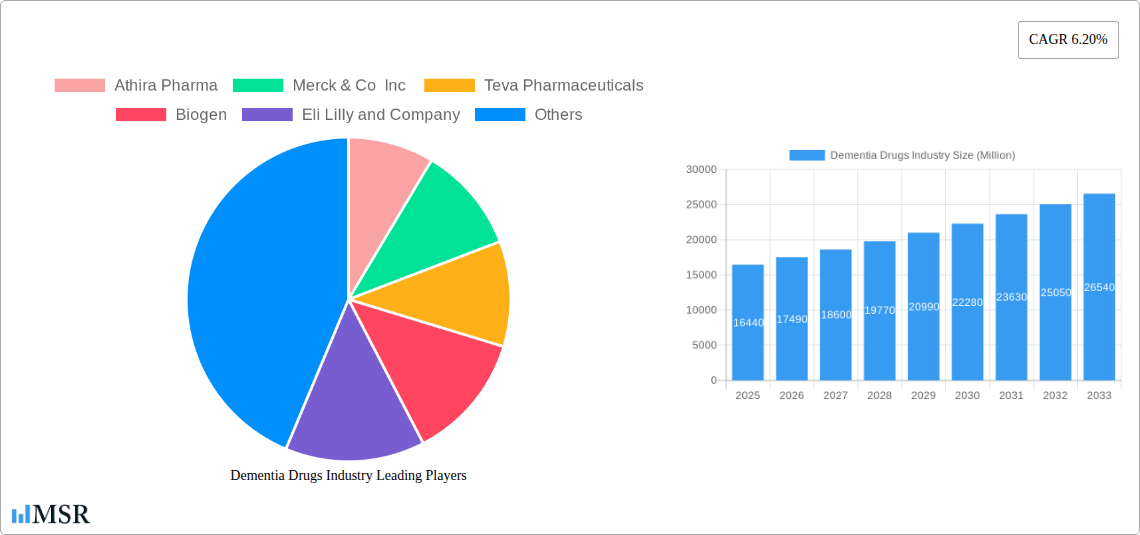
The Dementia Drugs market, valued at $16.44 billion in 2025, is projected to experience robust growth, driven by a rapidly aging global population and increasing prevalence of neurodegenerative diseases like Alzheimer's, Parkinson's disease dementia, and Lewy body dementia. A Compound Annual Growth Rate (CAGR) of 6.20% from 2025 to 2033 indicates significant market expansion. This growth is fueled by ongoing research and development efforts leading to the introduction of novel therapies targeting various disease mechanisms, including cholinergic deficits, glutamate excitotoxicity, and oxidative stress. The market is segmented by indication (Alzheimer's Disease holding the largest share due to its high prevalence) and drug class (Cholinesterase inhibitors currently dominate, but new glutamate and MAO inhibitors are expected to gain traction). Significant regional variations exist, with North America and Europe currently holding larger market shares due to higher healthcare expenditure and advanced healthcare infrastructure; however, the Asia-Pacific region is poised for substantial growth driven by rising awareness, improved healthcare access, and a burgeoning elderly population. Competition is fierce, with established pharmaceutical giants like Biogen, Eli Lilly, and Johnson & Johnson alongside emerging biotech companies like Athira Pharma vying for market dominance through innovative drug development and strategic partnerships.
The market's growth, however, is not without challenges. High drug costs, stringent regulatory approvals, and the inherent complexities of treating dementia contribute to market restraints. The long-term efficacy of current treatments and the unmet need for disease-modifying therapies remain significant obstacles. Nevertheless, the considerable unmet medical need and ongoing investment in research and development are expected to drive sustained expansion in the dementia drugs market. Further market segmentation analysis reveals significant opportunities for companies focusing on specific indications or developing targeted therapies. The success of future market players will depend upon their ability to bring innovative, effective, and cost-effective treatments to market.
Dementia Drugs Industry: A Comprehensive Market Report (2019-2033)
This comprehensive report provides a detailed analysis of the global Dementia Drugs market, offering invaluable insights for stakeholders across the pharmaceutical industry. With a study period spanning 2019-2033, a base year of 2025, and a forecast period of 2025-2033, this report is your essential guide to navigating this dynamic sector. The report covers key players like Merck & Co Inc, Biogen, Eli Lilly and Company, AstraZeneca, Johnson & Johnson, and many more, analyzing market segments by indication (Alzheimer's Disease, Lewy Body Dementia, Parkinson's Disease Dementia, Vascular Dementia, Other Indications) and drug class (MAO Inhibitors, Glutamate Inhibitors, Cholinesterase Inhibitors). The projected market size in 2025 is estimated at $XX Million.
Dementia Drugs Industry Market Concentration & Dynamics
The Dementia Drugs market exhibits a moderately concentrated landscape, with a few large multinational pharmaceutical companies holding significant market share. However, the increasing prevalence of dementia and ongoing R&D efforts are fostering a competitive environment with both established players and emerging biotech companies vying for market dominance. Market share data for 2024 shows that the top five players hold approximately 65% of the market. The market is characterized by a high level of innovation, driven by ongoing research into new drug targets and delivery mechanisms. Regulatory hurdles pose a significant challenge, influencing the speed of drug approvals and market entry. The market is also witnessing an increase in mergers and acquisitions (M&A) activity, as larger companies seek to expand their portfolios and gain a competitive edge. Recent M&A activity includes XX deals in the past two years, mostly focused on acquiring promising pipeline assets and smaller companies with innovative technologies. Substitute products, such as non-pharmacological interventions, present a growing challenge, especially in the management of mild to moderate dementia. End-user trends are shifting towards a greater emphasis on personalized medicine and the use of digital technologies to improve patient care.
Dementia Drugs Industry Insights & Trends
The global dementia drugs market is experiencing robust growth, driven by several key factors. The aging global population is a primary driver, with a significant rise in the number of individuals diagnosed with dementia. This has led to an increased demand for effective treatments, driving market expansion. The market's compound annual growth rate (CAGR) between 2025 and 2033 is projected to be xx%, reflecting strong and consistent market expansion. Technological advancements, such as the development of new drug targets and improved delivery systems, are further contributing to market growth. In addition, growing awareness and better diagnosis are facilitating earlier interventions, resulting in a higher number of patients entering treatment. Consumer behavior is increasingly influenced by the desire for personalized treatment plans, improved disease management strategies, and greater accessibility to information and resources.

Key Markets & Segments Leading Dementia Drugs Industry
Dominant Regions: North America and Europe currently hold the largest market share due to higher prevalence rates and greater healthcare spending. However, the Asia-Pacific region is projected to experience significant growth in the coming years, driven by rising healthcare expenditure and an expanding elderly population.
Dominant Indications: Alzheimer's disease dominates the market, accounting for the largest segment, followed by vascular dementia and Lewy body dementia. The market for other indications is expected to witness growth based on emerging research and treatments.
Dominant Drug Classes: Cholinesterase inhibitors currently hold a significant market share due to their established efficacy and widespread use. However, the development of new drugs in other classes, such as glutamate inhibitors and MAO inhibitors, is poised to increase the market share of these segments.
Drivers for Market Growth:
- Aging Population: The exponentially increasing global elderly population is a significant driver.
- Increased Awareness: Growing awareness and early diagnosis are increasing treatment rates.
- Technological Advancements: Innovation in drug delivery and identification of new targets are crucial factors.
- Rising Healthcare Expenditure: Increased investment in healthcare infrastructure and research supports the market.
The North American market holds a dominant position, influenced by factors such as advanced healthcare infrastructure, higher per capita income, and increased prevalence of dementia. However, the Asia-Pacific region shows promising potential for future growth.
Dementia Drugs Industry Product Developments
Recent years have witnessed significant advancements in dementia drug development. These include the development of new drug molecules targeting various disease pathways, as well as novel drug delivery systems aimed at improving patient compliance and efficacy. The approval of ADLARITY (donepezil transdermal system) by the FDA represents a substantial advancement in treatment options for Alzheimer's disease. Similarly, the registration of MIOREOL in Russia and the Eurasian Economic Union reflects a significant step towards providing diverse treatment options globally. These developments are continually reshaping the competitive landscape and offer hope for more effective treatments in the future.
Challenges in the Dementia Drugs Industry Market
The dementia drugs market faces various challenges, including the high cost of drug development and approval, regulatory hurdles, and a long and complex drug development pipeline. Supply chain disruptions due to geopolitical factors or manufacturing bottlenecks can also affect market accessibility and prices. Intense competition among established pharmaceutical companies and emerging biotech firms for market share presents additional challenges. These factors can cause significant delays in drug development and market access.
Forces Driving Dementia Drugs Industry Growth
Several factors drive the growth of the dementia drugs market. The escalating prevalence of dementia fueled by an aging global population is the primary force. Technological advancements, like the development of novel drug therapies and improved diagnostic tools, significantly contribute. Favorable regulatory environments that facilitate drug approval and market entry also contribute to market expansion. Finally, increasing government initiatives and healthcare funding for dementia research and treatment play a vital role.
Long-Term Growth Catalysts in the Dementia Drugs Industry
Long-term growth will be fueled by continuous innovation, strategic partnerships between pharmaceutical companies and research institutions, and expansion into emerging markets. The development of disease-modifying therapies and personalized medicine approaches represents a key catalyst. Investing in advanced research and development coupled with global market expansions will be critical for sustaining long-term growth.
Emerging Opportunities in Dementia Drugs Industry
Emerging opportunities include the development of novel biomarkers for early diagnosis, the use of digital technologies to improve patient care and monitoring, and the expansion into underserved markets. Further opportunities lie in developing personalized treatment approaches based on individual patient characteristics, combined with preventative strategies targeting early risk factors for dementia.
Leading Players in the Dementia Drugs Industry Sector
- Athira Pharma
- Merck & Co Inc
- Teva Pharmaceuticals
- Biogen
- Eli Lilly and Company
- AstraZeneca
- Johnson & Johnson
- SK Capital (Apotex Pharmaceutical Holdings Inc)
- Aurobindo Pharma
- Eisai Co Ltd
- Annovis Bio
- Zydus Cadila
- GlaxoSmithKline PLC
- Pfizer Inc
Key Milestones in Dementia Drugs Industry
- March 2022: Corium, Inc. received United States FDA approval for ADLARITY (donepezil transdermal system) for Alzheimer's disease.
- April 2022: NovaMedica developed and registered MIOREOL, a combination of Donepezil and Memantine, in Russia and the Eurasian Economic Union.
Strategic Outlook for Dementia Drugs Industry Market
The future of the dementia drugs market is bright, with significant growth potential driven by an aging global population and ongoing research and development efforts. Strategic opportunities include focusing on early disease detection, developing disease-modifying therapies, and expanding into emerging markets. Companies that invest in innovation and strategic partnerships will be best positioned for success in this growing market.
Dementia Drugs Industry Segmentation
-
1. Indications
- 1.1. Lewy Body Dementia
- 1.2. Parkinson's Disease Dementia
- 1.3. Alzheimer's Disease
- 1.4. Vascular Dementia
- 1.5. Other Indications
-
2. Drug Class
- 2.1. MAO Inhibitors
- 2.2. Glutamate Inhibitors
- 2.3. Cholinesterase Inhibitors
Dementia Drugs Industry Segmentation By Geography
-
1. North America
- 1.1. United States
- 1.2. Canada
- 1.3. Mexico
-
2. Europe
- 2.1. Germany
- 2.2. United Kingdom
- 2.3. France
- 2.4. Italy
- 2.5. Spain
- 2.6. Rest of Europe
-
3. Asia Pacific
- 3.1. China
- 3.2. Japan
- 3.3. India
- 3.4. Australia
- 3.5. South Korea
- 3.6. Rest of Asia Pacific
-
4. Middle East and Africa
- 4.1. GCC
- 4.2. South Africa
- 4.3. Rest of Middle East and Africa
-
5. South America
- 5.1. Brazil
- 5.2. Argentina
- 5.3. Rest of South America

Dementia Drugs Industry REPORT HIGHLIGHTS
| Aspects | Details |
|---|---|
| Study Period | 2019-2033 |
| Base Year | 2024 |
| Estimated Year | 2025 |
| Forecast Period | 2025-2033 |
| Historical Period | 2019-2024 |
| Growth Rate | CAGR of 6.20% from 2019-2033 |
| Segmentation |
|
Table of Contents
- 1. Introduction
- 1.1. Research Scope
- 1.2. Market Segmentation
- 1.3. Research Methodology
- 1.4. Definitions and Assumptions
- 2. Executive Summary
- 2.1. Introduction
- 3. Market Dynamics
- 3.1. Introduction
- 3.2. Market Drivers
- 3.2.1. Increasing Prevalence of Target Diseases; Introduction of New and Innovative Technologies and Drugs; Increased Government Funding and Awareness Programs
- 3.3. Market Restrains
- 3.3.1. High Failure Rates of Drugs at Approval Stages
- 3.4. Market Trends
- 3.4.1. The Alzheimer’s Disease Segment Hold a Significant Market Share and is Expected to Continue the Same Over the Forecast Period
- 4. Market Factor Analysis
- 4.1. Porters Five Forces
- 4.2. Supply/Value Chain
- 4.3. PESTEL analysis
- 4.4. Market Entropy
- 4.5. Patent/Trademark Analysis
- 5. Global Dementia Drugs Industry Analysis, Insights and Forecast, 2019-2031
- 5.1. Market Analysis, Insights and Forecast - by Indications
- 5.1.1. Lewy Body Dementia
- 5.1.2. Parkinson's Disease Dementia
- 5.1.3. Alzheimer's Disease
- 5.1.4. Vascular Dementia
- 5.1.5. Other Indications
- 5.2. Market Analysis, Insights and Forecast - by Drug Class
- 5.2.1. MAO Inhibitors
- 5.2.2. Glutamate Inhibitors
- 5.2.3. Cholinesterase Inhibitors
- 5.3. Market Analysis, Insights and Forecast - by Region
- 5.3.1. North America
- 5.3.2. Europe
- 5.3.3. Asia Pacific
- 5.3.4. Middle East and Africa
- 5.3.5. South America
- 5.1. Market Analysis, Insights and Forecast - by Indications
- 6. North America Dementia Drugs Industry Analysis, Insights and Forecast, 2019-2031
- 6.1. Market Analysis, Insights and Forecast - by Indications
- 6.1.1. Lewy Body Dementia
- 6.1.2. Parkinson's Disease Dementia
- 6.1.3. Alzheimer's Disease
- 6.1.4. Vascular Dementia
- 6.1.5. Other Indications
- 6.2. Market Analysis, Insights and Forecast - by Drug Class
- 6.2.1. MAO Inhibitors
- 6.2.2. Glutamate Inhibitors
- 6.2.3. Cholinesterase Inhibitors
- 6.1. Market Analysis, Insights and Forecast - by Indications
- 7. Europe Dementia Drugs Industry Analysis, Insights and Forecast, 2019-2031
- 7.1. Market Analysis, Insights and Forecast - by Indications
- 7.1.1. Lewy Body Dementia
- 7.1.2. Parkinson's Disease Dementia
- 7.1.3. Alzheimer's Disease
- 7.1.4. Vascular Dementia
- 7.1.5. Other Indications
- 7.2. Market Analysis, Insights and Forecast - by Drug Class
- 7.2.1. MAO Inhibitors
- 7.2.2. Glutamate Inhibitors
- 7.2.3. Cholinesterase Inhibitors
- 7.1. Market Analysis, Insights and Forecast - by Indications
- 8. Asia Pacific Dementia Drugs Industry Analysis, Insights and Forecast, 2019-2031
- 8.1. Market Analysis, Insights and Forecast - by Indications
- 8.1.1. Lewy Body Dementia
- 8.1.2. Parkinson's Disease Dementia
- 8.1.3. Alzheimer's Disease
- 8.1.4. Vascular Dementia
- 8.1.5. Other Indications
- 8.2. Market Analysis, Insights and Forecast - by Drug Class
- 8.2.1. MAO Inhibitors
- 8.2.2. Glutamate Inhibitors
- 8.2.3. Cholinesterase Inhibitors
- 8.1. Market Analysis, Insights and Forecast - by Indications
- 9. Middle East and Africa Dementia Drugs Industry Analysis, Insights and Forecast, 2019-2031
- 9.1. Market Analysis, Insights and Forecast - by Indications
- 9.1.1. Lewy Body Dementia
- 9.1.2. Parkinson's Disease Dementia
- 9.1.3. Alzheimer's Disease
- 9.1.4. Vascular Dementia
- 9.1.5. Other Indications
- 9.2. Market Analysis, Insights and Forecast - by Drug Class
- 9.2.1. MAO Inhibitors
- 9.2.2. Glutamate Inhibitors
- 9.2.3. Cholinesterase Inhibitors
- 9.1. Market Analysis, Insights and Forecast - by Indications
- 10. South America Dementia Drugs Industry Analysis, Insights and Forecast, 2019-2031
- 10.1. Market Analysis, Insights and Forecast - by Indications
- 10.1.1. Lewy Body Dementia
- 10.1.2. Parkinson's Disease Dementia
- 10.1.3. Alzheimer's Disease
- 10.1.4. Vascular Dementia
- 10.1.5. Other Indications
- 10.2. Market Analysis, Insights and Forecast - by Drug Class
- 10.2.1. MAO Inhibitors
- 10.2.2. Glutamate Inhibitors
- 10.2.3. Cholinesterase Inhibitors
- 10.1. Market Analysis, Insights and Forecast - by Indications
- 11. North America Dementia Drugs Industry Analysis, Insights and Forecast, 2019-2031
- 11.1. Market Analysis, Insights and Forecast - By Country/Sub-region
- 11.1.1 United States
- 11.1.2 Canada
- 11.1.3 Mexico
- 12. Europe Dementia Drugs Industry Analysis, Insights and Forecast, 2019-2031
- 12.1. Market Analysis, Insights and Forecast - By Country/Sub-region
- 12.1.1 Germany
- 12.1.2 United Kingdom
- 12.1.3 France
- 12.1.4 Italy
- 12.1.5 Spain
- 12.1.6 Rest of Europe
- 13. Asia Pacific Dementia Drugs Industry Analysis, Insights and Forecast, 2019-2031
- 13.1. Market Analysis, Insights and Forecast - By Country/Sub-region
- 13.1.1 China
- 13.1.2 Japan
- 13.1.3 India
- 13.1.4 Australia
- 13.1.5 South Korea
- 13.1.6 Rest of Asia Pacific
- 14. Middle East and Africa Dementia Drugs Industry Analysis, Insights and Forecast, 2019-2031
- 14.1. Market Analysis, Insights and Forecast - By Country/Sub-region
- 14.1.1 GCC
- 14.1.2 South Africa
- 14.1.3 Rest of Middle East and Africa
- 15. South America Dementia Drugs Industry Analysis, Insights and Forecast, 2019-2031
- 15.1. Market Analysis, Insights and Forecast - By Country/Sub-region
- 15.1.1 Brazil
- 15.1.2 Argentina
- 15.1.3 Rest of South America
- 16. Competitive Analysis
- 16.1. Global Market Share Analysis 2024
- 16.2. Company Profiles
- 16.2.1 Athira Pharma
- 16.2.1.1. Overview
- 16.2.1.2. Products
- 16.2.1.3. SWOT Analysis
- 16.2.1.4. Recent Developments
- 16.2.1.5. Financials (Based on Availability)
- 16.2.2 Merck & Co Inc
- 16.2.2.1. Overview
- 16.2.2.2. Products
- 16.2.2.3. SWOT Analysis
- 16.2.2.4. Recent Developments
- 16.2.2.5. Financials (Based on Availability)
- 16.2.3 Teva Pharmaceuticals
- 16.2.3.1. Overview
- 16.2.3.2. Products
- 16.2.3.3. SWOT Analysis
- 16.2.3.4. Recent Developments
- 16.2.3.5. Financials (Based on Availability)
- 16.2.4 Biogen
- 16.2.4.1. Overview
- 16.2.4.2. Products
- 16.2.4.3. SWOT Analysis
- 16.2.4.4. Recent Developments
- 16.2.4.5. Financials (Based on Availability)
- 16.2.5 Eli Lilly and Company
- 16.2.5.1. Overview
- 16.2.5.2. Products
- 16.2.5.3. SWOT Analysis
- 16.2.5.4. Recent Developments
- 16.2.5.5. Financials (Based on Availability)
- 16.2.6 AstraZeneca
- 16.2.6.1. Overview
- 16.2.6.2. Products
- 16.2.6.3. SWOT Analysis
- 16.2.6.4. Recent Developments
- 16.2.6.5. Financials (Based on Availability)
- 16.2.7 Johnson and Johnson
- 16.2.7.1. Overview
- 16.2.7.2. Products
- 16.2.7.3. SWOT Analysis
- 16.2.7.4. Recent Developments
- 16.2.7.5. Financials (Based on Availability)
- 16.2.8 SK Capital (Apotex Pharmaceutical Holdings Inc )
- 16.2.8.1. Overview
- 16.2.8.2. Products
- 16.2.8.3. SWOT Analysis
- 16.2.8.4. Recent Developments
- 16.2.8.5. Financials (Based on Availability)
- 16.2.9 Aurobindo Pharma
- 16.2.9.1. Overview
- 16.2.9.2. Products
- 16.2.9.3. SWOT Analysis
- 16.2.9.4. Recent Developments
- 16.2.9.5. Financials (Based on Availability)
- 16.2.10 Eisai Co Ltd
- 16.2.10.1. Overview
- 16.2.10.2. Products
- 16.2.10.3. SWOT Analysis
- 16.2.10.4. Recent Developments
- 16.2.10.5. Financials (Based on Availability)
- 16.2.11 Annovis Bio
- 16.2.11.1. Overview
- 16.2.11.2. Products
- 16.2.11.3. SWOT Analysis
- 16.2.11.4. Recent Developments
- 16.2.11.5. Financials (Based on Availability)
- 16.2.12 Zydus Cadila
- 16.2.12.1. Overview
- 16.2.12.2. Products
- 16.2.12.3. SWOT Analysis
- 16.2.12.4. Recent Developments
- 16.2.12.5. Financials (Based on Availability)
- 16.2.13 GlaxoSmithKline PLC
- 16.2.13.1. Overview
- 16.2.13.2. Products
- 16.2.13.3. SWOT Analysis
- 16.2.13.4. Recent Developments
- 16.2.13.5. Financials (Based on Availability)
- 16.2.14 Pfizer Inc
- 16.2.14.1. Overview
- 16.2.14.2. Products
- 16.2.14.3. SWOT Analysis
- 16.2.14.4. Recent Developments
- 16.2.14.5. Financials (Based on Availability)
- 16.2.1 Athira Pharma
List of Figures
- Figure 1: Global Dementia Drugs Industry Revenue Breakdown (Million, %) by Region 2024 & 2032
- Figure 2: Global Dementia Drugs Industry Volume Breakdown (K Unit, %) by Region 2024 & 2032
- Figure 3: North America Dementia Drugs Industry Revenue (Million), by Country 2024 & 2032
- Figure 4: North America Dementia Drugs Industry Volume (K Unit), by Country 2024 & 2032
- Figure 5: North America Dementia Drugs Industry Revenue Share (%), by Country 2024 & 2032
- Figure 6: North America Dementia Drugs Industry Volume Share (%), by Country 2024 & 2032
- Figure 7: Europe Dementia Drugs Industry Revenue (Million), by Country 2024 & 2032
- Figure 8: Europe Dementia Drugs Industry Volume (K Unit), by Country 2024 & 2032
- Figure 9: Europe Dementia Drugs Industry Revenue Share (%), by Country 2024 & 2032
- Figure 10: Europe Dementia Drugs Industry Volume Share (%), by Country 2024 & 2032
- Figure 11: Asia Pacific Dementia Drugs Industry Revenue (Million), by Country 2024 & 2032
- Figure 12: Asia Pacific Dementia Drugs Industry Volume (K Unit), by Country 2024 & 2032
- Figure 13: Asia Pacific Dementia Drugs Industry Revenue Share (%), by Country 2024 & 2032
- Figure 14: Asia Pacific Dementia Drugs Industry Volume Share (%), by Country 2024 & 2032
- Figure 15: Middle East and Africa Dementia Drugs Industry Revenue (Million), by Country 2024 & 2032
- Figure 16: Middle East and Africa Dementia Drugs Industry Volume (K Unit), by Country 2024 & 2032
- Figure 17: Middle East and Africa Dementia Drugs Industry Revenue Share (%), by Country 2024 & 2032
- Figure 18: Middle East and Africa Dementia Drugs Industry Volume Share (%), by Country 2024 & 2032
- Figure 19: South America Dementia Drugs Industry Revenue (Million), by Country 2024 & 2032
- Figure 20: South America Dementia Drugs Industry Volume (K Unit), by Country 2024 & 2032
- Figure 21: South America Dementia Drugs Industry Revenue Share (%), by Country 2024 & 2032
- Figure 22: South America Dementia Drugs Industry Volume Share (%), by Country 2024 & 2032
- Figure 23: North America Dementia Drugs Industry Revenue (Million), by Indications 2024 & 2032
- Figure 24: North America Dementia Drugs Industry Volume (K Unit), by Indications 2024 & 2032
- Figure 25: North America Dementia Drugs Industry Revenue Share (%), by Indications 2024 & 2032
- Figure 26: North America Dementia Drugs Industry Volume Share (%), by Indications 2024 & 2032
- Figure 27: North America Dementia Drugs Industry Revenue (Million), by Drug Class 2024 & 2032
- Figure 28: North America Dementia Drugs Industry Volume (K Unit), by Drug Class 2024 & 2032
- Figure 29: North America Dementia Drugs Industry Revenue Share (%), by Drug Class 2024 & 2032
- Figure 30: North America Dementia Drugs Industry Volume Share (%), by Drug Class 2024 & 2032
- Figure 31: North America Dementia Drugs Industry Revenue (Million), by Country 2024 & 2032
- Figure 32: North America Dementia Drugs Industry Volume (K Unit), by Country 2024 & 2032
- Figure 33: North America Dementia Drugs Industry Revenue Share (%), by Country 2024 & 2032
- Figure 34: North America Dementia Drugs Industry Volume Share (%), by Country 2024 & 2032
- Figure 35: Europe Dementia Drugs Industry Revenue (Million), by Indications 2024 & 2032
- Figure 36: Europe Dementia Drugs Industry Volume (K Unit), by Indications 2024 & 2032
- Figure 37: Europe Dementia Drugs Industry Revenue Share (%), by Indications 2024 & 2032
- Figure 38: Europe Dementia Drugs Industry Volume Share (%), by Indications 2024 & 2032
- Figure 39: Europe Dementia Drugs Industry Revenue (Million), by Drug Class 2024 & 2032
- Figure 40: Europe Dementia Drugs Industry Volume (K Unit), by Drug Class 2024 & 2032
- Figure 41: Europe Dementia Drugs Industry Revenue Share (%), by Drug Class 2024 & 2032
- Figure 42: Europe Dementia Drugs Industry Volume Share (%), by Drug Class 2024 & 2032
- Figure 43: Europe Dementia Drugs Industry Revenue (Million), by Country 2024 & 2032
- Figure 44: Europe Dementia Drugs Industry Volume (K Unit), by Country 2024 & 2032
- Figure 45: Europe Dementia Drugs Industry Revenue Share (%), by Country 2024 & 2032
- Figure 46: Europe Dementia Drugs Industry Volume Share (%), by Country 2024 & 2032
- Figure 47: Asia Pacific Dementia Drugs Industry Revenue (Million), by Indications 2024 & 2032
- Figure 48: Asia Pacific Dementia Drugs Industry Volume (K Unit), by Indications 2024 & 2032
- Figure 49: Asia Pacific Dementia Drugs Industry Revenue Share (%), by Indications 2024 & 2032
- Figure 50: Asia Pacific Dementia Drugs Industry Volume Share (%), by Indications 2024 & 2032
- Figure 51: Asia Pacific Dementia Drugs Industry Revenue (Million), by Drug Class 2024 & 2032
- Figure 52: Asia Pacific Dementia Drugs Industry Volume (K Unit), by Drug Class 2024 & 2032
- Figure 53: Asia Pacific Dementia Drugs Industry Revenue Share (%), by Drug Class 2024 & 2032
- Figure 54: Asia Pacific Dementia Drugs Industry Volume Share (%), by Drug Class 2024 & 2032
- Figure 55: Asia Pacific Dementia Drugs Industry Revenue (Million), by Country 2024 & 2032
- Figure 56: Asia Pacific Dementia Drugs Industry Volume (K Unit), by Country 2024 & 2032
- Figure 57: Asia Pacific Dementia Drugs Industry Revenue Share (%), by Country 2024 & 2032
- Figure 58: Asia Pacific Dementia Drugs Industry Volume Share (%), by Country 2024 & 2032
- Figure 59: Middle East and Africa Dementia Drugs Industry Revenue (Million), by Indications 2024 & 2032
- Figure 60: Middle East and Africa Dementia Drugs Industry Volume (K Unit), by Indications 2024 & 2032
- Figure 61: Middle East and Africa Dementia Drugs Industry Revenue Share (%), by Indications 2024 & 2032
- Figure 62: Middle East and Africa Dementia Drugs Industry Volume Share (%), by Indications 2024 & 2032
- Figure 63: Middle East and Africa Dementia Drugs Industry Revenue (Million), by Drug Class 2024 & 2032
- Figure 64: Middle East and Africa Dementia Drugs Industry Volume (K Unit), by Drug Class 2024 & 2032
- Figure 65: Middle East and Africa Dementia Drugs Industry Revenue Share (%), by Drug Class 2024 & 2032
- Figure 66: Middle East and Africa Dementia Drugs Industry Volume Share (%), by Drug Class 2024 & 2032
- Figure 67: Middle East and Africa Dementia Drugs Industry Revenue (Million), by Country 2024 & 2032
- Figure 68: Middle East and Africa Dementia Drugs Industry Volume (K Unit), by Country 2024 & 2032
- Figure 69: Middle East and Africa Dementia Drugs Industry Revenue Share (%), by Country 2024 & 2032
- Figure 70: Middle East and Africa Dementia Drugs Industry Volume Share (%), by Country 2024 & 2032
- Figure 71: South America Dementia Drugs Industry Revenue (Million), by Indications 2024 & 2032
- Figure 72: South America Dementia Drugs Industry Volume (K Unit), by Indications 2024 & 2032
- Figure 73: South America Dementia Drugs Industry Revenue Share (%), by Indications 2024 & 2032
- Figure 74: South America Dementia Drugs Industry Volume Share (%), by Indications 2024 & 2032
- Figure 75: South America Dementia Drugs Industry Revenue (Million), by Drug Class 2024 & 2032
- Figure 76: South America Dementia Drugs Industry Volume (K Unit), by Drug Class 2024 & 2032
- Figure 77: South America Dementia Drugs Industry Revenue Share (%), by Drug Class 2024 & 2032
- Figure 78: South America Dementia Drugs Industry Volume Share (%), by Drug Class 2024 & 2032
- Figure 79: South America Dementia Drugs Industry Revenue (Million), by Country 2024 & 2032
- Figure 80: South America Dementia Drugs Industry Volume (K Unit), by Country 2024 & 2032
- Figure 81: South America Dementia Drugs Industry Revenue Share (%), by Country 2024 & 2032
- Figure 82: South America Dementia Drugs Industry Volume Share (%), by Country 2024 & 2032
List of Tables
- Table 1: Global Dementia Drugs Industry Revenue Million Forecast, by Region 2019 & 2032
- Table 2: Global Dementia Drugs Industry Volume K Unit Forecast, by Region 2019 & 2032
- Table 3: Global Dementia Drugs Industry Revenue Million Forecast, by Indications 2019 & 2032
- Table 4: Global Dementia Drugs Industry Volume K Unit Forecast, by Indications 2019 & 2032
- Table 5: Global Dementia Drugs Industry Revenue Million Forecast, by Drug Class 2019 & 2032
- Table 6: Global Dementia Drugs Industry Volume K Unit Forecast, by Drug Class 2019 & 2032
- Table 7: Global Dementia Drugs Industry Revenue Million Forecast, by Region 2019 & 2032
- Table 8: Global Dementia Drugs Industry Volume K Unit Forecast, by Region 2019 & 2032
- Table 9: Global Dementia Drugs Industry Revenue Million Forecast, by Country 2019 & 2032
- Table 10: Global Dementia Drugs Industry Volume K Unit Forecast, by Country 2019 & 2032
- Table 11: United States Dementia Drugs Industry Revenue (Million) Forecast, by Application 2019 & 2032
- Table 12: United States Dementia Drugs Industry Volume (K Unit) Forecast, by Application 2019 & 2032
- Table 13: Canada Dementia Drugs Industry Revenue (Million) Forecast, by Application 2019 & 2032
- Table 14: Canada Dementia Drugs Industry Volume (K Unit) Forecast, by Application 2019 & 2032
- Table 15: Mexico Dementia Drugs Industry Revenue (Million) Forecast, by Application 2019 & 2032
- Table 16: Mexico Dementia Drugs Industry Volume (K Unit) Forecast, by Application 2019 & 2032
- Table 17: Global Dementia Drugs Industry Revenue Million Forecast, by Country 2019 & 2032
- Table 18: Global Dementia Drugs Industry Volume K Unit Forecast, by Country 2019 & 2032
- Table 19: Germany Dementia Drugs Industry Revenue (Million) Forecast, by Application 2019 & 2032
- Table 20: Germany Dementia Drugs Industry Volume (K Unit) Forecast, by Application 2019 & 2032
- Table 21: United Kingdom Dementia Drugs Industry Revenue (Million) Forecast, by Application 2019 & 2032
- Table 22: United Kingdom Dementia Drugs Industry Volume (K Unit) Forecast, by Application 2019 & 2032
- Table 23: France Dementia Drugs Industry Revenue (Million) Forecast, by Application 2019 & 2032
- Table 24: France Dementia Drugs Industry Volume (K Unit) Forecast, by Application 2019 & 2032
- Table 25: Italy Dementia Drugs Industry Revenue (Million) Forecast, by Application 2019 & 2032
- Table 26: Italy Dementia Drugs Industry Volume (K Unit) Forecast, by Application 2019 & 2032
- Table 27: Spain Dementia Drugs Industry Revenue (Million) Forecast, by Application 2019 & 2032
- Table 28: Spain Dementia Drugs Industry Volume (K Unit) Forecast, by Application 2019 & 2032
- Table 29: Rest of Europe Dementia Drugs Industry Revenue (Million) Forecast, by Application 2019 & 2032
- Table 30: Rest of Europe Dementia Drugs Industry Volume (K Unit) Forecast, by Application 2019 & 2032
- Table 31: Global Dementia Drugs Industry Revenue Million Forecast, by Country 2019 & 2032
- Table 32: Global Dementia Drugs Industry Volume K Unit Forecast, by Country 2019 & 2032
- Table 33: China Dementia Drugs Industry Revenue (Million) Forecast, by Application 2019 & 2032
- Table 34: China Dementia Drugs Industry Volume (K Unit) Forecast, by Application 2019 & 2032
- Table 35: Japan Dementia Drugs Industry Revenue (Million) Forecast, by Application 2019 & 2032
- Table 36: Japan Dementia Drugs Industry Volume (K Unit) Forecast, by Application 2019 & 2032
- Table 37: India Dementia Drugs Industry Revenue (Million) Forecast, by Application 2019 & 2032
- Table 38: India Dementia Drugs Industry Volume (K Unit) Forecast, by Application 2019 & 2032
- Table 39: Australia Dementia Drugs Industry Revenue (Million) Forecast, by Application 2019 & 2032
- Table 40: Australia Dementia Drugs Industry Volume (K Unit) Forecast, by Application 2019 & 2032
- Table 41: South Korea Dementia Drugs Industry Revenue (Million) Forecast, by Application 2019 & 2032
- Table 42: South Korea Dementia Drugs Industry Volume (K Unit) Forecast, by Application 2019 & 2032
- Table 43: Rest of Asia Pacific Dementia Drugs Industry Revenue (Million) Forecast, by Application 2019 & 2032
- Table 44: Rest of Asia Pacific Dementia Drugs Industry Volume (K Unit) Forecast, by Application 2019 & 2032
- Table 45: Global Dementia Drugs Industry Revenue Million Forecast, by Country 2019 & 2032
- Table 46: Global Dementia Drugs Industry Volume K Unit Forecast, by Country 2019 & 2032
- Table 47: GCC Dementia Drugs Industry Revenue (Million) Forecast, by Application 2019 & 2032
- Table 48: GCC Dementia Drugs Industry Volume (K Unit) Forecast, by Application 2019 & 2032
- Table 49: South Africa Dementia Drugs Industry Revenue (Million) Forecast, by Application 2019 & 2032
- Table 50: South Africa Dementia Drugs Industry Volume (K Unit) Forecast, by Application 2019 & 2032
- Table 51: Rest of Middle East and Africa Dementia Drugs Industry Revenue (Million) Forecast, by Application 2019 & 2032
- Table 52: Rest of Middle East and Africa Dementia Drugs Industry Volume (K Unit) Forecast, by Application 2019 & 2032
- Table 53: Global Dementia Drugs Industry Revenue Million Forecast, by Country 2019 & 2032
- Table 54: Global Dementia Drugs Industry Volume K Unit Forecast, by Country 2019 & 2032
- Table 55: Brazil Dementia Drugs Industry Revenue (Million) Forecast, by Application 2019 & 2032
- Table 56: Brazil Dementia Drugs Industry Volume (K Unit) Forecast, by Application 2019 & 2032
- Table 57: Argentina Dementia Drugs Industry Revenue (Million) Forecast, by Application 2019 & 2032
- Table 58: Argentina Dementia Drugs Industry Volume (K Unit) Forecast, by Application 2019 & 2032
- Table 59: Rest of South America Dementia Drugs Industry Revenue (Million) Forecast, by Application 2019 & 2032
- Table 60: Rest of South America Dementia Drugs Industry Volume (K Unit) Forecast, by Application 2019 & 2032
- Table 61: Global Dementia Drugs Industry Revenue Million Forecast, by Indications 2019 & 2032
- Table 62: Global Dementia Drugs Industry Volume K Unit Forecast, by Indications 2019 & 2032
- Table 63: Global Dementia Drugs Industry Revenue Million Forecast, by Drug Class 2019 & 2032
- Table 64: Global Dementia Drugs Industry Volume K Unit Forecast, by Drug Class 2019 & 2032
- Table 65: Global Dementia Drugs Industry Revenue Million Forecast, by Country 2019 & 2032
- Table 66: Global Dementia Drugs Industry Volume K Unit Forecast, by Country 2019 & 2032
- Table 67: United States Dementia Drugs Industry Revenue (Million) Forecast, by Application 2019 & 2032
- Table 68: United States Dementia Drugs Industry Volume (K Unit) Forecast, by Application 2019 & 2032
- Table 69: Canada Dementia Drugs Industry Revenue (Million) Forecast, by Application 2019 & 2032
- Table 70: Canada Dementia Drugs Industry Volume (K Unit) Forecast, by Application 2019 & 2032
- Table 71: Mexico Dementia Drugs Industry Revenue (Million) Forecast, by Application 2019 & 2032
- Table 72: Mexico Dementia Drugs Industry Volume (K Unit) Forecast, by Application 2019 & 2032
- Table 73: Global Dementia Drugs Industry Revenue Million Forecast, by Indications 2019 & 2032
- Table 74: Global Dementia Drugs Industry Volume K Unit Forecast, by Indications 2019 & 2032
- Table 75: Global Dementia Drugs Industry Revenue Million Forecast, by Drug Class 2019 & 2032
- Table 76: Global Dementia Drugs Industry Volume K Unit Forecast, by Drug Class 2019 & 2032
- Table 77: Global Dementia Drugs Industry Revenue Million Forecast, by Country 2019 & 2032
- Table 78: Global Dementia Drugs Industry Volume K Unit Forecast, by Country 2019 & 2032
- Table 79: Germany Dementia Drugs Industry Revenue (Million) Forecast, by Application 2019 & 2032
- Table 80: Germany Dementia Drugs Industry Volume (K Unit) Forecast, by Application 2019 & 2032
- Table 81: United Kingdom Dementia Drugs Industry Revenue (Million) Forecast, by Application 2019 & 2032
- Table 82: United Kingdom Dementia Drugs Industry Volume (K Unit) Forecast, by Application 2019 & 2032
- Table 83: France Dementia Drugs Industry Revenue (Million) Forecast, by Application 2019 & 2032
- Table 84: France Dementia Drugs Industry Volume (K Unit) Forecast, by Application 2019 & 2032
- Table 85: Italy Dementia Drugs Industry Revenue (Million) Forecast, by Application 2019 & 2032
- Table 86: Italy Dementia Drugs Industry Volume (K Unit) Forecast, by Application 2019 & 2032
- Table 87: Spain Dementia Drugs Industry Revenue (Million) Forecast, by Application 2019 & 2032
- Table 88: Spain Dementia Drugs Industry Volume (K Unit) Forecast, by Application 2019 & 2032
- Table 89: Rest of Europe Dementia Drugs Industry Revenue (Million) Forecast, by Application 2019 & 2032
- Table 90: Rest of Europe Dementia Drugs Industry Volume (K Unit) Forecast, by Application 2019 & 2032
- Table 91: Global Dementia Drugs Industry Revenue Million Forecast, by Indications 2019 & 2032
- Table 92: Global Dementia Drugs Industry Volume K Unit Forecast, by Indications 2019 & 2032
- Table 93: Global Dementia Drugs Industry Revenue Million Forecast, by Drug Class 2019 & 2032
- Table 94: Global Dementia Drugs Industry Volume K Unit Forecast, by Drug Class 2019 & 2032
- Table 95: Global Dementia Drugs Industry Revenue Million Forecast, by Country 2019 & 2032
- Table 96: Global Dementia Drugs Industry Volume K Unit Forecast, by Country 2019 & 2032
- Table 97: China Dementia Drugs Industry Revenue (Million) Forecast, by Application 2019 & 2032
- Table 98: China Dementia Drugs Industry Volume (K Unit) Forecast, by Application 2019 & 2032
- Table 99: Japan Dementia Drugs Industry Revenue (Million) Forecast, by Application 2019 & 2032
- Table 100: Japan Dementia Drugs Industry Volume (K Unit) Forecast, by Application 2019 & 2032
- Table 101: India Dementia Drugs Industry Revenue (Million) Forecast, by Application 2019 & 2032
- Table 102: India Dementia Drugs Industry Volume (K Unit) Forecast, by Application 2019 & 2032
- Table 103: Australia Dementia Drugs Industry Revenue (Million) Forecast, by Application 2019 & 2032
- Table 104: Australia Dementia Drugs Industry Volume (K Unit) Forecast, by Application 2019 & 2032
- Table 105: South Korea Dementia Drugs Industry Revenue (Million) Forecast, by Application 2019 & 2032
- Table 106: South Korea Dementia Drugs Industry Volume (K Unit) Forecast, by Application 2019 & 2032
- Table 107: Rest of Asia Pacific Dementia Drugs Industry Revenue (Million) Forecast, by Application 2019 & 2032
- Table 108: Rest of Asia Pacific Dementia Drugs Industry Volume (K Unit) Forecast, by Application 2019 & 2032
- Table 109: Global Dementia Drugs Industry Revenue Million Forecast, by Indications 2019 & 2032
- Table 110: Global Dementia Drugs Industry Volume K Unit Forecast, by Indications 2019 & 2032
- Table 111: Global Dementia Drugs Industry Revenue Million Forecast, by Drug Class 2019 & 2032
- Table 112: Global Dementia Drugs Industry Volume K Unit Forecast, by Drug Class 2019 & 2032
- Table 113: Global Dementia Drugs Industry Revenue Million Forecast, by Country 2019 & 2032
- Table 114: Global Dementia Drugs Industry Volume K Unit Forecast, by Country 2019 & 2032
- Table 115: GCC Dementia Drugs Industry Revenue (Million) Forecast, by Application 2019 & 2032
- Table 116: GCC Dementia Drugs Industry Volume (K Unit) Forecast, by Application 2019 & 2032
- Table 117: South Africa Dementia Drugs Industry Revenue (Million) Forecast, by Application 2019 & 2032
- Table 118: South Africa Dementia Drugs Industry Volume (K Unit) Forecast, by Application 2019 & 2032
- Table 119: Rest of Middle East and Africa Dementia Drugs Industry Revenue (Million) Forecast, by Application 2019 & 2032
- Table 120: Rest of Middle East and Africa Dementia Drugs Industry Volume (K Unit) Forecast, by Application 2019 & 2032
- Table 121: Global Dementia Drugs Industry Revenue Million Forecast, by Indications 2019 & 2032
- Table 122: Global Dementia Drugs Industry Volume K Unit Forecast, by Indications 2019 & 2032
- Table 123: Global Dementia Drugs Industry Revenue Million Forecast, by Drug Class 2019 & 2032
- Table 124: Global Dementia Drugs Industry Volume K Unit Forecast, by Drug Class 2019 & 2032
- Table 125: Global Dementia Drugs Industry Revenue Million Forecast, by Country 2019 & 2032
- Table 126: Global Dementia Drugs Industry Volume K Unit Forecast, by Country 2019 & 2032
- Table 127: Brazil Dementia Drugs Industry Revenue (Million) Forecast, by Application 2019 & 2032
- Table 128: Brazil Dementia Drugs Industry Volume (K Unit) Forecast, by Application 2019 & 2032
- Table 129: Argentina Dementia Drugs Industry Revenue (Million) Forecast, by Application 2019 & 2032
- Table 130: Argentina Dementia Drugs Industry Volume (K Unit) Forecast, by Application 2019 & 2032
- Table 131: Rest of South America Dementia Drugs Industry Revenue (Million) Forecast, by Application 2019 & 2032
- Table 132: Rest of South America Dementia Drugs Industry Volume (K Unit) Forecast, by Application 2019 & 2032
Frequently Asked Questions
1. What is the projected Compound Annual Growth Rate (CAGR) of the Dementia Drugs Industry?
The projected CAGR is approximately 6.20%.
2. Which companies are prominent players in the Dementia Drugs Industry?
Key companies in the market include Athira Pharma, Merck & Co Inc , Teva Pharmaceuticals, Biogen, Eli Lilly and Company, AstraZeneca, Johnson and Johnson, SK Capital (Apotex Pharmaceutical Holdings Inc ), Aurobindo Pharma, Eisai Co Ltd, Annovis Bio, Zydus Cadila, GlaxoSmithKline PLC, Pfizer Inc.
3. What are the main segments of the Dementia Drugs Industry?
The market segments include Indications, Drug Class.
4. Can you provide details about the market size?
The market size is estimated to be USD 16.44 Million as of 2022.
5. What are some drivers contributing to market growth?
Increasing Prevalence of Target Diseases; Introduction of New and Innovative Technologies and Drugs; Increased Government Funding and Awareness Programs.
6. What are the notable trends driving market growth?
The Alzheimer’s Disease Segment Hold a Significant Market Share and is Expected to Continue the Same Over the Forecast Period.
7. Are there any restraints impacting market growth?
High Failure Rates of Drugs at Approval Stages.
8. Can you provide examples of recent developments in the market?
April 2022- NovaMedica developed and registered an innovative combination of Donepezil and Memantine molecules, the primary therapies for dementia associated with Alzheimer's disease. The drug is registered under the name MIOREOL. This is one of the combinations in the Russian market and the markets of the Eurasian Economic Union members and Europe.
9. What pricing options are available for accessing the report?
Pricing options include single-user, multi-user, and enterprise licenses priced at USD 4750, USD 5250, and USD 8750 respectively.
10. Is the market size provided in terms of value or volume?
The market size is provided in terms of value, measured in Million and volume, measured in K Unit.
11. Are there any specific market keywords associated with the report?
Yes, the market keyword associated with the report is "Dementia Drugs Industry," which aids in identifying and referencing the specific market segment covered.
12. How do I determine which pricing option suits my needs best?
The pricing options vary based on user requirements and access needs. Individual users may opt for single-user licenses, while businesses requiring broader access may choose multi-user or enterprise licenses for cost-effective access to the report.
13. Are there any additional resources or data provided in the Dementia Drugs Industry report?
While the report offers comprehensive insights, it's advisable to review the specific contents or supplementary materials provided to ascertain if additional resources or data are available.
14. How can I stay updated on further developments or reports in the Dementia Drugs Industry?
To stay informed about further developments, trends, and reports in the Dementia Drugs Industry, consider subscribing to industry newsletters, following relevant companies and organizations, or regularly checking reputable industry news sources and publications.
Methodology
Step 1 - Identification of Relevant Samples Size from Population Database


Step 2 - Approaches for Defining Global Market Size (Value, Volume* & Price*)

Note*: In applicable scenarios
Step 3 - Data Sources
Primary Research
- Web Analytics
- Survey Reports
- Research Institute
- Latest Research Reports
- Opinion Leaders
Secondary Research
- Annual Reports
- White Paper
- Latest Press Release
- Industry Association
- Paid Database
- Investor Presentations

Step 4 - Data Triangulation
Involves using different sources of information in order to increase the validity of a study
These sources are likely to be stakeholders in a program - participants, other researchers, program staff, other community members, and so on.
Then we put all data in single framework & apply various statistical tools to find out the dynamic on the market.
During the analysis stage, feedback from the stakeholder groups would be compared to determine areas of agreement as well as areas of divergence
