

Key Insights
The global energy drinks market, currently exhibiting robust growth, is projected to reach a substantial size within the next decade. A Compound Annual Growth Rate (CAGR) of 12.50% from 2019 to 2033 indicates significant market expansion, driven primarily by increasing consumer demand for convenient energy boosts, particularly among young adults and working professionals. Lifestyle changes, including longer working hours and increased physical activity, contribute significantly to the market's dynamism. The market's segmentation reveals key trends: The demand for healthier options, like sugar-free and natural/organic energy drinks, is steadily rising, reflecting a growing health-conscious consumer base. This trend is complemented by an increasing preference for convenient packaging formats, with PET bottles and metal cans leading the way due to portability and recyclability. The distribution channels show a balance between off-trade (retail stores) and on-trade (restaurants, bars) indicating diverse consumption patterns. Competition is fierce, with major players like Red Bull, Monster Beverage, Coca-Cola, and PepsiCo vying for market share alongside smaller, niche brands emphasizing specific health benefits or unique flavor profiles. The continued innovation in flavors, functional ingredients (e.g., added vitamins, electrolytes), and sustainable packaging will be key factors shaping the market's future trajectory.
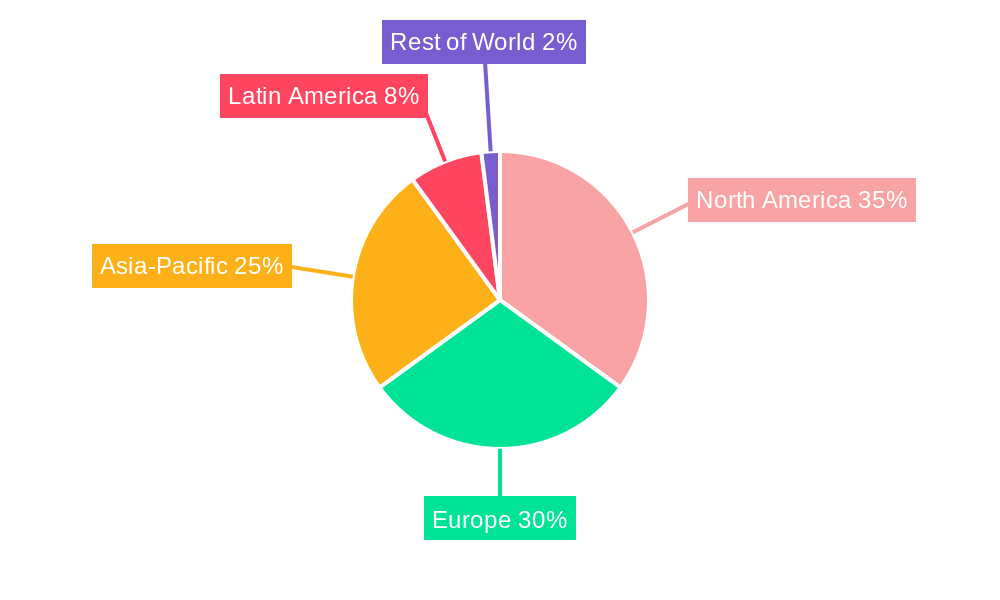
Furthermore, regional variations in consumption patterns and regulatory environments impact market growth. While North America and Europe currently hold significant market shares, emerging economies in Asia and Latin America are witnessing rapid expansion, presenting attractive opportunities for both established and emerging players. However, concerns about the high sugar content and potential health risks associated with excessive energy drink consumption pose a challenge, prompting the growth of healthier alternatives and stricter regulatory frameworks in certain regions. The ability to successfully navigate these regulatory landscapes and meet evolving consumer preferences will prove critical for sustained success in this dynamic market. Future growth will depend on consistent product innovation, effective marketing strategies targeted at specific demographics, and a commitment to sustainability.

Energy Drinks Market: A Comprehensive Report (2019-2033)
This comprehensive report provides a detailed analysis of the global Energy Drinks Market, offering invaluable insights for industry stakeholders, investors, and businesses seeking to navigate this dynamic sector. The report covers the period 2019-2033, with a focus on the base year 2025 and a forecast period extending to 2033. The market's size is projected to reach xx Million by 2033, exhibiting a CAGR of xx% during the forecast period. This in-depth study delves into market segmentation, competitive landscape, growth drivers, and emerging trends, providing actionable intelligence for informed decision-making.
Energy Drinks Market Market Concentration & Dynamics
The global energy drinks market is characterized by a moderately concentrated landscape, with a few major players holding significant market share. Red Bull GmbH and Monster Beverage Corporation are prominent examples, commanding a substantial portion of the global market. However, regional players and emerging brands are increasingly challenging the dominance of these established giants. The market's dynamics are shaped by several key factors, including:
- Market Concentration: Red Bull and Monster together hold approximately xx% of the global market share (2025). Other significant players like PepsiCo and Coca-Cola also occupy significant positions.
- Innovation Ecosystems: The industry witnesses continuous innovation in product formulations, packaging, and marketing strategies. The rise of natural and organic energy drinks reflects the changing consumer preferences.
- Regulatory Frameworks: Government regulations concerning sugar content, caffeine levels, and marketing practices significantly impact market operations. Variations in regulations across different geographies create complexities for multinational companies.
- Substitute Products: The market faces competition from other functional beverages, such as sports drinks and coffee, which also cater to consumer needs for energy and alertness.
- End-User Trends: Growing health consciousness is driving demand for sugar-free, low-calorie, and natural energy drinks. Changing lifestyles and increased physical activity among consumers also stimulate market growth.
- M&A Activities: The energy drinks sector has witnessed several mergers and acquisitions (M&As) in recent years, reflecting the industry's consolidation trend. The number of M&A deals averaged xx per year during the historical period (2019-2024).
Energy Drinks Market Industry Insights & Trends
The global energy drinks market is experiencing robust growth, driven by several key factors. Rising disposable incomes, particularly in developing economies, are fueling demand for premium beverages, including energy drinks. The increasing prevalence of hectic lifestyles, coupled with the need for enhanced physical and mental performance, is another major contributor. Technological advancements, such as the development of novel ingredients and improved packaging technologies, are continuously enhancing product offerings and expanding market reach. Changing consumer behaviors, particularly the growing preference for healthier options like sugar-free and natural energy drinks, are reshaping the market landscape. The market size reached xx Million in 2024 and is projected to reach xx Million in 2025, exhibiting a compound annual growth rate (CAGR) of xx% during the historical period (2019-2024). The market's growth trajectory is expected to remain robust throughout the forecast period (2025-2033). The shift towards online distribution channels and the growing popularity of energy shots are also shaping the market's future.

Key Markets & Segments Leading Energy Drinks Market
The North American region currently dominates the global energy drinks market, followed by Europe and Asia-Pacific. Within these regions, specific countries like the United States, Germany, and Japan are major contributors to market growth. Significant segments driving growth include:
- Soft Drink Type: Traditional energy drinks remain the largest segment, but the demand for sugar-free/low-calorie and natural/organic options is growing rapidly. Energy shots are also witnessing a surge in popularity due to their convenience.
- Packaging Type: Metal cans are the preferred packaging for energy drinks, but PET bottles are gaining traction due to their cost-effectiveness and recyclability. Glass bottles cater to a niche premium segment.
- Distribution Channel: Off-trade channels, such as supermarkets and convenience stores, dominate distribution. However, on-trade channels (restaurants, bars) are also growing.
Drivers of Market Dominance:
- North America: High per capita consumption, strong brand presence, and established distribution networks.
- Europe: High disposable incomes, increasing health consciousness driving demand for healthier options.
- Asia-Pacific: Rapid economic growth, expanding middle class, and rising health consciousness.
Energy Drinks Market Product Developments
Recent product innovations focus on catering to the growing health-conscious consumer base. Sugar-free and low-calorie options are gaining popularity, alongside natural and organic formulations. Functional energy drinks enriched with vitamins, minerals, and other beneficial ingredients are emerging as a significant segment. Technological advancements in packaging, such as the use of sustainable materials and innovative designs, are enhancing product appeal and contributing to market expansion. These advancements provide a competitive edge to brands that adopt them.
Challenges in the Energy Drinks Market Market
The energy drinks market faces several challenges including stringent regulations on caffeine and sugar content, impacting product formulation and marketing. Supply chain disruptions, particularly related to raw material sourcing and logistics, can lead to production delays and increased costs, affecting profitability. Intense competition from established players and new entrants exerts considerable pressure on market share and pricing strategies. These factors collectively impact the industry's overall growth trajectory.
Forces Driving Energy Drinks Market Growth
Several factors contribute to the energy drinks market's sustained growth. The rising prevalence of hectic lifestyles and the increasing demand for functional beverages that boost energy and alertness are key drivers. The expanding middle class in developing economies fuels demand, while technological advancements continuously improve product offerings and packaging. Positive economic growth in several key markets further stimulates consumption.
Long-Term Growth Catalysts in the Energy Drinks Market
Long-term growth in the energy drinks market will be driven by strategic partnerships and collaborations to expand market reach and product diversification. Continuous innovation in product formulations, focusing on healthier options and functional benefits, will remain crucial. Expanding into emerging markets with high growth potential and tapping into new consumer segments through targeted marketing campaigns will further fuel growth.
Emerging Opportunities in Energy Drinks Market
Emerging opportunities lie in the growing demand for functional beverages catering to specific needs. Developing energy drinks with tailored benefits, such as improved cognitive function, enhanced physical performance, or better hydration, presents a promising avenue. Exploring sustainable packaging solutions and adopting environmentally friendly manufacturing processes are also crucial for aligning with consumer preferences and regulatory requirements. Expanding into underserved markets and tailoring product offerings to regional tastes are also promising opportunities.
Leading Players in the Energy Drinks Market Sector
- Carabao Group Public Company Limited
- Hell Energy Magyarország Korlátolt Felelosségu Társaság
- Aje Group
- Monster Beverage Corporation
- PepsiCo Inc
- The Coca-Cola Company
- Suntory Holdings Limited
- Red Bull GmbH
- Living Essentials LLC
- T C Pharmaceutical Industries Company Limited
- Taisho Pharmaceutical Holdings Co Ltd
- Congo Brands
- Osotspa Public Company Limited
Key Milestones in Energy Drinks Market Industry
- September 2023: PepsiCo India launched Sting Blue Current, a limited-edition flavor of its Sting Energy drink.
- September 2023: Red Bull launched its first limited Winter Edition (Spiced Pear) in the United Kingdom.
- October 2023: Quality Pack International and an Azerbaijani company formed a joint venture (Quality Pack Capian LLC) to establish an aluminum beverage can manufacturing and filling factory in Azerbaijan.
Strategic Outlook for Energy Drinks Market Market
The energy drinks market presents significant growth potential, driven by evolving consumer preferences and technological advancements. Strategic opportunities lie in developing innovative, healthier products, expanding into new markets, and adopting sustainable practices. Companies focusing on product diversification, strategic partnerships, and effective marketing strategies are well-positioned to capitalize on the market's long-term growth trajectory.
Energy Drinks Market Segmentation
-
1. Soft Drink Type
- 1.1. Energy Shots
- 1.2. Natural/Organic Energy Drinks
- 1.3. Sugar-free or Low-calories Energy Drinks
- 1.4. Traditional Energy Drinks
- 1.5. Other Energy Drinks
-
2. Packaging Type
- 2.1. Glass Bottles
- 2.2. Metal Can
- 2.3. PET Bottles
-
3. Distribution Channel
-
3.1. Off-trade
- 3.1.1. Convenience Stores
- 3.1.2. Online Retail
- 3.1.3. Supermarket/Hypermarket
- 3.1.4. Others
- 3.2. On-trade
-
3.1. Off-trade
Energy Drinks Market Segmentation By Geography
-
1. North America
- 1.1. United States
- 1.2. Canada
- 1.3. Mexico
-
2. South America
- 2.1. Brazil
- 2.2. Argentina
- 2.3. Rest of South America
-
3. Europe
- 3.1. United Kingdom
- 3.2. Germany
- 3.3. France
- 3.4. Italy
- 3.5. Spain
- 3.6. Russia
- 3.7. Benelux
- 3.8. Nordics
- 3.9. Rest of Europe
-
4. Middle East & Africa
- 4.1. Turkey
- 4.2. Israel
- 4.3. GCC
- 4.4. North Africa
- 4.5. South Africa
- 4.6. Rest of Middle East & Africa
-
5. Asia Pacific
- 5.1. China
- 5.2. India
- 5.3. Japan
- 5.4. South Korea
- 5.5. ASEAN
- 5.6. Oceania
- 5.7. Rest of Asia Pacific
Energy Drinks Market REPORT HIGHLIGHTS
| Aspects | Details |
|---|---|
| Study Period | 2019-2033 |
| Base Year | 2024 |
| Estimated Year | 2025 |
| Forecast Period | 2025-2033 |
| Historical Period | 2019-2024 |
| Growth Rate | CAGR of 12.50% from 2019-2033 |
| Segmentation |
|
Table of Contents
- 1. Introduction
- 1.1. Research Scope
- 1.2. Market Segmentation
- 1.3. Research Methodology
- 1.4. Definitions and Assumptions
- 2. Executive Summary
- 2.1. Introduction
- 3. Market Dynamics
- 3.1. Introduction
- 3.2. Market Drivers
- 3.2.1. Increasing Demand for Supplement Nutrition; Growing Casein Application in Processed Food Products
- 3.3. Market Restrains
- 3.3.1. Competition from Vegan/Plant-based Protein Powders
- 3.4. Market Trends
- 3.4.1. OTHER KEY INDUSTRY TRENDS COVERED IN THE REPORT
- 4. Market Factor Analysis
- 4.1. Porters Five Forces
- 4.2. Supply/Value Chain
- 4.3. PESTEL analysis
- 4.4. Market Entropy
- 4.5. Patent/Trademark Analysis
- 5. Global Energy Drinks Market Analysis, Insights and Forecast, 2019-2031
- 5.1. Market Analysis, Insights and Forecast - by Soft Drink Type
- 5.1.1. Energy Shots
- 5.1.2. Natural/Organic Energy Drinks
- 5.1.3. Sugar-free or Low-calories Energy Drinks
- 5.1.4. Traditional Energy Drinks
- 5.1.5. Other Energy Drinks
- 5.2. Market Analysis, Insights and Forecast - by Packaging Type
- 5.2.1. Glass Bottles
- 5.2.2. Metal Can
- 5.2.3. PET Bottles
- 5.3. Market Analysis, Insights and Forecast - by Distribution Channel
- 5.3.1. Off-trade
- 5.3.1.1. Convenience Stores
- 5.3.1.2. Online Retail
- 5.3.1.3. Supermarket/Hypermarket
- 5.3.1.4. Others
- 5.3.2. On-trade
- 5.3.1. Off-trade
- 5.4. Market Analysis, Insights and Forecast - by Region
- 5.4.1. North America
- 5.4.2. South America
- 5.4.3. Europe
- 5.4.4. Middle East & Africa
- 5.4.5. Asia Pacific
- 5.1. Market Analysis, Insights and Forecast - by Soft Drink Type
- 6. North America Energy Drinks Market Analysis, Insights and Forecast, 2019-2031
- 6.1. Market Analysis, Insights and Forecast - by Soft Drink Type
- 6.1.1. Energy Shots
- 6.1.2. Natural/Organic Energy Drinks
- 6.1.3. Sugar-free or Low-calories Energy Drinks
- 6.1.4. Traditional Energy Drinks
- 6.1.5. Other Energy Drinks
- 6.2. Market Analysis, Insights and Forecast - by Packaging Type
- 6.2.1. Glass Bottles
- 6.2.2. Metal Can
- 6.2.3. PET Bottles
- 6.3. Market Analysis, Insights and Forecast - by Distribution Channel
- 6.3.1. Off-trade
- 6.3.1.1. Convenience Stores
- 6.3.1.2. Online Retail
- 6.3.1.3. Supermarket/Hypermarket
- 6.3.1.4. Others
- 6.3.2. On-trade
- 6.3.1. Off-trade
- 6.1. Market Analysis, Insights and Forecast - by Soft Drink Type
- 7. South America Energy Drinks Market Analysis, Insights and Forecast, 2019-2031
- 7.1. Market Analysis, Insights and Forecast - by Soft Drink Type
- 7.1.1. Energy Shots
- 7.1.2. Natural/Organic Energy Drinks
- 7.1.3. Sugar-free or Low-calories Energy Drinks
- 7.1.4. Traditional Energy Drinks
- 7.1.5. Other Energy Drinks
- 7.2. Market Analysis, Insights and Forecast - by Packaging Type
- 7.2.1. Glass Bottles
- 7.2.2. Metal Can
- 7.2.3. PET Bottles
- 7.3. Market Analysis, Insights and Forecast - by Distribution Channel
- 7.3.1. Off-trade
- 7.3.1.1. Convenience Stores
- 7.3.1.2. Online Retail
- 7.3.1.3. Supermarket/Hypermarket
- 7.3.1.4. Others
- 7.3.2. On-trade
- 7.3.1. Off-trade
- 7.1. Market Analysis, Insights and Forecast - by Soft Drink Type
- 8. Europe Energy Drinks Market Analysis, Insights and Forecast, 2019-2031
- 8.1. Market Analysis, Insights and Forecast - by Soft Drink Type
- 8.1.1. Energy Shots
- 8.1.2. Natural/Organic Energy Drinks
- 8.1.3. Sugar-free or Low-calories Energy Drinks
- 8.1.4. Traditional Energy Drinks
- 8.1.5. Other Energy Drinks
- 8.2. Market Analysis, Insights and Forecast - by Packaging Type
- 8.2.1. Glass Bottles
- 8.2.2. Metal Can
- 8.2.3. PET Bottles
- 8.3. Market Analysis, Insights and Forecast - by Distribution Channel
- 8.3.1. Off-trade
- 8.3.1.1. Convenience Stores
- 8.3.1.2. Online Retail
- 8.3.1.3. Supermarket/Hypermarket
- 8.3.1.4. Others
- 8.3.2. On-trade
- 8.3.1. Off-trade
- 8.1. Market Analysis, Insights and Forecast - by Soft Drink Type
- 9. Middle East & Africa Energy Drinks Market Analysis, Insights and Forecast, 2019-2031
- 9.1. Market Analysis, Insights and Forecast - by Soft Drink Type
- 9.1.1. Energy Shots
- 9.1.2. Natural/Organic Energy Drinks
- 9.1.3. Sugar-free or Low-calories Energy Drinks
- 9.1.4. Traditional Energy Drinks
- 9.1.5. Other Energy Drinks
- 9.2. Market Analysis, Insights and Forecast - by Packaging Type
- 9.2.1. Glass Bottles
- 9.2.2. Metal Can
- 9.2.3. PET Bottles
- 9.3. Market Analysis, Insights and Forecast - by Distribution Channel
- 9.3.1. Off-trade
- 9.3.1.1. Convenience Stores
- 9.3.1.2. Online Retail
- 9.3.1.3. Supermarket/Hypermarket
- 9.3.1.4. Others
- 9.3.2. On-trade
- 9.3.1. Off-trade
- 9.1. Market Analysis, Insights and Forecast - by Soft Drink Type
- 10. Asia Pacific Energy Drinks Market Analysis, Insights and Forecast, 2019-2031
- 10.1. Market Analysis, Insights and Forecast - by Soft Drink Type
- 10.1.1. Energy Shots
- 10.1.2. Natural/Organic Energy Drinks
- 10.1.3. Sugar-free or Low-calories Energy Drinks
- 10.1.4. Traditional Energy Drinks
- 10.1.5. Other Energy Drinks
- 10.2. Market Analysis, Insights and Forecast - by Packaging Type
- 10.2.1. Glass Bottles
- 10.2.2. Metal Can
- 10.2.3. PET Bottles
- 10.3. Market Analysis, Insights and Forecast - by Distribution Channel
- 10.3.1. Off-trade
- 10.3.1.1. Convenience Stores
- 10.3.1.2. Online Retail
- 10.3.1.3. Supermarket/Hypermarket
- 10.3.1.4. Others
- 10.3.2. On-trade
- 10.3.1. Off-trade
- 10.1. Market Analysis, Insights and Forecast - by Soft Drink Type
- 11. Competitive Analysis
- 11.1. Global Market Share Analysis 2024
- 11.2. Company Profiles
- 11.2.1 Carabao Group Public Company Limited
- 11.2.1.1. Overview
- 11.2.1.2. Products
- 11.2.1.3. SWOT Analysis
- 11.2.1.4. Recent Developments
- 11.2.1.5. Financials (Based on Availability)
- 11.2.2 Hell Energy Magyarország Korlátolt Felelosségu Társaság
- 11.2.2.1. Overview
- 11.2.2.2. Products
- 11.2.2.3. SWOT Analysis
- 11.2.2.4. Recent Developments
- 11.2.2.5. Financials (Based on Availability)
- 11.2.3 Aje Group
- 11.2.3.1. Overview
- 11.2.3.2. Products
- 11.2.3.3. SWOT Analysis
- 11.2.3.4. Recent Developments
- 11.2.3.5. Financials (Based on Availability)
- 11.2.4 Monster Beverage Corporation
- 11.2.4.1. Overview
- 11.2.4.2. Products
- 11.2.4.3. SWOT Analysis
- 11.2.4.4. Recent Developments
- 11.2.4.5. Financials (Based on Availability)
- 11.2.5 PepsiCo Inc
- 11.2.5.1. Overview
- 11.2.5.2. Products
- 11.2.5.3. SWOT Analysis
- 11.2.5.4. Recent Developments
- 11.2.5.5. Financials (Based on Availability)
- 11.2.6 The Coca-Cola Compan
- 11.2.6.1. Overview
- 11.2.6.2. Products
- 11.2.6.3. SWOT Analysis
- 11.2.6.4. Recent Developments
- 11.2.6.5. Financials (Based on Availability)
- 11.2.7 Suntory Holdings Limited
- 11.2.7.1. Overview
- 11.2.7.2. Products
- 11.2.7.3. SWOT Analysis
- 11.2.7.4. Recent Developments
- 11.2.7.5. Financials (Based on Availability)
- 11.2.8 Red Bull GmbH
- 11.2.8.1. Overview
- 11.2.8.2. Products
- 11.2.8.3. SWOT Analysis
- 11.2.8.4. Recent Developments
- 11.2.8.5. Financials (Based on Availability)
- 11.2.9 Living Essentials LLC
- 11.2.9.1. Overview
- 11.2.9.2. Products
- 11.2.9.3. SWOT Analysis
- 11.2.9.4. Recent Developments
- 11.2.9.5. Financials (Based on Availability)
- 11.2.10 T C Pharmaceutical Industries Company Limited
- 11.2.10.1. Overview
- 11.2.10.2. Products
- 11.2.10.3. SWOT Analysis
- 11.2.10.4. Recent Developments
- 11.2.10.5. Financials (Based on Availability)
- 11.2.11 Taisho Pharmaceutical Holdings Co Ltd
- 11.2.11.1. Overview
- 11.2.11.2. Products
- 11.2.11.3. SWOT Analysis
- 11.2.11.4. Recent Developments
- 11.2.11.5. Financials (Based on Availability)
- 11.2.12 Congo Brands
- 11.2.12.1. Overview
- 11.2.12.2. Products
- 11.2.12.3. SWOT Analysis
- 11.2.12.4. Recent Developments
- 11.2.12.5. Financials (Based on Availability)
- 11.2.13 Osotspa Public Company Limited
- 11.2.13.1. Overview
- 11.2.13.2. Products
- 11.2.13.3. SWOT Analysis
- 11.2.13.4. Recent Developments
- 11.2.13.5. Financials (Based on Availability)
- 11.2.1 Carabao Group Public Company Limited
List of Figures
- Figure 1: Global Energy Drinks Market Revenue Breakdown (Million, %) by Region 2024 & 2032
- Figure 2: North America Energy Drinks Market Revenue (Million), by Soft Drink Type 2024 & 2032
- Figure 3: North America Energy Drinks Market Revenue Share (%), by Soft Drink Type 2024 & 2032
- Figure 4: North America Energy Drinks Market Revenue (Million), by Packaging Type 2024 & 2032
- Figure 5: North America Energy Drinks Market Revenue Share (%), by Packaging Type 2024 & 2032
- Figure 6: North America Energy Drinks Market Revenue (Million), by Distribution Channel 2024 & 2032
- Figure 7: North America Energy Drinks Market Revenue Share (%), by Distribution Channel 2024 & 2032
- Figure 8: North America Energy Drinks Market Revenue (Million), by Country 2024 & 2032
- Figure 9: North America Energy Drinks Market Revenue Share (%), by Country 2024 & 2032
- Figure 10: South America Energy Drinks Market Revenue (Million), by Soft Drink Type 2024 & 2032
- Figure 11: South America Energy Drinks Market Revenue Share (%), by Soft Drink Type 2024 & 2032
- Figure 12: South America Energy Drinks Market Revenue (Million), by Packaging Type 2024 & 2032
- Figure 13: South America Energy Drinks Market Revenue Share (%), by Packaging Type 2024 & 2032
- Figure 14: South America Energy Drinks Market Revenue (Million), by Distribution Channel 2024 & 2032
- Figure 15: South America Energy Drinks Market Revenue Share (%), by Distribution Channel 2024 & 2032
- Figure 16: South America Energy Drinks Market Revenue (Million), by Country 2024 & 2032
- Figure 17: South America Energy Drinks Market Revenue Share (%), by Country 2024 & 2032
- Figure 18: Europe Energy Drinks Market Revenue (Million), by Soft Drink Type 2024 & 2032
- Figure 19: Europe Energy Drinks Market Revenue Share (%), by Soft Drink Type 2024 & 2032
- Figure 20: Europe Energy Drinks Market Revenue (Million), by Packaging Type 2024 & 2032
- Figure 21: Europe Energy Drinks Market Revenue Share (%), by Packaging Type 2024 & 2032
- Figure 22: Europe Energy Drinks Market Revenue (Million), by Distribution Channel 2024 & 2032
- Figure 23: Europe Energy Drinks Market Revenue Share (%), by Distribution Channel 2024 & 2032
- Figure 24: Europe Energy Drinks Market Revenue (Million), by Country 2024 & 2032
- Figure 25: Europe Energy Drinks Market Revenue Share (%), by Country 2024 & 2032
- Figure 26: Middle East & Africa Energy Drinks Market Revenue (Million), by Soft Drink Type 2024 & 2032
- Figure 27: Middle East & Africa Energy Drinks Market Revenue Share (%), by Soft Drink Type 2024 & 2032
- Figure 28: Middle East & Africa Energy Drinks Market Revenue (Million), by Packaging Type 2024 & 2032
- Figure 29: Middle East & Africa Energy Drinks Market Revenue Share (%), by Packaging Type 2024 & 2032
- Figure 30: Middle East & Africa Energy Drinks Market Revenue (Million), by Distribution Channel 2024 & 2032
- Figure 31: Middle East & Africa Energy Drinks Market Revenue Share (%), by Distribution Channel 2024 & 2032
- Figure 32: Middle East & Africa Energy Drinks Market Revenue (Million), by Country 2024 & 2032
- Figure 33: Middle East & Africa Energy Drinks Market Revenue Share (%), by Country 2024 & 2032
- Figure 34: Asia Pacific Energy Drinks Market Revenue (Million), by Soft Drink Type 2024 & 2032
- Figure 35: Asia Pacific Energy Drinks Market Revenue Share (%), by Soft Drink Type 2024 & 2032
- Figure 36: Asia Pacific Energy Drinks Market Revenue (Million), by Packaging Type 2024 & 2032
- Figure 37: Asia Pacific Energy Drinks Market Revenue Share (%), by Packaging Type 2024 & 2032
- Figure 38: Asia Pacific Energy Drinks Market Revenue (Million), by Distribution Channel 2024 & 2032
- Figure 39: Asia Pacific Energy Drinks Market Revenue Share (%), by Distribution Channel 2024 & 2032
- Figure 40: Asia Pacific Energy Drinks Market Revenue (Million), by Country 2024 & 2032
- Figure 41: Asia Pacific Energy Drinks Market Revenue Share (%), by Country 2024 & 2032
List of Tables
- Table 1: Global Energy Drinks Market Revenue Million Forecast, by Region 2019 & 2032
- Table 2: Global Energy Drinks Market Revenue Million Forecast, by Soft Drink Type 2019 & 2032
- Table 3: Global Energy Drinks Market Revenue Million Forecast, by Packaging Type 2019 & 2032
- Table 4: Global Energy Drinks Market Revenue Million Forecast, by Distribution Channel 2019 & 2032
- Table 5: Global Energy Drinks Market Revenue Million Forecast, by Region 2019 & 2032
- Table 6: Global Energy Drinks Market Revenue Million Forecast, by Soft Drink Type 2019 & 2032
- Table 7: Global Energy Drinks Market Revenue Million Forecast, by Packaging Type 2019 & 2032
- Table 8: Global Energy Drinks Market Revenue Million Forecast, by Distribution Channel 2019 & 2032
- Table 9: Global Energy Drinks Market Revenue Million Forecast, by Country 2019 & 2032
- Table 10: United States Energy Drinks Market Revenue (Million) Forecast, by Application 2019 & 2032
- Table 11: Canada Energy Drinks Market Revenue (Million) Forecast, by Application 2019 & 2032
- Table 12: Mexico Energy Drinks Market Revenue (Million) Forecast, by Application 2019 & 2032
- Table 13: Global Energy Drinks Market Revenue Million Forecast, by Soft Drink Type 2019 & 2032
- Table 14: Global Energy Drinks Market Revenue Million Forecast, by Packaging Type 2019 & 2032
- Table 15: Global Energy Drinks Market Revenue Million Forecast, by Distribution Channel 2019 & 2032
- Table 16: Global Energy Drinks Market Revenue Million Forecast, by Country 2019 & 2032
- Table 17: Brazil Energy Drinks Market Revenue (Million) Forecast, by Application 2019 & 2032
- Table 18: Argentina Energy Drinks Market Revenue (Million) Forecast, by Application 2019 & 2032
- Table 19: Rest of South America Energy Drinks Market Revenue (Million) Forecast, by Application 2019 & 2032
- Table 20: Global Energy Drinks Market Revenue Million Forecast, by Soft Drink Type 2019 & 2032
- Table 21: Global Energy Drinks Market Revenue Million Forecast, by Packaging Type 2019 & 2032
- Table 22: Global Energy Drinks Market Revenue Million Forecast, by Distribution Channel 2019 & 2032
- Table 23: Global Energy Drinks Market Revenue Million Forecast, by Country 2019 & 2032
- Table 24: United Kingdom Energy Drinks Market Revenue (Million) Forecast, by Application 2019 & 2032
- Table 25: Germany Energy Drinks Market Revenue (Million) Forecast, by Application 2019 & 2032
- Table 26: France Energy Drinks Market Revenue (Million) Forecast, by Application 2019 & 2032
- Table 27: Italy Energy Drinks Market Revenue (Million) Forecast, by Application 2019 & 2032
- Table 28: Spain Energy Drinks Market Revenue (Million) Forecast, by Application 2019 & 2032
- Table 29: Russia Energy Drinks Market Revenue (Million) Forecast, by Application 2019 & 2032
- Table 30: Benelux Energy Drinks Market Revenue (Million) Forecast, by Application 2019 & 2032
- Table 31: Nordics Energy Drinks Market Revenue (Million) Forecast, by Application 2019 & 2032
- Table 32: Rest of Europe Energy Drinks Market Revenue (Million) Forecast, by Application 2019 & 2032
- Table 33: Global Energy Drinks Market Revenue Million Forecast, by Soft Drink Type 2019 & 2032
- Table 34: Global Energy Drinks Market Revenue Million Forecast, by Packaging Type 2019 & 2032
- Table 35: Global Energy Drinks Market Revenue Million Forecast, by Distribution Channel 2019 & 2032
- Table 36: Global Energy Drinks Market Revenue Million Forecast, by Country 2019 & 2032
- Table 37: Turkey Energy Drinks Market Revenue (Million) Forecast, by Application 2019 & 2032
- Table 38: Israel Energy Drinks Market Revenue (Million) Forecast, by Application 2019 & 2032
- Table 39: GCC Energy Drinks Market Revenue (Million) Forecast, by Application 2019 & 2032
- Table 40: North Africa Energy Drinks Market Revenue (Million) Forecast, by Application 2019 & 2032
- Table 41: South Africa Energy Drinks Market Revenue (Million) Forecast, by Application 2019 & 2032
- Table 42: Rest of Middle East & Africa Energy Drinks Market Revenue (Million) Forecast, by Application 2019 & 2032
- Table 43: Global Energy Drinks Market Revenue Million Forecast, by Soft Drink Type 2019 & 2032
- Table 44: Global Energy Drinks Market Revenue Million Forecast, by Packaging Type 2019 & 2032
- Table 45: Global Energy Drinks Market Revenue Million Forecast, by Distribution Channel 2019 & 2032
- Table 46: Global Energy Drinks Market Revenue Million Forecast, by Country 2019 & 2032
- Table 47: China Energy Drinks Market Revenue (Million) Forecast, by Application 2019 & 2032
- Table 48: India Energy Drinks Market Revenue (Million) Forecast, by Application 2019 & 2032
- Table 49: Japan Energy Drinks Market Revenue (Million) Forecast, by Application 2019 & 2032
- Table 50: South Korea Energy Drinks Market Revenue (Million) Forecast, by Application 2019 & 2032
- Table 51: ASEAN Energy Drinks Market Revenue (Million) Forecast, by Application 2019 & 2032
- Table 52: Oceania Energy Drinks Market Revenue (Million) Forecast, by Application 2019 & 2032
- Table 53: Rest of Asia Pacific Energy Drinks Market Revenue (Million) Forecast, by Application 2019 & 2032
Frequently Asked Questions
1. What is the projected Compound Annual Growth Rate (CAGR) of the Energy Drinks Market?
The projected CAGR is approximately 12.50%.
2. Which companies are prominent players in the Energy Drinks Market?
Key companies in the market include Carabao Group Public Company Limited, Hell Energy Magyarország Korlátolt Felelosségu Társaság, Aje Group, Monster Beverage Corporation, PepsiCo Inc, The Coca-Cola Compan, Suntory Holdings Limited, Red Bull GmbH, Living Essentials LLC, T C Pharmaceutical Industries Company Limited, Taisho Pharmaceutical Holdings Co Ltd, Congo Brands, Osotspa Public Company Limited.
3. What are the main segments of the Energy Drinks Market?
The market segments include Soft Drink Type, Packaging Type, Distribution Channel.
4. Can you provide details about the market size?
The market size is estimated to be USD XX Million as of 2022.
5. What are some drivers contributing to market growth?
Increasing Demand for Supplement Nutrition; Growing Casein Application in Processed Food Products.
6. What are the notable trends driving market growth?
OTHER KEY INDUSTRY TRENDS COVERED IN THE REPORT.
7. Are there any restraints impacting market growth?
Competition from Vegan/Plant-based Protein Powders.
8. Can you provide examples of recent developments in the market?
October 2023: Quality Pack International, a member of Hell Group and the Azerbijan company signed an agreement to establish a joint venture company the Quality Pack Capian LLC. QPC’s objective is to implement a vertically integrated aluminum beverage can manufacturing and non-alcoholic beverage filling factory in the Alat Free Economic Zone of Azerbaijan, which can serve as a regional production hub for local and regional beverage brands, either selling empty cans alone or also filling them.September 2023: PepsiCo India launched a limited edition flavor of its Sting Energy drink, called Sting Blue Current. Sting Blue Current is available at 200 ml in single-serve packs across India.September 2023: Red Bull unveiled its first limited Winter Edition in the United Kingdom. Red Bull Winter Edition Spiced Pear offers a blend of pear accented with a dash of cinnamon.
9. What pricing options are available for accessing the report?
Pricing options include single-user, multi-user, and enterprise licenses priced at USD 3800, USD 4500, and USD 5800 respectively.
10. Is the market size provided in terms of value or volume?
The market size is provided in terms of value, measured in Million.
11. Are there any specific market keywords associated with the report?
Yes, the market keyword associated with the report is "Energy Drinks Market," which aids in identifying and referencing the specific market segment covered.
12. How do I determine which pricing option suits my needs best?
The pricing options vary based on user requirements and access needs. Individual users may opt for single-user licenses, while businesses requiring broader access may choose multi-user or enterprise licenses for cost-effective access to the report.
13. Are there any additional resources or data provided in the Energy Drinks Market report?
While the report offers comprehensive insights, it's advisable to review the specific contents or supplementary materials provided to ascertain if additional resources or data are available.
14. How can I stay updated on further developments or reports in the Energy Drinks Market?
To stay informed about further developments, trends, and reports in the Energy Drinks Market, consider subscribing to industry newsletters, following relevant companies and organizations, or regularly checking reputable industry news sources and publications.
Methodology
Step 1 - Identification of Relevant Samples Size from Population Database


Step 2 - Approaches for Defining Global Market Size (Value, Volume* & Price*)

Note*: In applicable scenarios
Step 3 - Data Sources
Primary Research
- Web Analytics
- Survey Reports
- Research Institute
- Latest Research Reports
- Opinion Leaders
Secondary Research
- Annual Reports
- White Paper
- Latest Press Release
- Industry Association
- Paid Database
- Investor Presentations

Step 4 - Data Triangulation
Involves using different sources of information in order to increase the validity of a study
These sources are likely to be stakeholders in a program - participants, other researchers, program staff, other community members, and so on.
Then we put all data in single framework & apply various statistical tools to find out the dynamic on the market.
During the analysis stage, feedback from the stakeholder groups would be compared to determine areas of agreement as well as areas of divergence
