

Key Insights
The global orthopedic regenerative surgical products market is experiencing robust growth, driven by an aging population, increasing prevalence of osteoarthritis and other degenerative joint diseases, and advancements in surgical techniques. The market's expansion is fueled by the rising demand for minimally invasive procedures, improved patient outcomes, and a growing preference for regenerative therapies over traditional surgical interventions. The market is segmented by product type (allograft, cell-based therapies, viscosupplements), application (orthopedic pain management, trauma repair, cartilage and tendon repair, joint reconstruction), and end-user (hospitals, ambulatory surgical centers). While allograft products currently hold a significant market share due to established clinical use and relatively lower cost, cell-based therapies are experiencing rapid growth due to their superior regenerative potential and potential for long-term solutions. Viscosupplements, though less impactful in terms of market size, provide a valuable option for pain management and joint lubrication. The geographic distribution of the market is diverse, with North America and Europe currently dominating due to higher healthcare expenditure and advanced medical infrastructure. However, emerging markets in Asia-Pacific and other regions are witnessing rapid expansion, driven by increasing healthcare awareness and investment in advanced medical technologies. This presents substantial opportunities for market players to expand their presence in these regions.
The competitive landscape is characterized by a mix of established multinational corporations and specialized biotech companies. Key players such as Smith & Nephew, Zimmer Biomet, and Stryker are leveraging their established distribution networks and brand recognition to maintain market leadership. However, smaller, innovative companies are focusing on developing novel cell-based and other advanced therapies, posing a significant competitive challenge. Strategic collaborations, mergers, and acquisitions are becoming increasingly common as companies strive to expand their product portfolios and gain a competitive edge. Future market growth is projected to be driven by ongoing research and development in regenerative medicine, the introduction of innovative products, and increasing government support for healthcare infrastructure development. The challenges to market growth include high costs associated with some advanced therapies, regulatory hurdles for new product approvals, and variability in reimbursement policies across different healthcare systems.
Global Orthopedic Regenerative Surgical Products Market Report: 2019-2033
This comprehensive report provides a detailed analysis of the Global Orthopedic Regenerative Surgical Products Market, offering invaluable insights for industry stakeholders, investors, and strategic decision-makers. The study period covers 2019-2033, with a base year of 2025 and a forecast period of 2025-2033. The market is segmented by product (Allograft, Cell-based, Viscosupplements), application (Orthopedic Pain Management, Trauma Repair, Cartilage and Tendon Repair, Joint Reconstruction, Others), and end-user (Hospitals, Ambulatory Surgical Centers, Others). Key players analyzed include MIMEDX, Smith & Nephew, AlloSource, Arthrex Inc, Baxter, Aptissen S.A., Stryker, Amniox Medical Inc, Anika Therapeutics Inc, Vericel Corporation, and Zimmer Biomet. The report projects a market value of XX Million by 2033, exhibiting a CAGR of XX% during the forecast period.
Global Orthopedic Regenerative Surgical Products Market Concentration & Dynamics
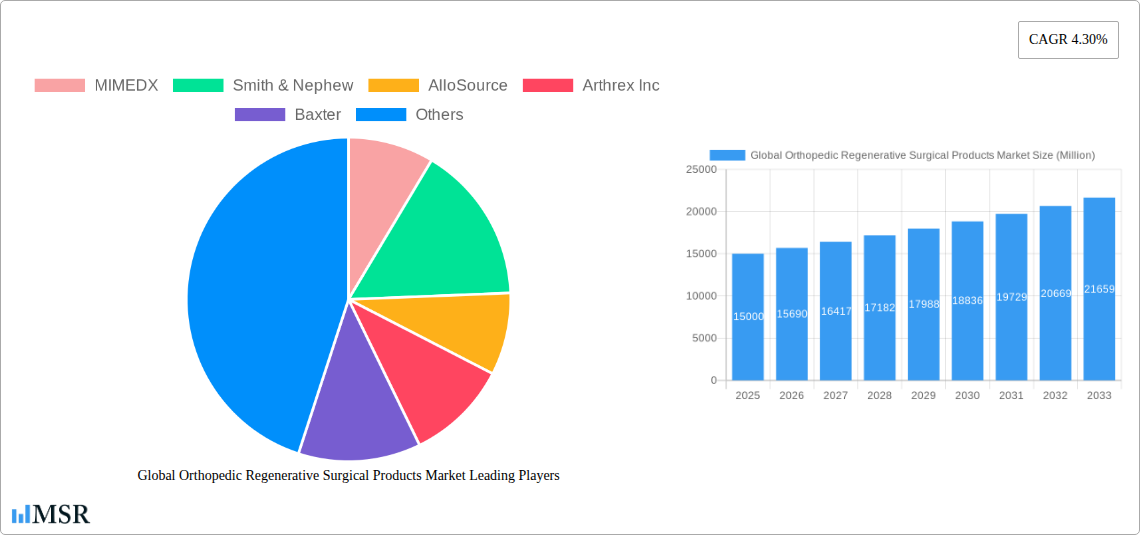
The global orthopedic regenerative surgical products market exhibits a moderately concentrated landscape, with a few major players holding significant market share. The market share distribution among the top 5 players is estimated at xx%. Innovation is a key driver, with companies investing heavily in R&D to develop advanced products and technologies. The regulatory framework governing these products varies across regions, influencing market entry and growth. Substitute products, such as traditional surgical techniques, pose competitive pressure. End-user trends favor minimally invasive procedures and personalized medicine, driving demand for innovative regenerative solutions. M&A activity within the sector has been moderately active in recent years, with xx major deals recorded between 2019 and 2024. This activity reflects the strategic importance of acquiring innovative technologies and expanding market reach. The market is influenced by factors like aging populations, rising incidence of orthopedic injuries and conditions, and increasing healthcare spending.
- Market Share: Top 5 players hold approximately xx% of the market.
- M&A Activity: xx major deals between 2019-2024.
- Regulatory Landscape: Varies significantly by region, impacting market entry.
Global Orthopedic Regenerative Surgical Products Market Industry Insights & Trends
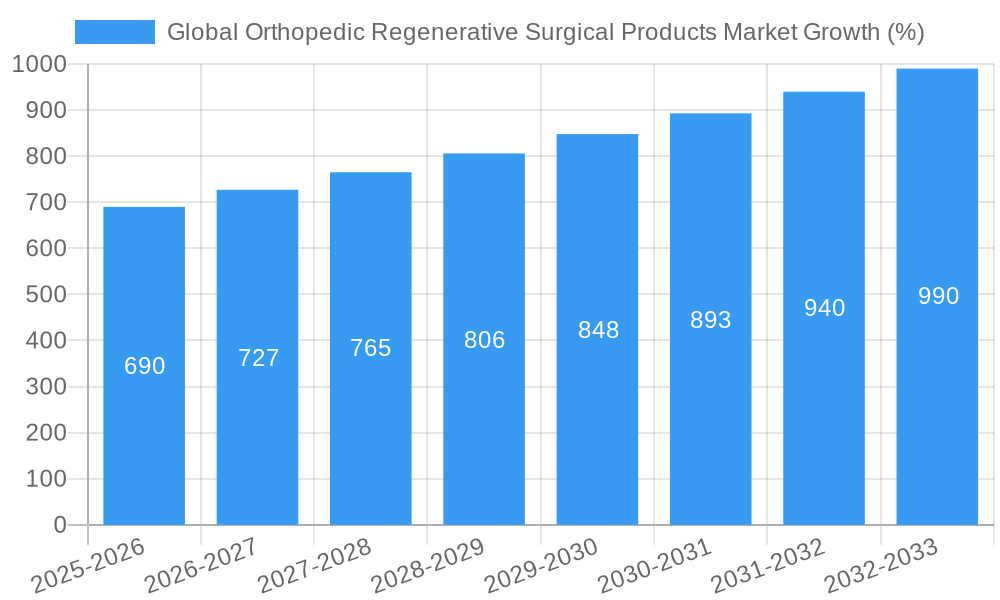
The global orthopedic regenerative surgical products market is experiencing robust growth, driven by several key factors. The market size reached XX Million in 2024 and is projected to reach XX Million by 2033, exhibiting a substantial CAGR of XX%. Technological advancements, such as the development of bioengineered tissues and improved delivery systems, are revolutionizing the field. Evolving consumer preferences towards less invasive procedures and faster recovery times are also boosting market growth. The increasing prevalence of orthopedic conditions, particularly in aging populations, is creating a significant demand for these products. Furthermore, growing awareness regarding the benefits of regenerative therapies is further fueling market expansion. The rising investment in research and development, combined with strategic collaborations between industry players and research institutions, is accelerating innovation and enhancing product offerings. However, high product costs and reimbursement challenges remain significant hurdles.
Key Markets & Segments Leading Global Orthopedic Regenerative Surgical Products Market
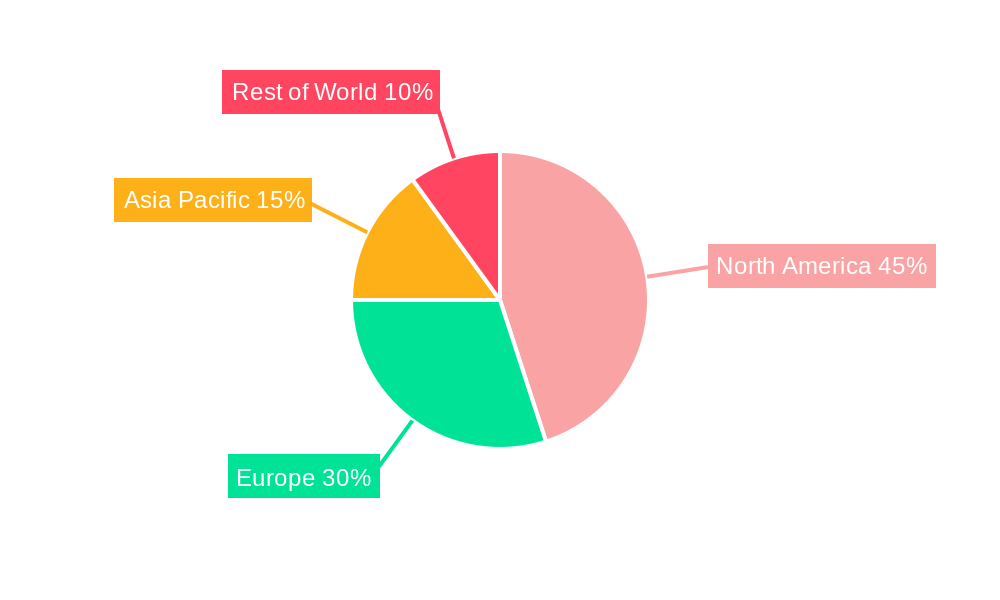
The North American region currently dominates the global orthopedic regenerative surgical products market, owing to factors like advanced healthcare infrastructure, high adoption rates of innovative technologies, and strong regulatory support. However, the Asia-Pacific region is poised for substantial growth driven by rising disposable incomes, expanding healthcare infrastructure, and a growing geriatric population.
Key Market Drivers:
- North America: Advanced healthcare infrastructure, high adoption of new technologies.
- Asia-Pacific: Rising disposable incomes, expanding healthcare infrastructure, large aging population.
- Europe: Stringent regulatory environment but growing demand.
Dominant Segments:
- By Product: Allograft products hold the largest market share due to their established track record and wider availability compared to cell-based therapies. However, cell-based therapies are expected to witness significant growth due to their potential for more personalized treatments. Viscosupplements occupy a smaller segment but are crucial for pain management.
- By Application: Orthopedic pain management represents a major application segment, followed by cartilage and tendon repair. Trauma repair also contributes significantly.
- By End-User: Hospitals are the primary end-users, followed by ambulatory surgical centers.
Global Orthopedic Regenerative Surgical Products Market Product Developments
Significant advancements in biomaterials science have led to the development of novel allografts with enhanced biocompatibility and improved functional outcomes. Similarly, cell-based therapies are witnessing significant innovations, with advancements in cell processing techniques and improved delivery methods. The focus is on developing more efficient, cost-effective, and personalized regenerative solutions to meet the growing clinical needs. Competition is driving improvements in product efficacy and safety profiles.
Challenges in the Global Orthopedic Regenerative Surgical Products Market Market
The market faces challenges including stringent regulatory approvals, high manufacturing costs, and reimbursement hurdles. These factors can limit market access and affordability. Furthermore, competition from established surgical techniques and alternative therapies poses a constant challenge. Supply chain disruptions and shortages of raw materials can also affect production and availability. The overall effect is a slower market growth than anticipated. An estimated XX% reduction in market growth is predicted due to these combined challenges.
Forces Driving Global Orthopedic Regenerative Surgical Products Market Growth
Several factors are driving market growth, including technological advancements, favorable reimbursement policies in certain regions, and a growing awareness of the benefits of regenerative therapies. The aging global population and rising incidence of orthopedic injuries further contribute to the market expansion. Government initiatives promoting the adoption of innovative healthcare technologies also play a significant role. Finally, the increasing focus on minimally invasive procedures and personalized medicine is driving demand for these products.
Challenges in the Global Orthopedic Regenerative Surgical Products Market Market
Long-term growth is fueled by continued innovation in biomaterials, cell processing, and delivery systems. Strategic partnerships between biotech companies and medical device manufacturers are further enhancing product development and market penetration. Expanding into emerging markets, particularly in developing economies with high unmet needs, also provides significant growth opportunities.
Emerging Opportunities in Global Orthopedic Regenerative Surgical Products Market
Emerging opportunities include the development of personalized therapies tailored to individual patient needs, expansion into new applications like sports medicine, and leveraging technological advances such as AI and machine learning to improve product development and treatment outcomes. The growing demand for minimally invasive procedures and point-of-care diagnostics create new avenues for product innovation and market expansion. Focusing on cost-effective solutions is crucial for wider accessibility.
Leading Players in the Global Orthopedic Regenerative Surgical Products Sector
- MIMEDX
- Smith & Nephew
- AlloSource
- Arthrex Inc
- Baxter
- Aptissen S.A.
- Stryker
- Amniox Medical Inc
- Anika Therapeutics Inc
- Vericel Corporation
- Zimmer Biomet
Key Milestones in Global Orthopedic Regenerative Surgical Products Industry
- 2020: FDA approval of a novel allograft for cartilage repair by Company X.
- 2021: Launch of a new cell-based therapy for tendon repair by Company Y.
- 2022: Acquisition of Company Z by a major medical device company.
- 2023: Successful clinical trial results for a new viscosupplement.
- 2024: Strategic partnership between two leading companies to develop a new regenerative technology. (Further milestones can be added as data becomes available).
Strategic Outlook for Global Orthopedic Regenerative Surgical Products Market Market
The future of the orthopedic regenerative surgical products market is bright, driven by continuous technological advancements, favorable regulatory landscapes in key regions, and a rising demand for effective treatments. Strategic partnerships, focused R&D efforts, and market expansion into emerging economies present significant growth accelerators. Companies focusing on personalized medicine, minimally invasive techniques, and cost-effective solutions are poised for substantial success. The market is predicted to reach XX Million in 2033, representing a strong long-term growth potential.
Global Orthopedic Regenerative Surgical Products Market Segmentation
-
1. Product
- 1.1. Allograft
- 1.2. Cell-based
- 1.3. Viscosupplements
-
2. Applications
- 2.1. Orthopedic Pain Management
- 2.2. Trauma Repair
- 2.3. Cartilage and Tendon Repair
- 2.4. Joint Reconstruction
- 2.5. Others
-
3. End-User
- 3.1. Hospitals
- 3.2. Ambulatory Surgical Centers
- 3.3. Others
Global Orthopedic Regenerative Surgical Products Market Segmentation By Geography
-
1. North America
- 1.1. United States
- 1.2. Canada
- 1.3. Mexico
-
2. Europe
- 2.1. Germany
- 2.2. United Kingdom
- 2.3. France
- 2.4. Italy
- 2.5. Spain
- 2.6. Rest of Europe
-
3. Asia Pacific
- 3.1. China
- 3.2. Japan
- 3.3. India
- 3.4. Australia
- 3.5. South Korea
- 3.6. Rest of Asia Pacific
-
4. Middle East and Africa
- 4.1. GCC
- 4.2. South Africa
- 4.3. Rest of Middle East and Africa
-
5. South America
- 5.1. Brazil
- 5.2. Argentina
- 5.3. Rest of South America
Global Orthopedic Regenerative Surgical Products Market REPORT HIGHLIGHTS
| Aspects | Details |
|---|---|
| Study Period | 2019-2033 |
| Base Year | 2024 |
| Estimated Year | 2025 |
| Forecast Period | 2025-2033 |
| Historical Period | 2019-2024 |
| Growth Rate | CAGR of 4.30% from 2019-2033 |
| Segmentation |
|
Table of Contents
- 1. Introduction
- 1.1. Research Scope
- 1.2. Market Segmentation
- 1.3. Research Methodology
- 1.4. Definitions and Assumptions
- 2. Executive Summary
- 2.1. Introduction
- 3. Market Dynamics
- 3.1. Introduction
- 3.2. Market Drivers
- 3.2.1. Rise in the Prevalence of Orthopedic Diseases; Increasing Geriatric Population; Technological Advancements in the Products
- 3.3. Market Restrains
- 3.3.1. High Cost of Products; Stringent Regulatory Scenario
- 3.4. Market Trends
- 3.4.1. Viscosupplements is Expected to Hold a Significant Share Over the Forecast Period
- 4. Market Factor Analysis
- 4.1. Porters Five Forces
- 4.2. Supply/Value Chain
- 4.3. PESTEL analysis
- 4.4. Market Entropy
- 4.5. Patent/Trademark Analysis
- 5. Global Orthopedic Regenerative Surgical Products Market Analysis, Insights and Forecast, 2019-2031
- 5.1. Market Analysis, Insights and Forecast - by Product
- 5.1.1. Allograft
- 5.1.2. Cell-based
- 5.1.3. Viscosupplements
- 5.2. Market Analysis, Insights and Forecast - by Applications
- 5.2.1. Orthopedic Pain Management
- 5.2.2. Trauma Repair
- 5.2.3. Cartilage and Tendon Repair
- 5.2.4. Joint Reconstruction
- 5.2.5. Others
- 5.3. Market Analysis, Insights and Forecast - by End-User
- 5.3.1. Hospitals
- 5.3.2. Ambulatory Surgical Centers
- 5.3.3. Others
- 5.4. Market Analysis, Insights and Forecast - by Region
- 5.4.1. North America
- 5.4.2. Europe
- 5.4.3. Asia Pacific
- 5.4.4. Middle East and Africa
- 5.4.5. South America
- 5.1. Market Analysis, Insights and Forecast - by Product
- 6. North America Global Orthopedic Regenerative Surgical Products Market Analysis, Insights and Forecast, 2019-2031
- 6.1. Market Analysis, Insights and Forecast - by Product
- 6.1.1. Allograft
- 6.1.2. Cell-based
- 6.1.3. Viscosupplements
- 6.2. Market Analysis, Insights and Forecast - by Applications
- 6.2.1. Orthopedic Pain Management
- 6.2.2. Trauma Repair
- 6.2.3. Cartilage and Tendon Repair
- 6.2.4. Joint Reconstruction
- 6.2.5. Others
- 6.3. Market Analysis, Insights and Forecast - by End-User
- 6.3.1. Hospitals
- 6.3.2. Ambulatory Surgical Centers
- 6.3.3. Others
- 6.1. Market Analysis, Insights and Forecast - by Product
- 7. Europe Global Orthopedic Regenerative Surgical Products Market Analysis, Insights and Forecast, 2019-2031
- 7.1. Market Analysis, Insights and Forecast - by Product
- 7.1.1. Allograft
- 7.1.2. Cell-based
- 7.1.3. Viscosupplements
- 7.2. Market Analysis, Insights and Forecast - by Applications
- 7.2.1. Orthopedic Pain Management
- 7.2.2. Trauma Repair
- 7.2.3. Cartilage and Tendon Repair
- 7.2.4. Joint Reconstruction
- 7.2.5. Others
- 7.3. Market Analysis, Insights and Forecast - by End-User
- 7.3.1. Hospitals
- 7.3.2. Ambulatory Surgical Centers
- 7.3.3. Others
- 7.1. Market Analysis, Insights and Forecast - by Product
- 8. Asia Pacific Global Orthopedic Regenerative Surgical Products Market Analysis, Insights and Forecast, 2019-2031
- 8.1. Market Analysis, Insights and Forecast - by Product
- 8.1.1. Allograft
- 8.1.2. Cell-based
- 8.1.3. Viscosupplements
- 8.2. Market Analysis, Insights and Forecast - by Applications
- 8.2.1. Orthopedic Pain Management
- 8.2.2. Trauma Repair
- 8.2.3. Cartilage and Tendon Repair
- 8.2.4. Joint Reconstruction
- 8.2.5. Others
- 8.3. Market Analysis, Insights and Forecast - by End-User
- 8.3.1. Hospitals
- 8.3.2. Ambulatory Surgical Centers
- 8.3.3. Others
- 8.1. Market Analysis, Insights and Forecast - by Product
- 9. Middle East and Africa Global Orthopedic Regenerative Surgical Products Market Analysis, Insights and Forecast, 2019-2031
- 9.1. Market Analysis, Insights and Forecast - by Product
- 9.1.1. Allograft
- 9.1.2. Cell-based
- 9.1.3. Viscosupplements
- 9.2. Market Analysis, Insights and Forecast - by Applications
- 9.2.1. Orthopedic Pain Management
- 9.2.2. Trauma Repair
- 9.2.3. Cartilage and Tendon Repair
- 9.2.4. Joint Reconstruction
- 9.2.5. Others
- 9.3. Market Analysis, Insights and Forecast - by End-User
- 9.3.1. Hospitals
- 9.3.2. Ambulatory Surgical Centers
- 9.3.3. Others
- 9.1. Market Analysis, Insights and Forecast - by Product
- 10. South America Global Orthopedic Regenerative Surgical Products Market Analysis, Insights and Forecast, 2019-2031
- 10.1. Market Analysis, Insights and Forecast - by Product
- 10.1.1. Allograft
- 10.1.2. Cell-based
- 10.1.3. Viscosupplements
- 10.2. Market Analysis, Insights and Forecast - by Applications
- 10.2.1. Orthopedic Pain Management
- 10.2.2. Trauma Repair
- 10.2.3. Cartilage and Tendon Repair
- 10.2.4. Joint Reconstruction
- 10.2.5. Others
- 10.3. Market Analysis, Insights and Forecast - by End-User
- 10.3.1. Hospitals
- 10.3.2. Ambulatory Surgical Centers
- 10.3.3. Others
- 10.1. Market Analysis, Insights and Forecast - by Product
- 11. North America Global Orthopedic Regenerative Surgical Products Market Analysis, Insights and Forecast, 2019-2031
- 11.1. Market Analysis, Insights and Forecast - By Country/Sub-region
- 11.1.1 United States
- 11.1.2 Canada
- 11.1.3 Mexico
- 12. Europe Global Orthopedic Regenerative Surgical Products Market Analysis, Insights and Forecast, 2019-2031
- 12.1. Market Analysis, Insights and Forecast - By Country/Sub-region
- 12.1.1 Germany
- 12.1.2 United Kingdom
- 12.1.3 France
- 12.1.4 Italy
- 12.1.5 Spain
- 12.1.6 Rest of Europe
- 13. Asia Pacific Global Orthopedic Regenerative Surgical Products Market Analysis, Insights and Forecast, 2019-2031
- 13.1. Market Analysis, Insights and Forecast - By Country/Sub-region
- 13.1.1 China
- 13.1.2 Japan
- 13.1.3 India
- 13.1.4 Australia
- 13.1.5 South Korea
- 13.1.6 Rest of Asia Pacific
- 14. Middle East and Africa Global Orthopedic Regenerative Surgical Products Market Analysis, Insights and Forecast, 2019-2031
- 14.1. Market Analysis, Insights and Forecast - By Country/Sub-region
- 14.1.1 GCC
- 14.1.2 South Africa
- 14.1.3 Rest of Middle East and Africa
- 15. South America Global Orthopedic Regenerative Surgical Products Market Analysis, Insights and Forecast, 2019-2031
- 15.1. Market Analysis, Insights and Forecast - By Country/Sub-region
- 15.1.1 Brazil
- 15.1.2 Argentina
- 15.1.3 Rest of South America
- 16. Competitive Analysis
- 16.1. Market Share Analysis 2024
- 16.2. Company Profiles
- 16.2.1 MIMEDX
- 16.2.1.1. Overview
- 16.2.1.2. Products
- 16.2.1.3. SWOT Analysis
- 16.2.1.4. Recent Developments
- 16.2.1.5. Financials (Based on Availability)
- 16.2.2 Smith & Nephew
- 16.2.2.1. Overview
- 16.2.2.2. Products
- 16.2.2.3. SWOT Analysis
- 16.2.2.4. Recent Developments
- 16.2.2.5. Financials (Based on Availability)
- 16.2.3 AlloSource
- 16.2.3.1. Overview
- 16.2.3.2. Products
- 16.2.3.3. SWOT Analysis
- 16.2.3.4. Recent Developments
- 16.2.3.5. Financials (Based on Availability)
- 16.2.4 Arthrex Inc
- 16.2.4.1. Overview
- 16.2.4.2. Products
- 16.2.4.3. SWOT Analysis
- 16.2.4.4. Recent Developments
- 16.2.4.5. Financials (Based on Availability)
- 16.2.5 Baxter
- 16.2.5.1. Overview
- 16.2.5.2. Products
- 16.2.5.3. SWOT Analysis
- 16.2.5.4. Recent Developments
- 16.2.5.5. Financials (Based on Availability)
- 16.2.6 Aptissen S A
- 16.2.6.1. Overview
- 16.2.6.2. Products
- 16.2.6.3. SWOT Analysis
- 16.2.6.4. Recent Developments
- 16.2.6.5. Financials (Based on Availability)
- 16.2.7 Stryker
- 16.2.7.1. Overview
- 16.2.7.2. Products
- 16.2.7.3. SWOT Analysis
- 16.2.7.4. Recent Developments
- 16.2.7.5. Financials (Based on Availability)
- 16.2.8 Amniox Medical Inc
- 16.2.8.1. Overview
- 16.2.8.2. Products
- 16.2.8.3. SWOT Analysis
- 16.2.8.4. Recent Developments
- 16.2.8.5. Financials (Based on Availability)
- 16.2.9 Anika Therapeutics Inc
- 16.2.9.1. Overview
- 16.2.9.2. Products
- 16.2.9.3. SWOT Analysis
- 16.2.9.4. Recent Developments
- 16.2.9.5. Financials (Based on Availability)
- 16.2.10 Vericel Corporation
- 16.2.10.1. Overview
- 16.2.10.2. Products
- 16.2.10.3. SWOT Analysis
- 16.2.10.4. Recent Developments
- 16.2.10.5. Financials (Based on Availability)
- 16.2.11 Zimmer Biomet
- 16.2.11.1. Overview
- 16.2.11.2. Products
- 16.2.11.3. SWOT Analysis
- 16.2.11.4. Recent Developments
- 16.2.11.5. Financials (Based on Availability)
- 16.2.1 MIMEDX
List of Figures
- Figure 1: Global Global Orthopedic Regenerative Surgical Products Market Revenue Breakdown (Million, %) by Region 2024 & 2032
- Figure 2: Global Global Orthopedic Regenerative Surgical Products Market Volume Breakdown (K Unit, %) by Region 2024 & 2032
- Figure 3: North America Global Orthopedic Regenerative Surgical Products Market Revenue (Million), by Country 2024 & 2032
- Figure 4: North America Global Orthopedic Regenerative Surgical Products Market Volume (K Unit), by Country 2024 & 2032
- Figure 5: North America Global Orthopedic Regenerative Surgical Products Market Revenue Share (%), by Country 2024 & 2032
- Figure 6: North America Global Orthopedic Regenerative Surgical Products Market Volume Share (%), by Country 2024 & 2032
- Figure 7: Europe Global Orthopedic Regenerative Surgical Products Market Revenue (Million), by Country 2024 & 2032
- Figure 8: Europe Global Orthopedic Regenerative Surgical Products Market Volume (K Unit), by Country 2024 & 2032
- Figure 9: Europe Global Orthopedic Regenerative Surgical Products Market Revenue Share (%), by Country 2024 & 2032
- Figure 10: Europe Global Orthopedic Regenerative Surgical Products Market Volume Share (%), by Country 2024 & 2032
- Figure 11: Asia Pacific Global Orthopedic Regenerative Surgical Products Market Revenue (Million), by Country 2024 & 2032
- Figure 12: Asia Pacific Global Orthopedic Regenerative Surgical Products Market Volume (K Unit), by Country 2024 & 2032
- Figure 13: Asia Pacific Global Orthopedic Regenerative Surgical Products Market Revenue Share (%), by Country 2024 & 2032
- Figure 14: Asia Pacific Global Orthopedic Regenerative Surgical Products Market Volume Share (%), by Country 2024 & 2032
- Figure 15: Middle East and Africa Global Orthopedic Regenerative Surgical Products Market Revenue (Million), by Country 2024 & 2032
- Figure 16: Middle East and Africa Global Orthopedic Regenerative Surgical Products Market Volume (K Unit), by Country 2024 & 2032
- Figure 17: Middle East and Africa Global Orthopedic Regenerative Surgical Products Market Revenue Share (%), by Country 2024 & 2032
- Figure 18: Middle East and Africa Global Orthopedic Regenerative Surgical Products Market Volume Share (%), by Country 2024 & 2032
- Figure 19: South America Global Orthopedic Regenerative Surgical Products Market Revenue (Million), by Country 2024 & 2032
- Figure 20: South America Global Orthopedic Regenerative Surgical Products Market Volume (K Unit), by Country 2024 & 2032
- Figure 21: South America Global Orthopedic Regenerative Surgical Products Market Revenue Share (%), by Country 2024 & 2032
- Figure 22: South America Global Orthopedic Regenerative Surgical Products Market Volume Share (%), by Country 2024 & 2032
- Figure 23: North America Global Orthopedic Regenerative Surgical Products Market Revenue (Million), by Product 2024 & 2032
- Figure 24: North America Global Orthopedic Regenerative Surgical Products Market Volume (K Unit), by Product 2024 & 2032
- Figure 25: North America Global Orthopedic Regenerative Surgical Products Market Revenue Share (%), by Product 2024 & 2032
- Figure 26: North America Global Orthopedic Regenerative Surgical Products Market Volume Share (%), by Product 2024 & 2032
- Figure 27: North America Global Orthopedic Regenerative Surgical Products Market Revenue (Million), by Applications 2024 & 2032
- Figure 28: North America Global Orthopedic Regenerative Surgical Products Market Volume (K Unit), by Applications 2024 & 2032
- Figure 29: North America Global Orthopedic Regenerative Surgical Products Market Revenue Share (%), by Applications 2024 & 2032
- Figure 30: North America Global Orthopedic Regenerative Surgical Products Market Volume Share (%), by Applications 2024 & 2032
- Figure 31: North America Global Orthopedic Regenerative Surgical Products Market Revenue (Million), by End-User 2024 & 2032
- Figure 32: North America Global Orthopedic Regenerative Surgical Products Market Volume (K Unit), by End-User 2024 & 2032
- Figure 33: North America Global Orthopedic Regenerative Surgical Products Market Revenue Share (%), by End-User 2024 & 2032
- Figure 34: North America Global Orthopedic Regenerative Surgical Products Market Volume Share (%), by End-User 2024 & 2032
- Figure 35: North America Global Orthopedic Regenerative Surgical Products Market Revenue (Million), by Country 2024 & 2032
- Figure 36: North America Global Orthopedic Regenerative Surgical Products Market Volume (K Unit), by Country 2024 & 2032
- Figure 37: North America Global Orthopedic Regenerative Surgical Products Market Revenue Share (%), by Country 2024 & 2032
- Figure 38: North America Global Orthopedic Regenerative Surgical Products Market Volume Share (%), by Country 2024 & 2032
- Figure 39: Europe Global Orthopedic Regenerative Surgical Products Market Revenue (Million), by Product 2024 & 2032
- Figure 40: Europe Global Orthopedic Regenerative Surgical Products Market Volume (K Unit), by Product 2024 & 2032
- Figure 41: Europe Global Orthopedic Regenerative Surgical Products Market Revenue Share (%), by Product 2024 & 2032
- Figure 42: Europe Global Orthopedic Regenerative Surgical Products Market Volume Share (%), by Product 2024 & 2032
- Figure 43: Europe Global Orthopedic Regenerative Surgical Products Market Revenue (Million), by Applications 2024 & 2032
- Figure 44: Europe Global Orthopedic Regenerative Surgical Products Market Volume (K Unit), by Applications 2024 & 2032
- Figure 45: Europe Global Orthopedic Regenerative Surgical Products Market Revenue Share (%), by Applications 2024 & 2032
- Figure 46: Europe Global Orthopedic Regenerative Surgical Products Market Volume Share (%), by Applications 2024 & 2032
- Figure 47: Europe Global Orthopedic Regenerative Surgical Products Market Revenue (Million), by End-User 2024 & 2032
- Figure 48: Europe Global Orthopedic Regenerative Surgical Products Market Volume (K Unit), by End-User 2024 & 2032
- Figure 49: Europe Global Orthopedic Regenerative Surgical Products Market Revenue Share (%), by End-User 2024 & 2032
- Figure 50: Europe Global Orthopedic Regenerative Surgical Products Market Volume Share (%), by End-User 2024 & 2032
- Figure 51: Europe Global Orthopedic Regenerative Surgical Products Market Revenue (Million), by Country 2024 & 2032
- Figure 52: Europe Global Orthopedic Regenerative Surgical Products Market Volume (K Unit), by Country 2024 & 2032
- Figure 53: Europe Global Orthopedic Regenerative Surgical Products Market Revenue Share (%), by Country 2024 & 2032
- Figure 54: Europe Global Orthopedic Regenerative Surgical Products Market Volume Share (%), by Country 2024 & 2032
- Figure 55: Asia Pacific Global Orthopedic Regenerative Surgical Products Market Revenue (Million), by Product 2024 & 2032
- Figure 56: Asia Pacific Global Orthopedic Regenerative Surgical Products Market Volume (K Unit), by Product 2024 & 2032
- Figure 57: Asia Pacific Global Orthopedic Regenerative Surgical Products Market Revenue Share (%), by Product 2024 & 2032
- Figure 58: Asia Pacific Global Orthopedic Regenerative Surgical Products Market Volume Share (%), by Product 2024 & 2032
- Figure 59: Asia Pacific Global Orthopedic Regenerative Surgical Products Market Revenue (Million), by Applications 2024 & 2032
- Figure 60: Asia Pacific Global Orthopedic Regenerative Surgical Products Market Volume (K Unit), by Applications 2024 & 2032
- Figure 61: Asia Pacific Global Orthopedic Regenerative Surgical Products Market Revenue Share (%), by Applications 2024 & 2032
- Figure 62: Asia Pacific Global Orthopedic Regenerative Surgical Products Market Volume Share (%), by Applications 2024 & 2032
- Figure 63: Asia Pacific Global Orthopedic Regenerative Surgical Products Market Revenue (Million), by End-User 2024 & 2032
- Figure 64: Asia Pacific Global Orthopedic Regenerative Surgical Products Market Volume (K Unit), by End-User 2024 & 2032
- Figure 65: Asia Pacific Global Orthopedic Regenerative Surgical Products Market Revenue Share (%), by End-User 2024 & 2032
- Figure 66: Asia Pacific Global Orthopedic Regenerative Surgical Products Market Volume Share (%), by End-User 2024 & 2032
- Figure 67: Asia Pacific Global Orthopedic Regenerative Surgical Products Market Revenue (Million), by Country 2024 & 2032
- Figure 68: Asia Pacific Global Orthopedic Regenerative Surgical Products Market Volume (K Unit), by Country 2024 & 2032
- Figure 69: Asia Pacific Global Orthopedic Regenerative Surgical Products Market Revenue Share (%), by Country 2024 & 2032
- Figure 70: Asia Pacific Global Orthopedic Regenerative Surgical Products Market Volume Share (%), by Country 2024 & 2032
- Figure 71: Middle East and Africa Global Orthopedic Regenerative Surgical Products Market Revenue (Million), by Product 2024 & 2032
- Figure 72: Middle East and Africa Global Orthopedic Regenerative Surgical Products Market Volume (K Unit), by Product 2024 & 2032
- Figure 73: Middle East and Africa Global Orthopedic Regenerative Surgical Products Market Revenue Share (%), by Product 2024 & 2032
- Figure 74: Middle East and Africa Global Orthopedic Regenerative Surgical Products Market Volume Share (%), by Product 2024 & 2032
- Figure 75: Middle East and Africa Global Orthopedic Regenerative Surgical Products Market Revenue (Million), by Applications 2024 & 2032
- Figure 76: Middle East and Africa Global Orthopedic Regenerative Surgical Products Market Volume (K Unit), by Applications 2024 & 2032
- Figure 77: Middle East and Africa Global Orthopedic Regenerative Surgical Products Market Revenue Share (%), by Applications 2024 & 2032
- Figure 78: Middle East and Africa Global Orthopedic Regenerative Surgical Products Market Volume Share (%), by Applications 2024 & 2032
- Figure 79: Middle East and Africa Global Orthopedic Regenerative Surgical Products Market Revenue (Million), by End-User 2024 & 2032
- Figure 80: Middle East and Africa Global Orthopedic Regenerative Surgical Products Market Volume (K Unit), by End-User 2024 & 2032
- Figure 81: Middle East and Africa Global Orthopedic Regenerative Surgical Products Market Revenue Share (%), by End-User 2024 & 2032
- Figure 82: Middle East and Africa Global Orthopedic Regenerative Surgical Products Market Volume Share (%), by End-User 2024 & 2032
- Figure 83: Middle East and Africa Global Orthopedic Regenerative Surgical Products Market Revenue (Million), by Country 2024 & 2032
- Figure 84: Middle East and Africa Global Orthopedic Regenerative Surgical Products Market Volume (K Unit), by Country 2024 & 2032
- Figure 85: Middle East and Africa Global Orthopedic Regenerative Surgical Products Market Revenue Share (%), by Country 2024 & 2032
- Figure 86: Middle East and Africa Global Orthopedic Regenerative Surgical Products Market Volume Share (%), by Country 2024 & 2032
- Figure 87: South America Global Orthopedic Regenerative Surgical Products Market Revenue (Million), by Product 2024 & 2032
- Figure 88: South America Global Orthopedic Regenerative Surgical Products Market Volume (K Unit), by Product 2024 & 2032
- Figure 89: South America Global Orthopedic Regenerative Surgical Products Market Revenue Share (%), by Product 2024 & 2032
- Figure 90: South America Global Orthopedic Regenerative Surgical Products Market Volume Share (%), by Product 2024 & 2032
- Figure 91: South America Global Orthopedic Regenerative Surgical Products Market Revenue (Million), by Applications 2024 & 2032
- Figure 92: South America Global Orthopedic Regenerative Surgical Products Market Volume (K Unit), by Applications 2024 & 2032
- Figure 93: South America Global Orthopedic Regenerative Surgical Products Market Revenue Share (%), by Applications 2024 & 2032
- Figure 94: South America Global Orthopedic Regenerative Surgical Products Market Volume Share (%), by Applications 2024 & 2032
- Figure 95: South America Global Orthopedic Regenerative Surgical Products Market Revenue (Million), by End-User 2024 & 2032
- Figure 96: South America Global Orthopedic Regenerative Surgical Products Market Volume (K Unit), by End-User 2024 & 2032
- Figure 97: South America Global Orthopedic Regenerative Surgical Products Market Revenue Share (%), by End-User 2024 & 2032
- Figure 98: South America Global Orthopedic Regenerative Surgical Products Market Volume Share (%), by End-User 2024 & 2032
- Figure 99: South America Global Orthopedic Regenerative Surgical Products Market Revenue (Million), by Country 2024 & 2032
- Figure 100: South America Global Orthopedic Regenerative Surgical Products Market Volume (K Unit), by Country 2024 & 2032
- Figure 101: South America Global Orthopedic Regenerative Surgical Products Market Revenue Share (%), by Country 2024 & 2032
- Figure 102: South America Global Orthopedic Regenerative Surgical Products Market Volume Share (%), by Country 2024 & 2032
List of Tables
- Table 1: Global Orthopedic Regenerative Surgical Products Market Revenue Million Forecast, by Region 2019 & 2032
- Table 2: Global Orthopedic Regenerative Surgical Products Market Volume K Unit Forecast, by Region 2019 & 2032
- Table 3: Global Orthopedic Regenerative Surgical Products Market Revenue Million Forecast, by Product 2019 & 2032
- Table 4: Global Orthopedic Regenerative Surgical Products Market Volume K Unit Forecast, by Product 2019 & 2032
- Table 5: Global Orthopedic Regenerative Surgical Products Market Revenue Million Forecast, by Applications 2019 & 2032
- Table 6: Global Orthopedic Regenerative Surgical Products Market Volume K Unit Forecast, by Applications 2019 & 2032
- Table 7: Global Orthopedic Regenerative Surgical Products Market Revenue Million Forecast, by End-User 2019 & 2032
- Table 8: Global Orthopedic Regenerative Surgical Products Market Volume K Unit Forecast, by End-User 2019 & 2032
- Table 9: Global Orthopedic Regenerative Surgical Products Market Revenue Million Forecast, by Region 2019 & 2032
- Table 10: Global Orthopedic Regenerative Surgical Products Market Volume K Unit Forecast, by Region 2019 & 2032
- Table 11: Global Orthopedic Regenerative Surgical Products Market Revenue Million Forecast, by Country 2019 & 2032
- Table 12: Global Orthopedic Regenerative Surgical Products Market Volume K Unit Forecast, by Country 2019 & 2032
- Table 13: United States Global Orthopedic Regenerative Surgical Products Market Revenue (Million) Forecast, by Application 2019 & 2032
- Table 14: United States Global Orthopedic Regenerative Surgical Products Market Volume (K Unit) Forecast, by Application 2019 & 2032
- Table 15: Canada Global Orthopedic Regenerative Surgical Products Market Revenue (Million) Forecast, by Application 2019 & 2032
- Table 16: Canada Global Orthopedic Regenerative Surgical Products Market Volume (K Unit) Forecast, by Application 2019 & 2032
- Table 17: Mexico Global Orthopedic Regenerative Surgical Products Market Revenue (Million) Forecast, by Application 2019 & 2032
- Table 18: Mexico Global Orthopedic Regenerative Surgical Products Market Volume (K Unit) Forecast, by Application 2019 & 2032
- Table 19: Global Orthopedic Regenerative Surgical Products Market Revenue Million Forecast, by Country 2019 & 2032
- Table 20: Global Orthopedic Regenerative Surgical Products Market Volume K Unit Forecast, by Country 2019 & 2032
- Table 21: Germany Global Orthopedic Regenerative Surgical Products Market Revenue (Million) Forecast, by Application 2019 & 2032
- Table 22: Germany Global Orthopedic Regenerative Surgical Products Market Volume (K Unit) Forecast, by Application 2019 & 2032
- Table 23: United Kingdom Global Orthopedic Regenerative Surgical Products Market Revenue (Million) Forecast, by Application 2019 & 2032
- Table 24: United Kingdom Global Orthopedic Regenerative Surgical Products Market Volume (K Unit) Forecast, by Application 2019 & 2032
- Table 25: France Global Orthopedic Regenerative Surgical Products Market Revenue (Million) Forecast, by Application 2019 & 2032
- Table 26: France Global Orthopedic Regenerative Surgical Products Market Volume (K Unit) Forecast, by Application 2019 & 2032
- Table 27: Italy Global Orthopedic Regenerative Surgical Products Market Revenue (Million) Forecast, by Application 2019 & 2032
- Table 28: Italy Global Orthopedic Regenerative Surgical Products Market Volume (K Unit) Forecast, by Application 2019 & 2032
- Table 29: Spain Global Orthopedic Regenerative Surgical Products Market Revenue (Million) Forecast, by Application 2019 & 2032
- Table 30: Spain Global Orthopedic Regenerative Surgical Products Market Volume (K Unit) Forecast, by Application 2019 & 2032
- Table 31: Rest of Europe Global Orthopedic Regenerative Surgical Products Market Revenue (Million) Forecast, by Application 2019 & 2032
- Table 32: Rest of Europe Global Orthopedic Regenerative Surgical Products Market Volume (K Unit) Forecast, by Application 2019 & 2032
- Table 33: Global Orthopedic Regenerative Surgical Products Market Revenue Million Forecast, by Country 2019 & 2032
- Table 34: Global Orthopedic Regenerative Surgical Products Market Volume K Unit Forecast, by Country 2019 & 2032
- Table 35: China Global Orthopedic Regenerative Surgical Products Market Revenue (Million) Forecast, by Application 2019 & 2032
- Table 36: China Global Orthopedic Regenerative Surgical Products Market Volume (K Unit) Forecast, by Application 2019 & 2032
- Table 37: Japan Global Orthopedic Regenerative Surgical Products Market Revenue (Million) Forecast, by Application 2019 & 2032
- Table 38: Japan Global Orthopedic Regenerative Surgical Products Market Volume (K Unit) Forecast, by Application 2019 & 2032
- Table 39: India Global Orthopedic Regenerative Surgical Products Market Revenue (Million) Forecast, by Application 2019 & 2032
- Table 40: India Global Orthopedic Regenerative Surgical Products Market Volume (K Unit) Forecast, by Application 2019 & 2032
- Table 41: Australia Global Orthopedic Regenerative Surgical Products Market Revenue (Million) Forecast, by Application 2019 & 2032
- Table 42: Australia Global Orthopedic Regenerative Surgical Products Market Volume (K Unit) Forecast, by Application 2019 & 2032
- Table 43: South Korea Global Orthopedic Regenerative Surgical Products Market Revenue (Million) Forecast, by Application 2019 & 2032
- Table 44: South Korea Global Orthopedic Regenerative Surgical Products Market Volume (K Unit) Forecast, by Application 2019 & 2032
- Table 45: Rest of Asia Pacific Global Orthopedic Regenerative Surgical Products Market Revenue (Million) Forecast, by Application 2019 & 2032
- Table 46: Rest of Asia Pacific Global Orthopedic Regenerative Surgical Products Market Volume (K Unit) Forecast, by Application 2019 & 2032
- Table 47: Global Orthopedic Regenerative Surgical Products Market Revenue Million Forecast, by Country 2019 & 2032
- Table 48: Global Orthopedic Regenerative Surgical Products Market Volume K Unit Forecast, by Country 2019 & 2032
- Table 49: GCC Global Orthopedic Regenerative Surgical Products Market Revenue (Million) Forecast, by Application 2019 & 2032
- Table 50: GCC Global Orthopedic Regenerative Surgical Products Market Volume (K Unit) Forecast, by Application 2019 & 2032
- Table 51: South Africa Global Orthopedic Regenerative Surgical Products Market Revenue (Million) Forecast, by Application 2019 & 2032
- Table 52: South Africa Global Orthopedic Regenerative Surgical Products Market Volume (K Unit) Forecast, by Application 2019 & 2032
- Table 53: Rest of Middle East and Africa Global Orthopedic Regenerative Surgical Products Market Revenue (Million) Forecast, by Application 2019 & 2032
- Table 54: Rest of Middle East and Africa Global Orthopedic Regenerative Surgical Products Market Volume (K Unit) Forecast, by Application 2019 & 2032
- Table 55: Global Orthopedic Regenerative Surgical Products Market Revenue Million Forecast, by Country 2019 & 2032
- Table 56: Global Orthopedic Regenerative Surgical Products Market Volume K Unit Forecast, by Country 2019 & 2032
- Table 57: Brazil Global Orthopedic Regenerative Surgical Products Market Revenue (Million) Forecast, by Application 2019 & 2032
- Table 58: Brazil Global Orthopedic Regenerative Surgical Products Market Volume (K Unit) Forecast, by Application 2019 & 2032
- Table 59: Argentina Global Orthopedic Regenerative Surgical Products Market Revenue (Million) Forecast, by Application 2019 & 2032
- Table 60: Argentina Global Orthopedic Regenerative Surgical Products Market Volume (K Unit) Forecast, by Application 2019 & 2032
- Table 61: Rest of South America Global Orthopedic Regenerative Surgical Products Market Revenue (Million) Forecast, by Application 2019 & 2032
- Table 62: Rest of South America Global Orthopedic Regenerative Surgical Products Market Volume (K Unit) Forecast, by Application 2019 & 2032
- Table 63: Global Orthopedic Regenerative Surgical Products Market Revenue Million Forecast, by Product 2019 & 2032
- Table 64: Global Orthopedic Regenerative Surgical Products Market Volume K Unit Forecast, by Product 2019 & 2032
- Table 65: Global Orthopedic Regenerative Surgical Products Market Revenue Million Forecast, by Applications 2019 & 2032
- Table 66: Global Orthopedic Regenerative Surgical Products Market Volume K Unit Forecast, by Applications 2019 & 2032
- Table 67: Global Orthopedic Regenerative Surgical Products Market Revenue Million Forecast, by End-User 2019 & 2032
- Table 68: Global Orthopedic Regenerative Surgical Products Market Volume K Unit Forecast, by End-User 2019 & 2032
- Table 69: Global Orthopedic Regenerative Surgical Products Market Revenue Million Forecast, by Country 2019 & 2032
- Table 70: Global Orthopedic Regenerative Surgical Products Market Volume K Unit Forecast, by Country 2019 & 2032
- Table 71: United States Global Orthopedic Regenerative Surgical Products Market Revenue (Million) Forecast, by Application 2019 & 2032
- Table 72: United States Global Orthopedic Regenerative Surgical Products Market Volume (K Unit) Forecast, by Application 2019 & 2032
- Table 73: Canada Global Orthopedic Regenerative Surgical Products Market Revenue (Million) Forecast, by Application 2019 & 2032
- Table 74: Canada Global Orthopedic Regenerative Surgical Products Market Volume (K Unit) Forecast, by Application 2019 & 2032
- Table 75: Mexico Global Orthopedic Regenerative Surgical Products Market Revenue (Million) Forecast, by Application 2019 & 2032
- Table 76: Mexico Global Orthopedic Regenerative Surgical Products Market Volume (K Unit) Forecast, by Application 2019 & 2032
- Table 77: Global Orthopedic Regenerative Surgical Products Market Revenue Million Forecast, by Product 2019 & 2032
- Table 78: Global Orthopedic Regenerative Surgical Products Market Volume K Unit Forecast, by Product 2019 & 2032
- Table 79: Global Orthopedic Regenerative Surgical Products Market Revenue Million Forecast, by Applications 2019 & 2032
- Table 80: Global Orthopedic Regenerative Surgical Products Market Volume K Unit Forecast, by Applications 2019 & 2032
- Table 81: Global Orthopedic Regenerative Surgical Products Market Revenue Million Forecast, by End-User 2019 & 2032
- Table 82: Global Orthopedic Regenerative Surgical Products Market Volume K Unit Forecast, by End-User 2019 & 2032
- Table 83: Global Orthopedic Regenerative Surgical Products Market Revenue Million Forecast, by Country 2019 & 2032
- Table 84: Global Orthopedic Regenerative Surgical Products Market Volume K Unit Forecast, by Country 2019 & 2032
- Table 85: Germany Global Orthopedic Regenerative Surgical Products Market Revenue (Million) Forecast, by Application 2019 & 2032
- Table 86: Germany Global Orthopedic Regenerative Surgical Products Market Volume (K Unit) Forecast, by Application 2019 & 2032
- Table 87: United Kingdom Global Orthopedic Regenerative Surgical Products Market Revenue (Million) Forecast, by Application 2019 & 2032
- Table 88: United Kingdom Global Orthopedic Regenerative Surgical Products Market Volume (K Unit) Forecast, by Application 2019 & 2032
- Table 89: France Global Orthopedic Regenerative Surgical Products Market Revenue (Million) Forecast, by Application 2019 & 2032
- Table 90: France Global Orthopedic Regenerative Surgical Products Market Volume (K Unit) Forecast, by Application 2019 & 2032
- Table 91: Italy Global Orthopedic Regenerative Surgical Products Market Revenue (Million) Forecast, by Application 2019 & 2032
- Table 92: Italy Global Orthopedic Regenerative Surgical Products Market Volume (K Unit) Forecast, by Application 2019 & 2032
- Table 93: Spain Global Orthopedic Regenerative Surgical Products Market Revenue (Million) Forecast, by Application 2019 & 2032
- Table 94: Spain Global Orthopedic Regenerative Surgical Products Market Volume (K Unit) Forecast, by Application 2019 & 2032
- Table 95: Rest of Europe Global Orthopedic Regenerative Surgical Products Market Revenue (Million) Forecast, by Application 2019 & 2032
- Table 96: Rest of Europe Global Orthopedic Regenerative Surgical Products Market Volume (K Unit) Forecast, by Application 2019 & 2032
- Table 97: Global Orthopedic Regenerative Surgical Products Market Revenue Million Forecast, by Product 2019 & 2032
- Table 98: Global Orthopedic Regenerative Surgical Products Market Volume K Unit Forecast, by Product 2019 & 2032
- Table 99: Global Orthopedic Regenerative Surgical Products Market Revenue Million Forecast, by Applications 2019 & 2032
- Table 100: Global Orthopedic Regenerative Surgical Products Market Volume K Unit Forecast, by Applications 2019 & 2032
- Table 101: Global Orthopedic Regenerative Surgical Products Market Revenue Million Forecast, by End-User 2019 & 2032
- Table 102: Global Orthopedic Regenerative Surgical Products Market Volume K Unit Forecast, by End-User 2019 & 2032
- Table 103: Global Orthopedic Regenerative Surgical Products Market Revenue Million Forecast, by Country 2019 & 2032
- Table 104: Global Orthopedic Regenerative Surgical Products Market Volume K Unit Forecast, by Country 2019 & 2032
- Table 105: China Global Orthopedic Regenerative Surgical Products Market Revenue (Million) Forecast, by Application 2019 & 2032
- Table 106: China Global Orthopedic Regenerative Surgical Products Market Volume (K Unit) Forecast, by Application 2019 & 2032
- Table 107: Japan Global Orthopedic Regenerative Surgical Products Market Revenue (Million) Forecast, by Application 2019 & 2032
- Table 108: Japan Global Orthopedic Regenerative Surgical Products Market Volume (K Unit) Forecast, by Application 2019 & 2032
- Table 109: India Global Orthopedic Regenerative Surgical Products Market Revenue (Million) Forecast, by Application 2019 & 2032
- Table 110: India Global Orthopedic Regenerative Surgical Products Market Volume (K Unit) Forecast, by Application 2019 & 2032
- Table 111: Australia Global Orthopedic Regenerative Surgical Products Market Revenue (Million) Forecast, by Application 2019 & 2032
- Table 112: Australia Global Orthopedic Regenerative Surgical Products Market Volume (K Unit) Forecast, by Application 2019 & 2032
- Table 113: South Korea Global Orthopedic Regenerative Surgical Products Market Revenue (Million) Forecast, by Application 2019 & 2032
- Table 114: South Korea Global Orthopedic Regenerative Surgical Products Market Volume (K Unit) Forecast, by Application 2019 & 2032
- Table 115: Rest of Asia Pacific Global Orthopedic Regenerative Surgical Products Market Revenue (Million) Forecast, by Application 2019 & 2032
- Table 116: Rest of Asia Pacific Global Orthopedic Regenerative Surgical Products Market Volume (K Unit) Forecast, by Application 2019 & 2032
- Table 117: Global Orthopedic Regenerative Surgical Products Market Revenue Million Forecast, by Product 2019 & 2032
- Table 118: Global Orthopedic Regenerative Surgical Products Market Volume K Unit Forecast, by Product 2019 & 2032
- Table 119: Global Orthopedic Regenerative Surgical Products Market Revenue Million Forecast, by Applications 2019 & 2032
- Table 120: Global Orthopedic Regenerative Surgical Products Market Volume K Unit Forecast, by Applications 2019 & 2032
- Table 121: Global Orthopedic Regenerative Surgical Products Market Revenue Million Forecast, by End-User 2019 & 2032
- Table 122: Global Orthopedic Regenerative Surgical Products Market Volume K Unit Forecast, by End-User 2019 & 2032
- Table 123: Global Orthopedic Regenerative Surgical Products Market Revenue Million Forecast, by Country 2019 & 2032
- Table 124: Global Orthopedic Regenerative Surgical Products Market Volume K Unit Forecast, by Country 2019 & 2032
- Table 125: GCC Global Orthopedic Regenerative Surgical Products Market Revenue (Million) Forecast, by Application 2019 & 2032
- Table 126: GCC Global Orthopedic Regenerative Surgical Products Market Volume (K Unit) Forecast, by Application 2019 & 2032
- Table 127: South Africa Global Orthopedic Regenerative Surgical Products Market Revenue (Million) Forecast, by Application 2019 & 2032
- Table 128: South Africa Global Orthopedic Regenerative Surgical Products Market Volume (K Unit) Forecast, by Application 2019 & 2032
- Table 129: Rest of Middle East and Africa Global Orthopedic Regenerative Surgical Products Market Revenue (Million) Forecast, by Application 2019 & 2032
- Table 130: Rest of Middle East and Africa Global Orthopedic Regenerative Surgical Products Market Volume (K Unit) Forecast, by Application 2019 & 2032
- Table 131: Global Orthopedic Regenerative Surgical Products Market Revenue Million Forecast, by Product 2019 & 2032
- Table 132: Global Orthopedic Regenerative Surgical Products Market Volume K Unit Forecast, by Product 2019 & 2032
- Table 133: Global Orthopedic Regenerative Surgical Products Market Revenue Million Forecast, by Applications 2019 & 2032
- Table 134: Global Orthopedic Regenerative Surgical Products Market Volume K Unit Forecast, by Applications 2019 & 2032
- Table 135: Global Orthopedic Regenerative Surgical Products Market Revenue Million Forecast, by End-User 2019 & 2032
- Table 136: Global Orthopedic Regenerative Surgical Products Market Volume K Unit Forecast, by End-User 2019 & 2032
- Table 137: Global Orthopedic Regenerative Surgical Products Market Revenue Million Forecast, by Country 2019 & 2032
- Table 138: Global Orthopedic Regenerative Surgical Products Market Volume K Unit Forecast, by Country 2019 & 2032
- Table 139: Brazil Global Orthopedic Regenerative Surgical Products Market Revenue (Million) Forecast, by Application 2019 & 2032
- Table 140: Brazil Global Orthopedic Regenerative Surgical Products Market Volume (K Unit) Forecast, by Application 2019 & 2032
- Table 141: Argentina Global Orthopedic Regenerative Surgical Products Market Revenue (Million) Forecast, by Application 2019 & 2032
- Table 142: Argentina Global Orthopedic Regenerative Surgical Products Market Volume (K Unit) Forecast, by Application 2019 & 2032
- Table 143: Rest of South America Global Orthopedic Regenerative Surgical Products Market Revenue (Million) Forecast, by Application 2019 & 2032
- Table 144: Rest of South America Global Orthopedic Regenerative Surgical Products Market Volume (K Unit) Forecast, by Application 2019 & 2032
Frequently Asked Questions
1. What is the projected Compound Annual Growth Rate (CAGR) of the Global Orthopedic Regenerative Surgical Products Market?
The projected CAGR is approximately 4.30%.
2. Which companies are prominent players in the Global Orthopedic Regenerative Surgical Products Market?
Key companies in the market include MIMEDX, Smith & Nephew, AlloSource, Arthrex Inc , Baxter, Aptissen S A, Stryker, Amniox Medical Inc, Anika Therapeutics Inc, Vericel Corporation, Zimmer Biomet.
3. What are the main segments of the Global Orthopedic Regenerative Surgical Products Market?
The market segments include Product, Applications, End-User.
4. Can you provide details about the market size?
The market size is estimated to be USD XX Million as of 2022.
5. What are some drivers contributing to market growth?
Rise in the Prevalence of Orthopedic Diseases; Increasing Geriatric Population; Technological Advancements in the Products.
6. What are the notable trends driving market growth?
Viscosupplements is Expected to Hold a Significant Share Over the Forecast Period.
7. Are there any restraints impacting market growth?
High Cost of Products; Stringent Regulatory Scenario.
8. Can you provide examples of recent developments in the market?
N/A
9. What pricing options are available for accessing the report?
Pricing options include single-user, multi-user, and enterprise licenses priced at USD 4750, USD 5250, and USD 8750 respectively.
10. Is the market size provided in terms of value or volume?
The market size is provided in terms of value, measured in Million and volume, measured in K Unit.
11. Are there any specific market keywords associated with the report?
Yes, the market keyword associated with the report is "Global Orthopedic Regenerative Surgical Products Market," which aids in identifying and referencing the specific market segment covered.
12. How do I determine which pricing option suits my needs best?
The pricing options vary based on user requirements and access needs. Individual users may opt for single-user licenses, while businesses requiring broader access may choose multi-user or enterprise licenses for cost-effective access to the report.
13. Are there any additional resources or data provided in the Global Orthopedic Regenerative Surgical Products Market report?
While the report offers comprehensive insights, it's advisable to review the specific contents or supplementary materials provided to ascertain if additional resources or data are available.
14. How can I stay updated on further developments or reports in the Global Orthopedic Regenerative Surgical Products Market?
To stay informed about further developments, trends, and reports in the Global Orthopedic Regenerative Surgical Products Market, consider subscribing to industry newsletters, following relevant companies and organizations, or regularly checking reputable industry news sources and publications.
Methodology
Step 1 - Identification of Relevant Samples Size from Population Database


Step 2 - Approaches for Defining Global Market Size (Value, Volume* & Price*)

Note*: In applicable scenarios
Step 3 - Data Sources
Primary Research
- Web Analytics
- Survey Reports
- Research Institute
- Latest Research Reports
- Opinion Leaders
Secondary Research
- Annual Reports
- White Paper
- Latest Press Release
- Industry Association
- Paid Database
- Investor Presentations

Step 4 - Data Triangulation
Involves using different sources of information in order to increase the validity of a study
These sources are likely to be stakeholders in a program - participants, other researchers, program staff, other community members, and so on.
Then we put all data in single framework & apply various statistical tools to find out the dynamic on the market.
During the analysis stage, feedback from the stakeholder groups would be compared to determine areas of agreement as well as areas of divergence
