

Key Insights
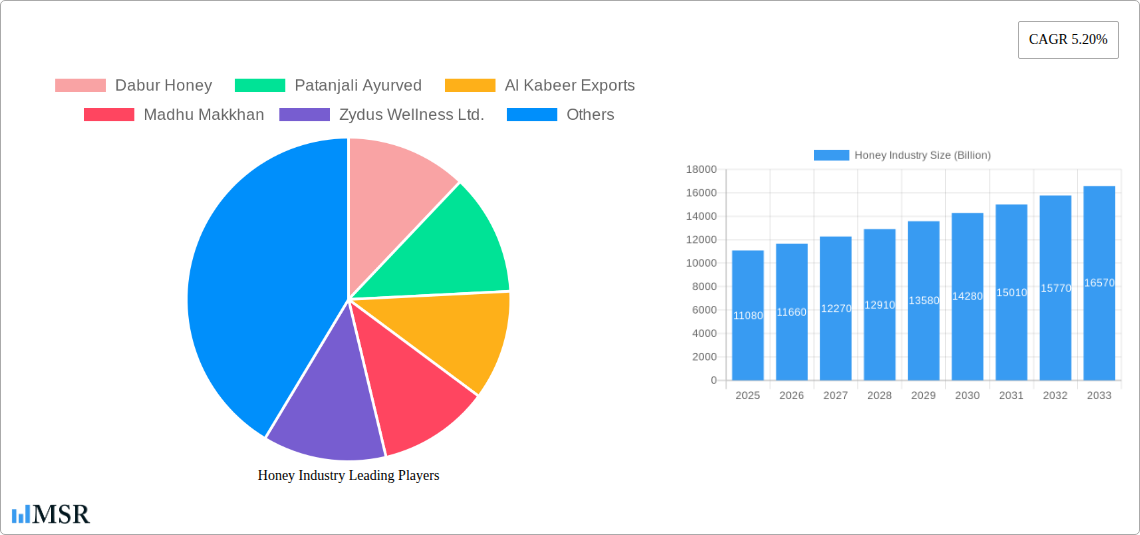
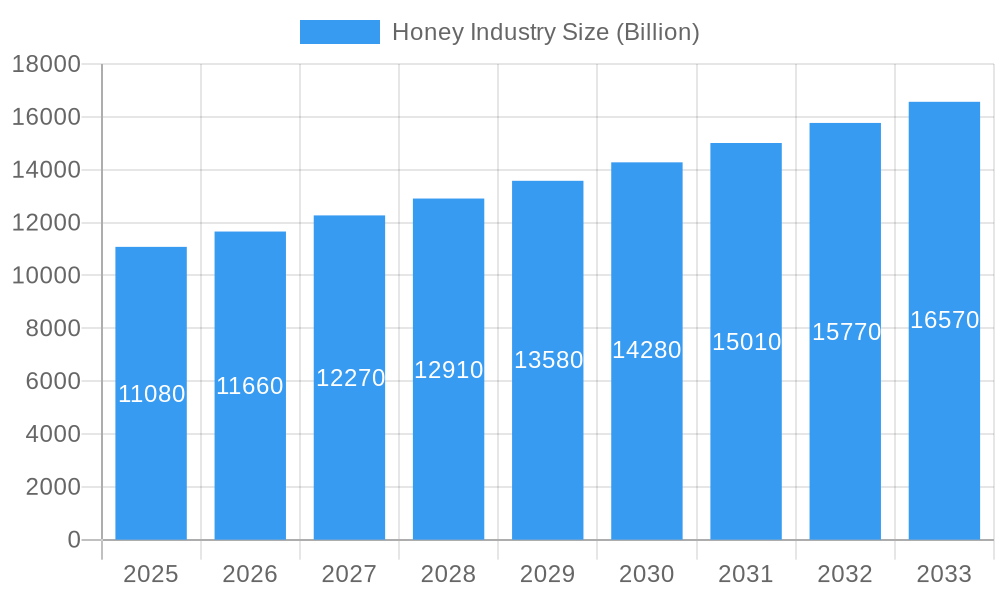
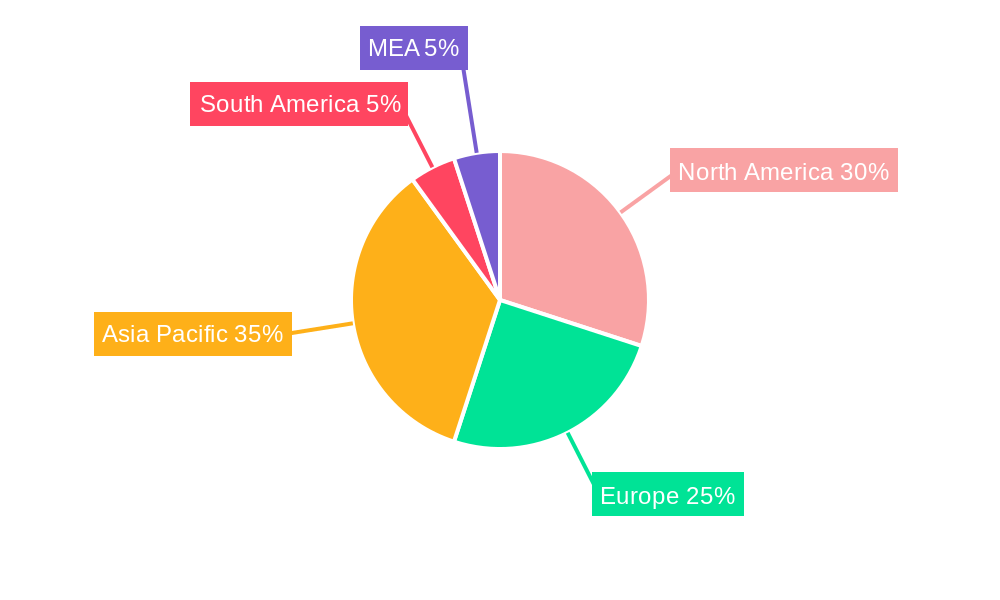
The global honey market, valued at $11.08 billion in 2025, is projected to experience robust growth, exhibiting a Compound Annual Growth Rate (CAGR) of 5.20% from 2025 to 2033. This expansion is driven by several factors. Rising consumer awareness of honey's health benefits, including its antioxidant and antimicrobial properties, fuels demand for both raw and specialized honey varieties like Manuka honey. The increasing prevalence of health-conscious lifestyles and a growing preference for natural sweeteners over refined sugars further contribute to market growth. The diversification of honey products, encompassing flavored honeys and organic options, caters to evolving consumer preferences and expands market opportunities. E-commerce platforms also play a significant role, offering convenient access to a wider range of honey products, boosting online sales. While factors like fluctuating honey production due to climatic conditions and adulteration concerns pose challenges, the overall market outlook remains positive. The key players – Dabur Honey, Patanjali Ayurved, Al Kabeer Exports, Madhu Makkhan, and Zydus Wellness Ltd. – are likely to further consolidate their market positions through strategic investments in product innovation, brand building, and expansion into new markets. The significant regional markets—North America, Europe, and Asia-Pacific—will continue to drive market growth, with Asia-Pacific demonstrating particularly strong potential given its vast population and increasing disposable incomes.
Honey Industry Market Size (In Billion)
The segmentation of the honey market reveals valuable insights. Raw honey, preferred for its purity and perceived health benefits, commands a significant portion of the market. Filtered honey, offering convenience and a smoother texture, holds a substantial share. Flavored honey caters to diverse taste preferences, stimulating market expansion, while the organic honey segment appeals to consumers prioritizing natural and sustainable food products. Manuka honey, known for its unique medicinal properties, represents a premium segment with significant growth potential. Distribution channels vary, with retail stores maintaining a prominent presence, complemented by the rapidly expanding online channels offering convenience and broader product selections. End-user demand is spread across households, food manufacturers (using honey as an ingredient in various food products), and the pharmaceutical industry (utilizing honey's therapeutic properties in certain medications). The robust growth forecast reflects the ongoing trend of consumers increasingly valuing natural and healthy food options, making the honey market a promising investment area.
Honey Industry Company Market Share
Honey Industry Market Report: 2019-2033
This comprehensive report provides a detailed analysis of the global honey industry, projecting a market size exceeding $XX Billion by 2033. It offers invaluable insights for industry stakeholders, investors, and businesses seeking to capitalize on the burgeoning demand for honey products. The report covers market dynamics, key players, emerging trends, and future growth opportunities, providing actionable strategies for success in this competitive landscape. The study period is 2019-2033, with 2025 as the base and estimated year. The forecast period extends from 2025 to 2033, while the historical period encompasses 2019-2024.
Honey Industry Market Concentration & Dynamics
The global honey market exhibits a moderately concentrated structure, with several large players commanding significant market share. Dabur Honey, Patanjali Ayurved, Al Kabeer Exports, Madhu Makkhan, and Zydus Wellness Ltd. are among the key players, collectively holding an estimated xx% of the market share in 2025. However, a large number of smaller regional and local producers also contribute significantly to the overall market volume.
The industry’s innovation ecosystem is characterized by continuous efforts to improve honey processing, packaging, and product diversification. This includes the development of new flavored honeys, organic honey varieties, and specialized honey blends targeting specific health benefits. Regulatory frameworks vary across different regions, influencing production standards, labeling requirements, and trade regulations. Substitute products, such as artificial sweeteners and other natural sweeteners, pose a competitive threat, although honey's unique flavor profile and perceived health benefits provide a degree of differentiation. End-user trends point towards a growing preference for organic and specialty honey varieties, fueled by increasing health consciousness. M&A activity within the honey industry is moderate, with a few significant acquisitions reported in the past five years, indicating a potential for further consolidation in the future. The average number of M&A deals in the honey industry per year during the historical period (2019-2024) was approximately xx.
Honey Industry Industry Insights & Trends
The global honey market is experiencing robust growth, driven by several key factors. The increasing global population and rising disposable incomes, particularly in developing economies, are boosting the demand for honey. Growing awareness of honey's health benefits, including its antioxidant and antimicrobial properties, is another major growth driver. The market size in 2025 is estimated at $XX Billion, with a CAGR (Compound Annual Growth Rate) of xx% projected for the forecast period (2025-2033). Technological advancements in beekeeping practices, such as improved hive management and disease control techniques, are enhancing honey production efficiency. Evolving consumer behaviors, such as a growing preference for natural and organic food products, are further fueling the demand for honey. The shift towards online retail channels is also expanding market accessibility and creating new opportunities for growth.
Key Markets & Segments Leading Honey Industry
The Asia-Pacific region is currently the leading market for honey, driven by high consumption rates in countries like India and China. Within the honey types, raw honey and organic honey segments are experiencing the fastest growth, reflecting increasing consumer demand for natural and unprocessed products. The retail distribution channel dominates the market, though online sales are rapidly expanding.
- Drivers of Market Dominance:
- Asia-Pacific: High population density, rising disposable incomes, and cultural preferences for honey-based foods and traditional medicine.
- Raw Honey/Organic Honey: Growing health consciousness, preference for natural products, and perception of superior quality and health benefits.
- Retail Channel: Established distribution network, wider accessibility, and convenience for consumers.
Honey Industry Product Developments
Recent product innovations in the honey industry include the development of specialized honey blends targeting specific health conditions, such as Manuka honey known for its potent antibacterial properties. Companies are also exploring innovative packaging solutions to enhance product shelf life and appeal. Technological advancements in honey processing techniques, such as improved filtration and extraction methods, are ensuring consistent product quality and reducing waste. These developments are enhancing the competitive edge of honey producers and broadening the market applications of honey, extending beyond traditional culinary uses.
Challenges in the Honey Industry Market
The honey industry faces several challenges, including fluctuating honey production due to unpredictable weather conditions and bee colony health issues. Regulatory hurdles, particularly concerning honey authenticity and labeling requirements, add complexity and costs to the industry. Supply chain disruptions and the rising cost of raw materials, including packaging and transportation, also pose significant challenges. Intense competition from substitute sweeteners and price volatility in the market create further pressures for honey producers. These factors collectively restrict industry growth and profitability.
Forces Driving Honey Industry Growth
Technological advancements in beekeeping and honey processing, coupled with increasing consumer awareness of honey's health benefits, are driving significant market expansion. Government initiatives to support beekeepers and promote honey production, such as the USD 60.5 million allocated to the NBHM in India, further fuel the industry's growth. Rising disposable incomes in emerging markets are also creating higher honey consumption rates. The increasing integration of online retail channels is widening market accessibility, opening additional opportunities for honey producers.
Long-Term Growth Catalysts in the Honey Industry
Long-term growth in the honey industry will be fueled by continuous product innovation, such as the development of new honey-based food products and health supplements. Strategic partnerships between honey producers and food manufacturers will unlock new market avenues. Expanding into new geographical markets with high growth potential and increased investment in sustainable beekeeping practices will further contribute to the industry's expansion in the long run.
Emerging Opportunities in Honey Industry
Emerging opportunities include the increasing demand for functional foods and beverages incorporating honey as a natural sweetener. The rising popularity of honey-based skincare and beauty products represents a new area of expansion. There is also potential for growth in specialty honey varieties, such as Manuka honey, targeting niche consumer segments. Expanding into emerging markets and incorporating sustainable beekeeping practices are promising avenues for growth.
Leading Players in the Honey Industry Sector
- Dabur Honey
- Patanjali Ayurved
- Al Kabeer Exports
- Madhu Makkhan
- Zydus Wellness Ltd.
Key Milestones in Honey Industry Industry
- August 2022: India's APEDA launched a project to boost honey production under the AtmaNirbhar Bharat initiative, allocating INR 500 crore (USD 60.5 million) for the NBHM. This signifies a significant government commitment to support the honey industry.
- May 2024: The Canadian government increased funding for the Honey Bee Health Initiative by up to USD 1 million. This investment emphasizes the importance of bee health and honey production sustainability.
Strategic Outlook for Honey Industry Market
The honey industry is poised for continued growth, driven by increasing consumer preference for natural sweeteners and health-promoting foods. Strategic opportunities lie in developing innovative honey-based products, expanding into new markets, and building strong brand identities. Investment in sustainable beekeeping practices and supply chain optimization will ensure long-term industry viability and resilience. The market holds significant potential for expansion, offering numerous avenues for companies to grow their market share and profitability.
Honey Industry Segmentation
- 1. Production Analysis
- 2. Consumption Analysis
- 3. Import Market Analysis (Value & Volume)
- 4. Export Market Analysis (Value & Volume)
- 5. Price Trend Analysis
Honey Industry Segmentation By Geography
-
1. North America
- 1.1. United States
- 1.2. Canada
- 1.3. Mexico
-
2. Europe
- 2.1. Spain
- 2.2. Ukraine
- 2.3. Poland
- 2.4. Germany
-
3. Asia Pacific
- 3.1. China
- 3.2. India
- 3.3. Japan
- 3.4. New Zealand
-
4. South America
- 4.1. Argentina
- 4.2. Brazil
-
5. Middle East and Africa
- 5.1. Turkey
- 5.2. Iran
Honey Industry Regional Market Share
Geographic Coverage of Honey Industry
Honey Industry REPORT HIGHLIGHTS
| Aspects | Details |
|---|---|
| Study Period | 2020-2034 |
| Base Year | 2025 |
| Estimated Year | 2026 |
| Forecast Period | 2026-2034 |
| Historical Period | 2020-2025 |
| Growth Rate | CAGR of 5.20% from 2020-2034 |
| Segmentation |
|
Table of Contents
- 1. Introduction
- 1.1. Research Scope
- 1.2. Market Segmentation
- 1.3. Research Objective
- 1.4. Definitions and Assumptions
- 2. Executive Summary
- 2.1. Market Snapshot
- 3. Market Dynamics
- 3.1. Market Drivers
- 3.2. Market Restrains
- 3.3. Market Trends
- 3.4. Market Opportunities
- 4. Market Factor Analysis
- 4.1. Porters Five Forces
- 4.1.1. Bargaining Power of Suppliers
- 4.1.2. Bargaining Power of Buyers
- 4.1.3. Threat of New Entrants
- 4.1.4. Threat of Substitutes
- 4.1.5. Competitive Rivalry
- 4.2. PESTEL analysis
- 4.3. BCG Analysis
- 4.3.1. Stars (High Growth, High Market Share)
- 4.3.2. Cash Cows (Low Growth, High Market Share)
- 4.3.3. Question Mark (High Growth, Low Market Share)
- 4.3.4. Dogs (Low Growth, Low Market Share)
- 4.4. Ansoff Matrix Analysis
- 4.5. Supply Chain Analysis
- 4.6. Regulatory Landscape
- 4.7. Current Market Potential and Opportunity Assessment (TAM–SAM–SOM Framework)
- 4.8. MSR Analyst Note
- 4.1. Porters Five Forces
- 5. Market Analysis, Insights and Forecast 2021-2033
- 5.1. Market Analysis, Insights and Forecast - by Production Analysis
- 5.2. Market Analysis, Insights and Forecast - by Consumption Analysis
- 5.3. Market Analysis, Insights and Forecast - by Import Market Analysis (Value & Volume)
- 5.4. Market Analysis, Insights and Forecast - by Export Market Analysis (Value & Volume)
- 5.5. Market Analysis, Insights and Forecast - by Price Trend Analysis
- 5.6. Market Analysis, Insights and Forecast - by Region
- 5.6.1. North America
- 5.6.2. Europe
- 5.6.3. Asia Pacific
- 5.6.4. South America
- 5.6.5. Middle East and Africa
- 6. Global Honey Industry Analysis, Insights and Forecast, 2021-2033
- 6.1. Market Analysis, Insights and Forecast - by Production Analysis
- 6.2. Market Analysis, Insights and Forecast - by Consumption Analysis
- 6.3. Market Analysis, Insights and Forecast - by Import Market Analysis (Value & Volume)
- 6.4. Market Analysis, Insights and Forecast - by Export Market Analysis (Value & Volume)
- 6.5. Market Analysis, Insights and Forecast - by Price Trend Analysis
- 7. North America Honey Industry Analysis, Insights and Forecast, 2020-2032
- 7.1. Market Analysis, Insights and Forecast - by Production Analysis
- 7.2. Market Analysis, Insights and Forecast - by Consumption Analysis
- 7.3. Market Analysis, Insights and Forecast - by Import Market Analysis (Value & Volume)
- 7.4. Market Analysis, Insights and Forecast - by Export Market Analysis (Value & Volume)
- 7.5. Market Analysis, Insights and Forecast - by Price Trend Analysis
- 8. Europe Honey Industry Analysis, Insights and Forecast, 2020-2032
- 8.1. Market Analysis, Insights and Forecast - by Production Analysis
- 8.2. Market Analysis, Insights and Forecast - by Consumption Analysis
- 8.3. Market Analysis, Insights and Forecast - by Import Market Analysis (Value & Volume)
- 8.4. Market Analysis, Insights and Forecast - by Export Market Analysis (Value & Volume)
- 8.5. Market Analysis, Insights and Forecast - by Price Trend Analysis
- 9. Asia Pacific Honey Industry Analysis, Insights and Forecast, 2020-2032
- 9.1. Market Analysis, Insights and Forecast - by Production Analysis
- 9.2. Market Analysis, Insights and Forecast - by Consumption Analysis
- 9.3. Market Analysis, Insights and Forecast - by Import Market Analysis (Value & Volume)
- 9.4. Market Analysis, Insights and Forecast - by Export Market Analysis (Value & Volume)
- 9.5. Market Analysis, Insights and Forecast - by Price Trend Analysis
- 10. South America Honey Industry Analysis, Insights and Forecast, 2020-2032
- 10.1. Market Analysis, Insights and Forecast - by Production Analysis
- 10.2. Market Analysis, Insights and Forecast - by Consumption Analysis
- 10.3. Market Analysis, Insights and Forecast - by Import Market Analysis (Value & Volume)
- 10.4. Market Analysis, Insights and Forecast - by Export Market Analysis (Value & Volume)
- 10.5. Market Analysis, Insights and Forecast - by Price Trend Analysis
- 11. Middle East and Africa Honey Industry Analysis, Insights and Forecast, 2020-2032
- 11.1. Market Analysis, Insights and Forecast - by Production Analysis
- 11.2. Market Analysis, Insights and Forecast - by Consumption Analysis
- 11.3. Market Analysis, Insights and Forecast - by Import Market Analysis (Value & Volume)
- 11.4. Market Analysis, Insights and Forecast - by Export Market Analysis (Value & Volume)
- 11.5. Market Analysis, Insights and Forecast - by Price Trend Analysis
- 12. Competitive Analysis
- 12.1. Company Profiles
- 12.1.1 Dabur Honey
- 12.1.1.1. Company Overview
- 12.1.1.2. Products
- 12.1.1.3. Company Financials
- 12.1.1.4. SWOT Analysis
- 12.1.2 Patanjali Ayurved
- 12.1.2.1. Company Overview
- 12.1.2.2. Products
- 12.1.2.3. Company Financials
- 12.1.2.4. SWOT Analysis
- 12.1.3 Al Kabeer Exports
- 12.1.3.1. Company Overview
- 12.1.3.2. Products
- 12.1.3.3. Company Financials
- 12.1.3.4. SWOT Analysis
- 12.1.4 Madhu Makkhan
- 12.1.4.1. Company Overview
- 12.1.4.2. Products
- 12.1.4.3. Company Financials
- 12.1.4.4. SWOT Analysis
- 12.1.5 Zydus Wellness Ltd.
- 12.1.5.1. Company Overview
- 12.1.5.2. Products
- 12.1.5.3. Company Financials
- 12.1.5.4. SWOT Analysis
- 12.1.1 Dabur Honey
- 12.2. Market Entropy
- 12.2.1 Company's Key Areas Served
- 12.2.2 Recent Developments
- 12.3. Company Market Share Analysis 2025
- 12.3.1 Top 5 Companies Market Share Analysis
- 12.3.2 Top 3 Companies Market Share Analysis
- 12.4. List of Potential Customers
- 13. Research Methodology
List of Figures
- Figure 1: Global Honey Industry Revenue Breakdown (Billion, %) by Region 2025 & 2033
- Figure 2: North America Honey Industry Revenue (Billion), by Production Analysis 2025 & 2033
- Figure 3: North America Honey Industry Revenue Share (%), by Production Analysis 2025 & 2033
- Figure 4: North America Honey Industry Revenue (Billion), by Consumption Analysis 2025 & 2033
- Figure 5: North America Honey Industry Revenue Share (%), by Consumption Analysis 2025 & 2033
- Figure 6: North America Honey Industry Revenue (Billion), by Import Market Analysis (Value & Volume) 2025 & 2033
- Figure 7: North America Honey Industry Revenue Share (%), by Import Market Analysis (Value & Volume) 2025 & 2033
- Figure 8: North America Honey Industry Revenue (Billion), by Export Market Analysis (Value & Volume) 2025 & 2033
- Figure 9: North America Honey Industry Revenue Share (%), by Export Market Analysis (Value & Volume) 2025 & 2033
- Figure 10: North America Honey Industry Revenue (Billion), by Price Trend Analysis 2025 & 2033
- Figure 11: North America Honey Industry Revenue Share (%), by Price Trend Analysis 2025 & 2033
- Figure 12: North America Honey Industry Revenue (Billion), by Country 2025 & 2033
- Figure 13: North America Honey Industry Revenue Share (%), by Country 2025 & 2033
- Figure 14: Europe Honey Industry Revenue (Billion), by Production Analysis 2025 & 2033
- Figure 15: Europe Honey Industry Revenue Share (%), by Production Analysis 2025 & 2033
- Figure 16: Europe Honey Industry Revenue (Billion), by Consumption Analysis 2025 & 2033
- Figure 17: Europe Honey Industry Revenue Share (%), by Consumption Analysis 2025 & 2033
- Figure 18: Europe Honey Industry Revenue (Billion), by Import Market Analysis (Value & Volume) 2025 & 2033
- Figure 19: Europe Honey Industry Revenue Share (%), by Import Market Analysis (Value & Volume) 2025 & 2033
- Figure 20: Europe Honey Industry Revenue (Billion), by Export Market Analysis (Value & Volume) 2025 & 2033
- Figure 21: Europe Honey Industry Revenue Share (%), by Export Market Analysis (Value & Volume) 2025 & 2033
- Figure 22: Europe Honey Industry Revenue (Billion), by Price Trend Analysis 2025 & 2033
- Figure 23: Europe Honey Industry Revenue Share (%), by Price Trend Analysis 2025 & 2033
- Figure 24: Europe Honey Industry Revenue (Billion), by Country 2025 & 2033
- Figure 25: Europe Honey Industry Revenue Share (%), by Country 2025 & 2033
- Figure 26: Asia Pacific Honey Industry Revenue (Billion), by Production Analysis 2025 & 2033
- Figure 27: Asia Pacific Honey Industry Revenue Share (%), by Production Analysis 2025 & 2033
- Figure 28: Asia Pacific Honey Industry Revenue (Billion), by Consumption Analysis 2025 & 2033
- Figure 29: Asia Pacific Honey Industry Revenue Share (%), by Consumption Analysis 2025 & 2033
- Figure 30: Asia Pacific Honey Industry Revenue (Billion), by Import Market Analysis (Value & Volume) 2025 & 2033
- Figure 31: Asia Pacific Honey Industry Revenue Share (%), by Import Market Analysis (Value & Volume) 2025 & 2033
- Figure 32: Asia Pacific Honey Industry Revenue (Billion), by Export Market Analysis (Value & Volume) 2025 & 2033
- Figure 33: Asia Pacific Honey Industry Revenue Share (%), by Export Market Analysis (Value & Volume) 2025 & 2033
- Figure 34: Asia Pacific Honey Industry Revenue (Billion), by Price Trend Analysis 2025 & 2033
- Figure 35: Asia Pacific Honey Industry Revenue Share (%), by Price Trend Analysis 2025 & 2033
- Figure 36: Asia Pacific Honey Industry Revenue (Billion), by Country 2025 & 2033
- Figure 37: Asia Pacific Honey Industry Revenue Share (%), by Country 2025 & 2033
- Figure 38: South America Honey Industry Revenue (Billion), by Production Analysis 2025 & 2033
- Figure 39: South America Honey Industry Revenue Share (%), by Production Analysis 2025 & 2033
- Figure 40: South America Honey Industry Revenue (Billion), by Consumption Analysis 2025 & 2033
- Figure 41: South America Honey Industry Revenue Share (%), by Consumption Analysis 2025 & 2033
- Figure 42: South America Honey Industry Revenue (Billion), by Import Market Analysis (Value & Volume) 2025 & 2033
- Figure 43: South America Honey Industry Revenue Share (%), by Import Market Analysis (Value & Volume) 2025 & 2033
- Figure 44: South America Honey Industry Revenue (Billion), by Export Market Analysis (Value & Volume) 2025 & 2033
- Figure 45: South America Honey Industry Revenue Share (%), by Export Market Analysis (Value & Volume) 2025 & 2033
- Figure 46: South America Honey Industry Revenue (Billion), by Price Trend Analysis 2025 & 2033
- Figure 47: South America Honey Industry Revenue Share (%), by Price Trend Analysis 2025 & 2033
- Figure 48: South America Honey Industry Revenue (Billion), by Country 2025 & 2033
- Figure 49: South America Honey Industry Revenue Share (%), by Country 2025 & 2033
- Figure 50: Middle East and Africa Honey Industry Revenue (Billion), by Production Analysis 2025 & 2033
- Figure 51: Middle East and Africa Honey Industry Revenue Share (%), by Production Analysis 2025 & 2033
- Figure 52: Middle East and Africa Honey Industry Revenue (Billion), by Consumption Analysis 2025 & 2033
- Figure 53: Middle East and Africa Honey Industry Revenue Share (%), by Consumption Analysis 2025 & 2033
- Figure 54: Middle East and Africa Honey Industry Revenue (Billion), by Import Market Analysis (Value & Volume) 2025 & 2033
- Figure 55: Middle East and Africa Honey Industry Revenue Share (%), by Import Market Analysis (Value & Volume) 2025 & 2033
- Figure 56: Middle East and Africa Honey Industry Revenue (Billion), by Export Market Analysis (Value & Volume) 2025 & 2033
- Figure 57: Middle East and Africa Honey Industry Revenue Share (%), by Export Market Analysis (Value & Volume) 2025 & 2033
- Figure 58: Middle East and Africa Honey Industry Revenue (Billion), by Price Trend Analysis 2025 & 2033
- Figure 59: Middle East and Africa Honey Industry Revenue Share (%), by Price Trend Analysis 2025 & 2033
- Figure 60: Middle East and Africa Honey Industry Revenue (Billion), by Country 2025 & 2033
- Figure 61: Middle East and Africa Honey Industry Revenue Share (%), by Country 2025 & 2033
List of Tables
- Table 1: Global Honey Industry Revenue Billion Forecast, by Production Analysis 2020 & 2033
- Table 2: Global Honey Industry Revenue Billion Forecast, by Consumption Analysis 2020 & 2033
- Table 3: Global Honey Industry Revenue Billion Forecast, by Import Market Analysis (Value & Volume) 2020 & 2033
- Table 4: Global Honey Industry Revenue Billion Forecast, by Export Market Analysis (Value & Volume) 2020 & 2033
- Table 5: Global Honey Industry Revenue Billion Forecast, by Price Trend Analysis 2020 & 2033
- Table 6: Global Honey Industry Revenue Billion Forecast, by Region 2020 & 2033
- Table 7: Global Honey Industry Revenue Billion Forecast, by Production Analysis 2020 & 2033
- Table 8: Global Honey Industry Revenue Billion Forecast, by Consumption Analysis 2020 & 2033
- Table 9: Global Honey Industry Revenue Billion Forecast, by Import Market Analysis (Value & Volume) 2020 & 2033
- Table 10: Global Honey Industry Revenue Billion Forecast, by Export Market Analysis (Value & Volume) 2020 & 2033
- Table 11: Global Honey Industry Revenue Billion Forecast, by Price Trend Analysis 2020 & 2033
- Table 12: Global Honey Industry Revenue Billion Forecast, by Country 2020 & 2033
- Table 13: United States Honey Industry Revenue (Billion) Forecast, by Application 2020 & 2033
- Table 14: Canada Honey Industry Revenue (Billion) Forecast, by Application 2020 & 2033
- Table 15: Mexico Honey Industry Revenue (Billion) Forecast, by Application 2020 & 2033
- Table 16: Global Honey Industry Revenue Billion Forecast, by Production Analysis 2020 & 2033
- Table 17: Global Honey Industry Revenue Billion Forecast, by Consumption Analysis 2020 & 2033
- Table 18: Global Honey Industry Revenue Billion Forecast, by Import Market Analysis (Value & Volume) 2020 & 2033
- Table 19: Global Honey Industry Revenue Billion Forecast, by Export Market Analysis (Value & Volume) 2020 & 2033
- Table 20: Global Honey Industry Revenue Billion Forecast, by Price Trend Analysis 2020 & 2033
- Table 21: Global Honey Industry Revenue Billion Forecast, by Country 2020 & 2033
- Table 22: Spain Honey Industry Revenue (Billion) Forecast, by Application 2020 & 2033
- Table 23: Ukraine Honey Industry Revenue (Billion) Forecast, by Application 2020 & 2033
- Table 24: Poland Honey Industry Revenue (Billion) Forecast, by Application 2020 & 2033
- Table 25: Germany Honey Industry Revenue (Billion) Forecast, by Application 2020 & 2033
- Table 26: Global Honey Industry Revenue Billion Forecast, by Production Analysis 2020 & 2033
- Table 27: Global Honey Industry Revenue Billion Forecast, by Consumption Analysis 2020 & 2033
- Table 28: Global Honey Industry Revenue Billion Forecast, by Import Market Analysis (Value & Volume) 2020 & 2033
- Table 29: Global Honey Industry Revenue Billion Forecast, by Export Market Analysis (Value & Volume) 2020 & 2033
- Table 30: Global Honey Industry Revenue Billion Forecast, by Price Trend Analysis 2020 & 2033
- Table 31: Global Honey Industry Revenue Billion Forecast, by Country 2020 & 2033
- Table 32: China Honey Industry Revenue (Billion) Forecast, by Application 2020 & 2033
- Table 33: India Honey Industry Revenue (Billion) Forecast, by Application 2020 & 2033
- Table 34: Japan Honey Industry Revenue (Billion) Forecast, by Application 2020 & 2033
- Table 35: New Zealand Honey Industry Revenue (Billion) Forecast, by Application 2020 & 2033
- Table 36: Global Honey Industry Revenue Billion Forecast, by Production Analysis 2020 & 2033
- Table 37: Global Honey Industry Revenue Billion Forecast, by Consumption Analysis 2020 & 2033
- Table 38: Global Honey Industry Revenue Billion Forecast, by Import Market Analysis (Value & Volume) 2020 & 2033
- Table 39: Global Honey Industry Revenue Billion Forecast, by Export Market Analysis (Value & Volume) 2020 & 2033
- Table 40: Global Honey Industry Revenue Billion Forecast, by Price Trend Analysis 2020 & 2033
- Table 41: Global Honey Industry Revenue Billion Forecast, by Country 2020 & 2033
- Table 42: Argentina Honey Industry Revenue (Billion) Forecast, by Application 2020 & 2033
- Table 43: Brazil Honey Industry Revenue (Billion) Forecast, by Application 2020 & 2033
- Table 44: Global Honey Industry Revenue Billion Forecast, by Production Analysis 2020 & 2033
- Table 45: Global Honey Industry Revenue Billion Forecast, by Consumption Analysis 2020 & 2033
- Table 46: Global Honey Industry Revenue Billion Forecast, by Import Market Analysis (Value & Volume) 2020 & 2033
- Table 47: Global Honey Industry Revenue Billion Forecast, by Export Market Analysis (Value & Volume) 2020 & 2033
- Table 48: Global Honey Industry Revenue Billion Forecast, by Price Trend Analysis 2020 & 2033
- Table 49: Global Honey Industry Revenue Billion Forecast, by Country 2020 & 2033
- Table 50: Turkey Honey Industry Revenue (Billion) Forecast, by Application 2020 & 2033
- Table 51: Iran Honey Industry Revenue (Billion) Forecast, by Application 2020 & 2033
Frequently Asked Questions
1. What is the projected Compound Annual Growth Rate (CAGR) of the Honey Industry?
The projected CAGR is approximately 5.20%.
2. Which companies are prominent players in the Honey Industry?
Key companies in the market include Dabur Honey , Patanjali Ayurved , Al Kabeer Exports , Madhu Makkhan, Zydus Wellness Ltd. .
3. What are the main segments of the Honey Industry?
The market segments include Production Analysis, Consumption Analysis, Import Market Analysis (Value & Volume), Export Market Analysis (Value & Volume), Price Trend Analysis.
4. Can you provide details about the market size?
The market size is estimated to be USD 11.08 Billion as of 2022.
5. What are some drivers contributing to market growth?
Increasing Demand for Garlic Due to Various Uses in Industries; Rising Demad of Organic Garlic; Increasing Government Initiatives.
6. What are the notable trends driving market growth?
Increasing Demand for Natural Sweeteners with Health Benefits of Natural Honey.
7. Are there any restraints impacting market growth?
Lack of Technical Knowledge of Farmers; Price Fluctuations.
8. Can you provide examples of recent developments in the market?
May 2024: The government of Canada is increasing funding to the Honey Bee Health Initiative by up to USD 1 million to help improve the resiliency and competitiveness of beekeeper operations in Ontario. The additional funding will help more Ontario beekeepers better protect their colonies over the winter and protect against invasive pests such as varroa mites which pose a serious threat to honeybee health.
9. What pricing options are available for accessing the report?
Pricing options include single-user, multi-user, and enterprise licenses priced at USD 4750, USD 5250, and USD 8750 respectively.
10. Is the market size provided in terms of value or volume?
The market size is provided in terms of value, measured in Billion.
11. Are there any specific market keywords associated with the report?
Yes, the market keyword associated with the report is "Honey Industry," which aids in identifying and referencing the specific market segment covered.
12. How do I determine which pricing option suits my needs best?
The pricing options vary based on user requirements and access needs. Individual users may opt for single-user licenses, while businesses requiring broader access may choose multi-user or enterprise licenses for cost-effective access to the report.
13. Are there any additional resources or data provided in the Honey Industry report?
While the report offers comprehensive insights, it's advisable to review the specific contents or supplementary materials provided to ascertain if additional resources or data are available.
14. How can I stay updated on further developments or reports in the Honey Industry?
To stay informed about further developments, trends, and reports in the Honey Industry, consider subscribing to industry newsletters, following relevant companies and organizations, or regularly checking reputable industry news sources and publications.
Methodology
Step 1 - Identification of Relevant Samples Size from Population Database


Step 2 - Approaches for Defining Global Market Size (Value, Volume* & Price*)

Note*: In applicable scenarios
Step 3 - Data Sources
Primary Research
- Web Analytics
- Survey Reports
- Research Institute
- Latest Research Reports
- Opinion Leaders
Secondary Research
- Annual Reports
- White Paper
- Latest Press Release
- Industry Association
- Paid Database
- Investor Presentations

Step 4 - Data Triangulation
Involves using different sources of information in order to increase the validity of a study
These sources are likely to be stakeholders in a program - participants, other researchers, program staff, other community members, and so on.
Then we put all data in single framework & apply various statistical tools to find out the dynamic on the market.
During the analysis stage, feedback from the stakeholder groups would be compared to determine areas of agreement as well as areas of divergence