

Key Insights
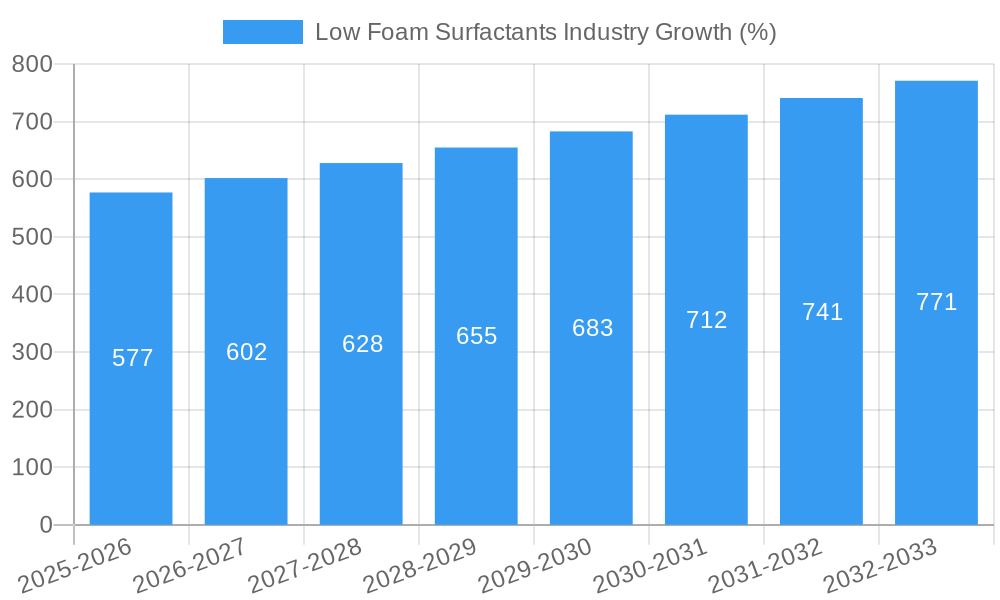
The global low foam surfactants market, valued at $14.35 billion in 2025, is projected to experience robust growth, driven by a compound annual growth rate (CAGR) exceeding 4.00% from 2025 to 2033. This expansion is fueled by several key factors. Firstly, the increasing demand for efficient and environmentally friendly cleaning solutions across diverse industries, including agrochemicals, detergents, and metalworking, is a significant catalyst. The shift towards sustainable practices and stricter environmental regulations are further propelling the adoption of low foam surfactants, which minimize water and energy consumption during cleaning processes. The diverse applications of low foam surfactants, encompassing everything from food processing to oilfield operations, ensure a broad and resilient market base. Specific growth segments include agrochemicals, driven by the need for effective and residue-free crop protection, and the detergents and cleaning agents sector, where consumers increasingly favor eco-conscious products. Geographical growth is expected to be particularly strong in the Asia-Pacific region, driven by rapid industrialization and rising consumer spending in countries like China and India.
However, the market also faces some challenges. Price fluctuations in raw materials, particularly those derived from petroleum, can impact profitability. Furthermore, the development and adoption of alternative cleaning technologies could present competitive pressures. Nevertheless, the overall market outlook remains positive, driven by sustained demand from key end-use industries and the increasing focus on sustainability. Continuous innovation in surfactant chemistry, aiming at improved performance and reduced environmental impact, is expected to further fuel market expansion in the coming years. Key players, including AkzoNobel, Solvay, BASF, and others, are actively investing in research and development, aiming to enhance product offerings and cater to the evolving needs of various market segments.

Low Foam Surfactants Market Report: 2019-2033 Forecast
This comprehensive report provides an in-depth analysis of the global low foam surfactants market, offering invaluable insights for industry stakeholders, investors, and businesses seeking to navigate this dynamic sector. With a study period spanning 2019-2033, a base year of 2025, and a forecast period of 2025-2033, this report delivers actionable intelligence based on rigorous market research. The global market is expected to reach xx Million by 2033, exhibiting a CAGR of xx% during the forecast period.
Low Foam Surfactants Industry Market Concentration & Dynamics
The low foam surfactants market is moderately concentrated, with key players like AkzoNobel N V, Nufarm, Solvay, Croda International plc, Evonik Industries AG, BASF SE, Huntsman International LLC, Dow, KAO CORPORATION, Oxiteno SA, Stepan Company, Clariant AG, and others holding significant market share. Market share dynamics are influenced by factors such as innovation, M&A activity, and regulatory changes. The industry witnesses frequent mergers and acquisitions, with an estimated xx M&A deals recorded between 2019 and 2024.
- Market Concentration: Moderately concentrated, with top 10 players holding approximately xx% of the market share in 2024.
- Innovation Ecosystem: High R&D spending drives innovation in bio-based and high-performance surfactants.
- Regulatory Landscape: Stringent environmental regulations are shaping product development towards sustainable solutions.
- Substitute Products: Limited direct substitutes exist, but alternative cleaning technologies pose some competitive pressure.
- End-User Trends: Growing demand from detergent and cleaning agents, agrochemicals and personal care sectors drives market growth.
Low Foam Surfactants Industry Insights & Trends
The global low foam surfactants market is experiencing significant growth fueled by rising demand across diverse end-user industries. The market size reached xx Million in 2024 and is projected to reach xx Million by 2033. Key growth drivers include the increasing demand for eco-friendly cleaning solutions, advancements in surfactant technology leading to higher efficiency, and stringent regulatory compliance requirements. Technological disruptions, such as the development of bio-based surfactants and improved production processes, are further boosting market expansion. Consumer preferences are shifting towards sustainable and high-performing products, impacting the market trajectory. The market exhibits a strong positive correlation with economic growth in key regions, especially in developing economies.
Key Markets & Segments Leading Low Foam Surfactants Industry
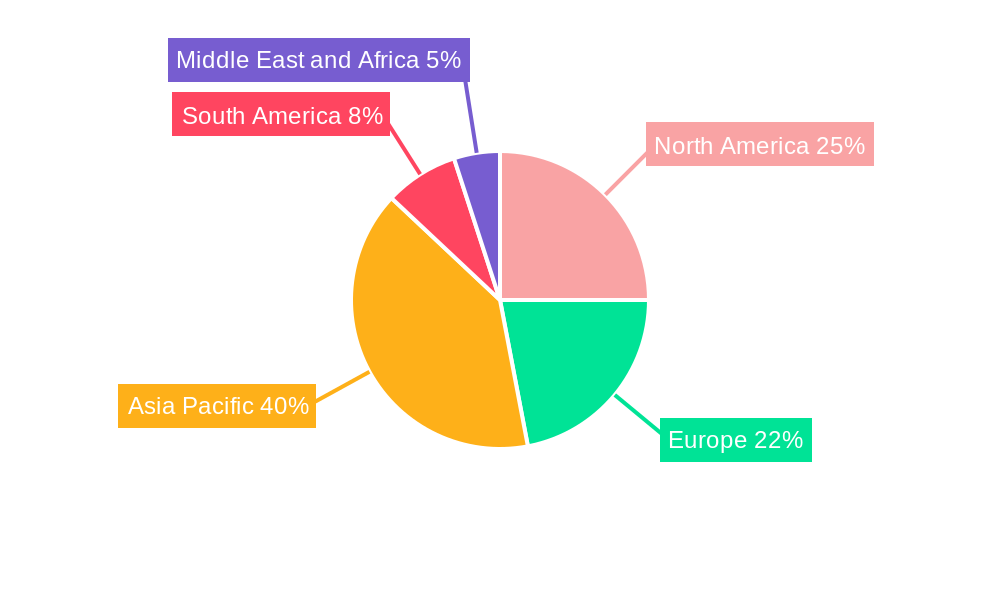
The Detergents and Cleaning Agents segment holds the largest market share, followed by Agrochemicals and Food and Dairy Process Cleaners. Geographically, the market is dominated by regions like North America and Europe, driven by factors such as high industrialization, robust infrastructure, and strong regulatory frameworks. Asia-Pacific is expected to exhibit significant growth in the coming years.
- Dominant Regions: North America and Europe
- Leading Segments: Detergents and Cleaning Agents, Agrochemicals
- Growth Drivers:
- North America: High disposable incomes, established cleaning industry infrastructure.
- Europe: Strict environmental regulations pushing the demand for bio-based surfactants.
- Asia-Pacific: Rapid industrialization and growing consumer awareness.
Low Foam Surfactants Industry Product Developments
Recent innovations include the launch of high-performance nonionic surfactant blends for multi-soil cleaning (BASF SE) and the introduction of 100% bio-based surfactant ranges (Clariant AG), emphasizing sustainability and performance. These advancements are crucial in maintaining competitive edge and catering to the evolving needs of various end-user industries.
Challenges in the Low Foam Surfactants Industry Market
The low foam surfactants market faces challenges such as fluctuating raw material prices, stringent environmental regulations, and intense competition. Supply chain disruptions caused by geopolitical uncertainties can impact production and distribution, affecting profitability and product availability.
Forces Driving Low Foam Surfactants Industry Growth
Technological advancements such as the development of bio-based and high-performance surfactants, coupled with growing demand from various industries, are key drivers for market growth. Stringent environmental regulations are pushing the industry towards more sustainable options, further accelerating market expansion. Economic growth in developing economies also contributes to increased consumption and market size.
Long-Term Growth Catalysts in the Low Foam Surfactants Industry
Long-term growth is expected to be fueled by strategic partnerships, technological innovations, and expansion into new markets. Focus on sustainability, bio-based products, and efficient production processes will ensure the long-term success of the market.
Emerging Opportunities in Low Foam Surfactants Industry
Emerging opportunities include the development of specialized surfactants for niche applications, the expansion into rapidly growing markets, and the utilization of advanced technologies like nanotechnology to enhance product performance and sustainability. The demand for high-performance, sustainable, and cost-effective cleaning solutions continues to drive market expansion.
Leading Players in the Low Foam Surfactants Industry Sector
- AkzoNobel N V
- Nufarm
- Solvay
- Croda International plc
- Evonik Industries AG
- BASF SE
- Huntsman International LLC
- Dow
- KAO CORPORATION
- Oxiteno SA
- Stepan Company
- Clariant AG
Key Milestones in Low Foam Surfactants Industry Industry
- April 2022: BASF SE announced the expansion of its Dehypound range of nonionic surfactant blends, enhancing multi-soil cleaning capabilities. This launch solidified BASF's position as a key innovator in high-performance cleaning solutions.
- February 2022: Clariant launched a 100% bio-based surfactant range, significantly contributing to the growing market segment of sustainable cleaning solutions and underlining the company's commitment to environmentally conscious product development.
Strategic Outlook for Low Foam Surfactants Industry Market
The low foam surfactants market holds significant future potential, driven by continuous innovation, sustainability concerns, and expanding applications across various industries. Strategic partnerships, investments in R&D, and timely adaptation to evolving regulatory landscapes will determine future success in this growing market.
Low Foam Surfactants Industry Segmentation
-
1. Type
- 1.1. Amphoteric
- 1.2. Cationic
- 1.3. Non-ionic
-
2. End-user Industry
- 2.1. Agrochemicals
- 2.2. Food and Dairy Process Cleaners
- 2.3. Detergents and Cleaning Agents
- 2.4. Pulp and Paper
- 2.5. Metal Cleaning and Metal Working Fluids
- 2.6. Oilfield Chemicals
- 2.7. Others (Textiles, Personal care, etc.)
Low Foam Surfactants Industry Segmentation By Geography
-
1. Asia Pacific
- 1.1. China
- 1.2. India
- 1.3. Japan
- 1.4. South Korea
- 1.5. Rest of Asia Pacific
-
2. North America
- 2.1. United States
- 2.2. Canada
- 2.3. Mexico
-
3. Europe
- 3.1. Germany
- 3.2. United Kingdom
- 3.3. Italy
- 3.4. France
- 3.5. Rest of Europe
-
4. South America
- 4.1. Brazil
- 4.2. Argentina
- 4.3. Rest of South America
-
5. Middle East and Africa
- 5.1. Saudi Arabia
- 5.2. South Africa
- 5.3. Rest of Middle East and Africa
Low Foam Surfactants Industry REPORT HIGHLIGHTS
| Aspects | Details |
|---|---|
| Study Period | 2019-2033 |
| Base Year | 2024 |
| Estimated Year | 2025 |
| Forecast Period | 2025-2033 |
| Historical Period | 2019-2024 |
| Growth Rate | CAGR of > 4.00% from 2019-2033 |
| Segmentation |
|
Table of Contents
- 1. Introduction
- 1.1. Research Scope
- 1.2. Market Segmentation
- 1.3. Research Methodology
- 1.4. Definitions and Assumptions
- 2. Executive Summary
- 2.1. Introduction
- 3. Market Dynamics
- 3.1. Introduction
- 3.2. Market Drivers
- 3.2.1. Significant Growth in Detergents and Cleaning Agents; Increased Demand for Sustainable Surfactants; The rising demand for personal care products
- 3.3. Market Restrains
- 3.3.1. The Stringent Enviornmental Regulations; The Availability of Other Substitutes
- 3.4. Market Trends
- 3.4.1. Detergents and Cleaning Agents End-user Industry Segment to Dominate the Market
- 4. Market Factor Analysis
- 4.1. Porters Five Forces
- 4.2. Supply/Value Chain
- 4.3. PESTEL analysis
- 4.4. Market Entropy
- 4.5. Patent/Trademark Analysis
- 5. Global Low Foam Surfactants Industry Analysis, Insights and Forecast, 2019-2031
- 5.1. Market Analysis, Insights and Forecast - by Type
- 5.1.1. Amphoteric
- 5.1.2. Cationic
- 5.1.3. Non-ionic
- 5.2. Market Analysis, Insights and Forecast - by End-user Industry
- 5.2.1. Agrochemicals
- 5.2.2. Food and Dairy Process Cleaners
- 5.2.3. Detergents and Cleaning Agents
- 5.2.4. Pulp and Paper
- 5.2.5. Metal Cleaning and Metal Working Fluids
- 5.2.6. Oilfield Chemicals
- 5.2.7. Others (Textiles, Personal care, etc.)
- 5.3. Market Analysis, Insights and Forecast - by Region
- 5.3.1. Asia Pacific
- 5.3.2. North America
- 5.3.3. Europe
- 5.3.4. South America
- 5.3.5. Middle East and Africa
- 5.1. Market Analysis, Insights and Forecast - by Type
- 6. Asia Pacific Low Foam Surfactants Industry Analysis, Insights and Forecast, 2019-2031
- 6.1. Market Analysis, Insights and Forecast - by Type
- 6.1.1. Amphoteric
- 6.1.2. Cationic
- 6.1.3. Non-ionic
- 6.2. Market Analysis, Insights and Forecast - by End-user Industry
- 6.2.1. Agrochemicals
- 6.2.2. Food and Dairy Process Cleaners
- 6.2.3. Detergents and Cleaning Agents
- 6.2.4. Pulp and Paper
- 6.2.5. Metal Cleaning and Metal Working Fluids
- 6.2.6. Oilfield Chemicals
- 6.2.7. Others (Textiles, Personal care, etc.)
- 6.1. Market Analysis, Insights and Forecast - by Type
- 7. North America Low Foam Surfactants Industry Analysis, Insights and Forecast, 2019-2031
- 7.1. Market Analysis, Insights and Forecast - by Type
- 7.1.1. Amphoteric
- 7.1.2. Cationic
- 7.1.3. Non-ionic
- 7.2. Market Analysis, Insights and Forecast - by End-user Industry
- 7.2.1. Agrochemicals
- 7.2.2. Food and Dairy Process Cleaners
- 7.2.3. Detergents and Cleaning Agents
- 7.2.4. Pulp and Paper
- 7.2.5. Metal Cleaning and Metal Working Fluids
- 7.2.6. Oilfield Chemicals
- 7.2.7. Others (Textiles, Personal care, etc.)
- 7.1. Market Analysis, Insights and Forecast - by Type
- 8. Europe Low Foam Surfactants Industry Analysis, Insights and Forecast, 2019-2031
- 8.1. Market Analysis, Insights and Forecast - by Type
- 8.1.1. Amphoteric
- 8.1.2. Cationic
- 8.1.3. Non-ionic
- 8.2. Market Analysis, Insights and Forecast - by End-user Industry
- 8.2.1. Agrochemicals
- 8.2.2. Food and Dairy Process Cleaners
- 8.2.3. Detergents and Cleaning Agents
- 8.2.4. Pulp and Paper
- 8.2.5. Metal Cleaning and Metal Working Fluids
- 8.2.6. Oilfield Chemicals
- 8.2.7. Others (Textiles, Personal care, etc.)
- 8.1. Market Analysis, Insights and Forecast - by Type
- 9. South America Low Foam Surfactants Industry Analysis, Insights and Forecast, 2019-2031
- 9.1. Market Analysis, Insights and Forecast - by Type
- 9.1.1. Amphoteric
- 9.1.2. Cationic
- 9.1.3. Non-ionic
- 9.2. Market Analysis, Insights and Forecast - by End-user Industry
- 9.2.1. Agrochemicals
- 9.2.2. Food and Dairy Process Cleaners
- 9.2.3. Detergents and Cleaning Agents
- 9.2.4. Pulp and Paper
- 9.2.5. Metal Cleaning and Metal Working Fluids
- 9.2.6. Oilfield Chemicals
- 9.2.7. Others (Textiles, Personal care, etc.)
- 9.1. Market Analysis, Insights and Forecast - by Type
- 10. Middle East and Africa Low Foam Surfactants Industry Analysis, Insights and Forecast, 2019-2031
- 10.1. Market Analysis, Insights and Forecast - by Type
- 10.1.1. Amphoteric
- 10.1.2. Cationic
- 10.1.3. Non-ionic
- 10.2. Market Analysis, Insights and Forecast - by End-user Industry
- 10.2.1. Agrochemicals
- 10.2.2. Food and Dairy Process Cleaners
- 10.2.3. Detergents and Cleaning Agents
- 10.2.4. Pulp and Paper
- 10.2.5. Metal Cleaning and Metal Working Fluids
- 10.2.6. Oilfield Chemicals
- 10.2.7. Others (Textiles, Personal care, etc.)
- 10.1. Market Analysis, Insights and Forecast - by Type
- 11. Asia Pacific Low Foam Surfactants Industry Analysis, Insights and Forecast, 2019-2031
- 11.1. Market Analysis, Insights and Forecast - By Country/Sub-region
- 11.1.1 China
- 11.1.2 India
- 11.1.3 Japan
- 11.1.4 South Korea
- 11.1.5 Rest of Asia Pacific
- 12. North America Low Foam Surfactants Industry Analysis, Insights and Forecast, 2019-2031
- 12.1. Market Analysis, Insights and Forecast - By Country/Sub-region
- 12.1.1 United States
- 12.1.2 Canada
- 12.1.3 Mexico
- 13. Europe Low Foam Surfactants Industry Analysis, Insights and Forecast, 2019-2031
- 13.1. Market Analysis, Insights and Forecast - By Country/Sub-region
- 13.1.1 Germany
- 13.1.2 United Kingdom
- 13.1.3 Italy
- 13.1.4 France
- 13.1.5 Rest of Europe
- 14. South America Low Foam Surfactants Industry Analysis, Insights and Forecast, 2019-2031
- 14.1. Market Analysis, Insights and Forecast - By Country/Sub-region
- 14.1.1 Brazil
- 14.1.2 Argentina
- 14.1.3 Rest of South America
- 15. Middle East and Africa Low Foam Surfactants Industry Analysis, Insights and Forecast, 2019-2031
- 15.1. Market Analysis, Insights and Forecast - By Country/Sub-region
- 15.1.1 Saudi Arabia
- 15.1.2 South Africa
- 15.1.3 Rest of Middle East and Africa
- 16. Competitive Analysis
- 16.1. Global Market Share Analysis 2024
- 16.2. Company Profiles
- 16.2.1 AkzoNobel N V
- 16.2.1.1. Overview
- 16.2.1.2. Products
- 16.2.1.3. SWOT Analysis
- 16.2.1.4. Recent Developments
- 16.2.1.5. Financials (Based on Availability)
- 16.2.2 Nufarm
- 16.2.2.1. Overview
- 16.2.2.2. Products
- 16.2.2.3. SWOT Analysis
- 16.2.2.4. Recent Developments
- 16.2.2.5. Financials (Based on Availability)
- 16.2.3 Solvay
- 16.2.3.1. Overview
- 16.2.3.2. Products
- 16.2.3.3. SWOT Analysis
- 16.2.3.4. Recent Developments
- 16.2.3.5. Financials (Based on Availability)
- 16.2.4 Croda International plc
- 16.2.4.1. Overview
- 16.2.4.2. Products
- 16.2.4.3. SWOT Analysis
- 16.2.4.4. Recent Developments
- 16.2.4.5. Financials (Based on Availability)
- 16.2.5 Evonik Industries AG
- 16.2.5.1. Overview
- 16.2.5.2. Products
- 16.2.5.3. SWOT Analysis
- 16.2.5.4. Recent Developments
- 16.2.5.5. Financials (Based on Availability)
- 16.2.6 BASF SE
- 16.2.6.1. Overview
- 16.2.6.2. Products
- 16.2.6.3. SWOT Analysis
- 16.2.6.4. Recent Developments
- 16.2.6.5. Financials (Based on Availability)
- 16.2.7 Huntsman International LLC
- 16.2.7.1. Overview
- 16.2.7.2. Products
- 16.2.7.3. SWOT Analysis
- 16.2.7.4. Recent Developments
- 16.2.7.5. Financials (Based on Availability)
- 16.2.8 Dow
- 16.2.8.1. Overview
- 16.2.8.2. Products
- 16.2.8.3. SWOT Analysis
- 16.2.8.4. Recent Developments
- 16.2.8.5. Financials (Based on Availability)
- 16.2.9 KAO CORPORATION
- 16.2.9.1. Overview
- 16.2.9.2. Products
- 16.2.9.3. SWOT Analysis
- 16.2.9.4. Recent Developments
- 16.2.9.5. Financials (Based on Availability)
- 16.2.10 Oxiteno SA
- 16.2.10.1. Overview
- 16.2.10.2. Products
- 16.2.10.3. SWOT Analysis
- 16.2.10.4. Recent Developments
- 16.2.10.5. Financials (Based on Availability)
- 16.2.11 Stepan Company*List Not Exhaustive
- 16.2.11.1. Overview
- 16.2.11.2. Products
- 16.2.11.3. SWOT Analysis
- 16.2.11.4. Recent Developments
- 16.2.11.5. Financials (Based on Availability)
- 16.2.12 Clariant AG
- 16.2.12.1. Overview
- 16.2.12.2. Products
- 16.2.12.3. SWOT Analysis
- 16.2.12.4. Recent Developments
- 16.2.12.5. Financials (Based on Availability)
- 16.2.1 AkzoNobel N V
List of Figures
- Figure 1: Global Low Foam Surfactants Industry Revenue Breakdown (Million, %) by Region 2024 & 2032
- Figure 2: Global Low Foam Surfactants Industry Volume Breakdown (liter , %) by Region 2024 & 2032
- Figure 3: Asia Pacific Low Foam Surfactants Industry Revenue (Million), by Country 2024 & 2032
- Figure 4: Asia Pacific Low Foam Surfactants Industry Volume (liter ), by Country 2024 & 2032
- Figure 5: Asia Pacific Low Foam Surfactants Industry Revenue Share (%), by Country 2024 & 2032
- Figure 6: Asia Pacific Low Foam Surfactants Industry Volume Share (%), by Country 2024 & 2032
- Figure 7: North America Low Foam Surfactants Industry Revenue (Million), by Country 2024 & 2032
- Figure 8: North America Low Foam Surfactants Industry Volume (liter ), by Country 2024 & 2032
- Figure 9: North America Low Foam Surfactants Industry Revenue Share (%), by Country 2024 & 2032
- Figure 10: North America Low Foam Surfactants Industry Volume Share (%), by Country 2024 & 2032
- Figure 11: Europe Low Foam Surfactants Industry Revenue (Million), by Country 2024 & 2032
- Figure 12: Europe Low Foam Surfactants Industry Volume (liter ), by Country 2024 & 2032
- Figure 13: Europe Low Foam Surfactants Industry Revenue Share (%), by Country 2024 & 2032
- Figure 14: Europe Low Foam Surfactants Industry Volume Share (%), by Country 2024 & 2032
- Figure 15: South America Low Foam Surfactants Industry Revenue (Million), by Country 2024 & 2032
- Figure 16: South America Low Foam Surfactants Industry Volume (liter ), by Country 2024 & 2032
- Figure 17: South America Low Foam Surfactants Industry Revenue Share (%), by Country 2024 & 2032
- Figure 18: South America Low Foam Surfactants Industry Volume Share (%), by Country 2024 & 2032
- Figure 19: Middle East and Africa Low Foam Surfactants Industry Revenue (Million), by Country 2024 & 2032
- Figure 20: Middle East and Africa Low Foam Surfactants Industry Volume (liter ), by Country 2024 & 2032
- Figure 21: Middle East and Africa Low Foam Surfactants Industry Revenue Share (%), by Country 2024 & 2032
- Figure 22: Middle East and Africa Low Foam Surfactants Industry Volume Share (%), by Country 2024 & 2032
- Figure 23: Asia Pacific Low Foam Surfactants Industry Revenue (Million), by Type 2024 & 2032
- Figure 24: Asia Pacific Low Foam Surfactants Industry Volume (liter ), by Type 2024 & 2032
- Figure 25: Asia Pacific Low Foam Surfactants Industry Revenue Share (%), by Type 2024 & 2032
- Figure 26: Asia Pacific Low Foam Surfactants Industry Volume Share (%), by Type 2024 & 2032
- Figure 27: Asia Pacific Low Foam Surfactants Industry Revenue (Million), by End-user Industry 2024 & 2032
- Figure 28: Asia Pacific Low Foam Surfactants Industry Volume (liter ), by End-user Industry 2024 & 2032
- Figure 29: Asia Pacific Low Foam Surfactants Industry Revenue Share (%), by End-user Industry 2024 & 2032
- Figure 30: Asia Pacific Low Foam Surfactants Industry Volume Share (%), by End-user Industry 2024 & 2032
- Figure 31: Asia Pacific Low Foam Surfactants Industry Revenue (Million), by Country 2024 & 2032
- Figure 32: Asia Pacific Low Foam Surfactants Industry Volume (liter ), by Country 2024 & 2032
- Figure 33: Asia Pacific Low Foam Surfactants Industry Revenue Share (%), by Country 2024 & 2032
- Figure 34: Asia Pacific Low Foam Surfactants Industry Volume Share (%), by Country 2024 & 2032
- Figure 35: North America Low Foam Surfactants Industry Revenue (Million), by Type 2024 & 2032
- Figure 36: North America Low Foam Surfactants Industry Volume (liter ), by Type 2024 & 2032
- Figure 37: North America Low Foam Surfactants Industry Revenue Share (%), by Type 2024 & 2032
- Figure 38: North America Low Foam Surfactants Industry Volume Share (%), by Type 2024 & 2032
- Figure 39: North America Low Foam Surfactants Industry Revenue (Million), by End-user Industry 2024 & 2032
- Figure 40: North America Low Foam Surfactants Industry Volume (liter ), by End-user Industry 2024 & 2032
- Figure 41: North America Low Foam Surfactants Industry Revenue Share (%), by End-user Industry 2024 & 2032
- Figure 42: North America Low Foam Surfactants Industry Volume Share (%), by End-user Industry 2024 & 2032
- Figure 43: North America Low Foam Surfactants Industry Revenue (Million), by Country 2024 & 2032
- Figure 44: North America Low Foam Surfactants Industry Volume (liter ), by Country 2024 & 2032
- Figure 45: North America Low Foam Surfactants Industry Revenue Share (%), by Country 2024 & 2032
- Figure 46: North America Low Foam Surfactants Industry Volume Share (%), by Country 2024 & 2032
- Figure 47: Europe Low Foam Surfactants Industry Revenue (Million), by Type 2024 & 2032
- Figure 48: Europe Low Foam Surfactants Industry Volume (liter ), by Type 2024 & 2032
- Figure 49: Europe Low Foam Surfactants Industry Revenue Share (%), by Type 2024 & 2032
- Figure 50: Europe Low Foam Surfactants Industry Volume Share (%), by Type 2024 & 2032
- Figure 51: Europe Low Foam Surfactants Industry Revenue (Million), by End-user Industry 2024 & 2032
- Figure 52: Europe Low Foam Surfactants Industry Volume (liter ), by End-user Industry 2024 & 2032
- Figure 53: Europe Low Foam Surfactants Industry Revenue Share (%), by End-user Industry 2024 & 2032
- Figure 54: Europe Low Foam Surfactants Industry Volume Share (%), by End-user Industry 2024 & 2032
- Figure 55: Europe Low Foam Surfactants Industry Revenue (Million), by Country 2024 & 2032
- Figure 56: Europe Low Foam Surfactants Industry Volume (liter ), by Country 2024 & 2032
- Figure 57: Europe Low Foam Surfactants Industry Revenue Share (%), by Country 2024 & 2032
- Figure 58: Europe Low Foam Surfactants Industry Volume Share (%), by Country 2024 & 2032
- Figure 59: South America Low Foam Surfactants Industry Revenue (Million), by Type 2024 & 2032
- Figure 60: South America Low Foam Surfactants Industry Volume (liter ), by Type 2024 & 2032
- Figure 61: South America Low Foam Surfactants Industry Revenue Share (%), by Type 2024 & 2032
- Figure 62: South America Low Foam Surfactants Industry Volume Share (%), by Type 2024 & 2032
- Figure 63: South America Low Foam Surfactants Industry Revenue (Million), by End-user Industry 2024 & 2032
- Figure 64: South America Low Foam Surfactants Industry Volume (liter ), by End-user Industry 2024 & 2032
- Figure 65: South America Low Foam Surfactants Industry Revenue Share (%), by End-user Industry 2024 & 2032
- Figure 66: South America Low Foam Surfactants Industry Volume Share (%), by End-user Industry 2024 & 2032
- Figure 67: South America Low Foam Surfactants Industry Revenue (Million), by Country 2024 & 2032
- Figure 68: South America Low Foam Surfactants Industry Volume (liter ), by Country 2024 & 2032
- Figure 69: South America Low Foam Surfactants Industry Revenue Share (%), by Country 2024 & 2032
- Figure 70: South America Low Foam Surfactants Industry Volume Share (%), by Country 2024 & 2032
- Figure 71: Middle East and Africa Low Foam Surfactants Industry Revenue (Million), by Type 2024 & 2032
- Figure 72: Middle East and Africa Low Foam Surfactants Industry Volume (liter ), by Type 2024 & 2032
- Figure 73: Middle East and Africa Low Foam Surfactants Industry Revenue Share (%), by Type 2024 & 2032
- Figure 74: Middle East and Africa Low Foam Surfactants Industry Volume Share (%), by Type 2024 & 2032
- Figure 75: Middle East and Africa Low Foam Surfactants Industry Revenue (Million), by End-user Industry 2024 & 2032
- Figure 76: Middle East and Africa Low Foam Surfactants Industry Volume (liter ), by End-user Industry 2024 & 2032
- Figure 77: Middle East and Africa Low Foam Surfactants Industry Revenue Share (%), by End-user Industry 2024 & 2032
- Figure 78: Middle East and Africa Low Foam Surfactants Industry Volume Share (%), by End-user Industry 2024 & 2032
- Figure 79: Middle East and Africa Low Foam Surfactants Industry Revenue (Million), by Country 2024 & 2032
- Figure 80: Middle East and Africa Low Foam Surfactants Industry Volume (liter ), by Country 2024 & 2032
- Figure 81: Middle East and Africa Low Foam Surfactants Industry Revenue Share (%), by Country 2024 & 2032
- Figure 82: Middle East and Africa Low Foam Surfactants Industry Volume Share (%), by Country 2024 & 2032
List of Tables
- Table 1: Global Low Foam Surfactants Industry Revenue Million Forecast, by Region 2019 & 2032
- Table 2: Global Low Foam Surfactants Industry Volume liter Forecast, by Region 2019 & 2032
- Table 3: Global Low Foam Surfactants Industry Revenue Million Forecast, by Type 2019 & 2032
- Table 4: Global Low Foam Surfactants Industry Volume liter Forecast, by Type 2019 & 2032
- Table 5: Global Low Foam Surfactants Industry Revenue Million Forecast, by End-user Industry 2019 & 2032
- Table 6: Global Low Foam Surfactants Industry Volume liter Forecast, by End-user Industry 2019 & 2032
- Table 7: Global Low Foam Surfactants Industry Revenue Million Forecast, by Region 2019 & 2032
- Table 8: Global Low Foam Surfactants Industry Volume liter Forecast, by Region 2019 & 2032
- Table 9: Global Low Foam Surfactants Industry Revenue Million Forecast, by Country 2019 & 2032
- Table 10: Global Low Foam Surfactants Industry Volume liter Forecast, by Country 2019 & 2032
- Table 11: China Low Foam Surfactants Industry Revenue (Million) Forecast, by Application 2019 & 2032
- Table 12: China Low Foam Surfactants Industry Volume (liter ) Forecast, by Application 2019 & 2032
- Table 13: India Low Foam Surfactants Industry Revenue (Million) Forecast, by Application 2019 & 2032
- Table 14: India Low Foam Surfactants Industry Volume (liter ) Forecast, by Application 2019 & 2032
- Table 15: Japan Low Foam Surfactants Industry Revenue (Million) Forecast, by Application 2019 & 2032
- Table 16: Japan Low Foam Surfactants Industry Volume (liter ) Forecast, by Application 2019 & 2032
- Table 17: South Korea Low Foam Surfactants Industry Revenue (Million) Forecast, by Application 2019 & 2032
- Table 18: South Korea Low Foam Surfactants Industry Volume (liter ) Forecast, by Application 2019 & 2032
- Table 19: Rest of Asia Pacific Low Foam Surfactants Industry Revenue (Million) Forecast, by Application 2019 & 2032
- Table 20: Rest of Asia Pacific Low Foam Surfactants Industry Volume (liter ) Forecast, by Application 2019 & 2032
- Table 21: Global Low Foam Surfactants Industry Revenue Million Forecast, by Country 2019 & 2032
- Table 22: Global Low Foam Surfactants Industry Volume liter Forecast, by Country 2019 & 2032
- Table 23: United States Low Foam Surfactants Industry Revenue (Million) Forecast, by Application 2019 & 2032
- Table 24: United States Low Foam Surfactants Industry Volume (liter ) Forecast, by Application 2019 & 2032
- Table 25: Canada Low Foam Surfactants Industry Revenue (Million) Forecast, by Application 2019 & 2032
- Table 26: Canada Low Foam Surfactants Industry Volume (liter ) Forecast, by Application 2019 & 2032
- Table 27: Mexico Low Foam Surfactants Industry Revenue (Million) Forecast, by Application 2019 & 2032
- Table 28: Mexico Low Foam Surfactants Industry Volume (liter ) Forecast, by Application 2019 & 2032
- Table 29: Global Low Foam Surfactants Industry Revenue Million Forecast, by Country 2019 & 2032
- Table 30: Global Low Foam Surfactants Industry Volume liter Forecast, by Country 2019 & 2032
- Table 31: Germany Low Foam Surfactants Industry Revenue (Million) Forecast, by Application 2019 & 2032
- Table 32: Germany Low Foam Surfactants Industry Volume (liter ) Forecast, by Application 2019 & 2032
- Table 33: United Kingdom Low Foam Surfactants Industry Revenue (Million) Forecast, by Application 2019 & 2032
- Table 34: United Kingdom Low Foam Surfactants Industry Volume (liter ) Forecast, by Application 2019 & 2032
- Table 35: Italy Low Foam Surfactants Industry Revenue (Million) Forecast, by Application 2019 & 2032
- Table 36: Italy Low Foam Surfactants Industry Volume (liter ) Forecast, by Application 2019 & 2032
- Table 37: France Low Foam Surfactants Industry Revenue (Million) Forecast, by Application 2019 & 2032
- Table 38: France Low Foam Surfactants Industry Volume (liter ) Forecast, by Application 2019 & 2032
- Table 39: Rest of Europe Low Foam Surfactants Industry Revenue (Million) Forecast, by Application 2019 & 2032
- Table 40: Rest of Europe Low Foam Surfactants Industry Volume (liter ) Forecast, by Application 2019 & 2032
- Table 41: Global Low Foam Surfactants Industry Revenue Million Forecast, by Country 2019 & 2032
- Table 42: Global Low Foam Surfactants Industry Volume liter Forecast, by Country 2019 & 2032
- Table 43: Brazil Low Foam Surfactants Industry Revenue (Million) Forecast, by Application 2019 & 2032
- Table 44: Brazil Low Foam Surfactants Industry Volume (liter ) Forecast, by Application 2019 & 2032
- Table 45: Argentina Low Foam Surfactants Industry Revenue (Million) Forecast, by Application 2019 & 2032
- Table 46: Argentina Low Foam Surfactants Industry Volume (liter ) Forecast, by Application 2019 & 2032
- Table 47: Rest of South America Low Foam Surfactants Industry Revenue (Million) Forecast, by Application 2019 & 2032
- Table 48: Rest of South America Low Foam Surfactants Industry Volume (liter ) Forecast, by Application 2019 & 2032
- Table 49: Global Low Foam Surfactants Industry Revenue Million Forecast, by Country 2019 & 2032
- Table 50: Global Low Foam Surfactants Industry Volume liter Forecast, by Country 2019 & 2032
- Table 51: Saudi Arabia Low Foam Surfactants Industry Revenue (Million) Forecast, by Application 2019 & 2032
- Table 52: Saudi Arabia Low Foam Surfactants Industry Volume (liter ) Forecast, by Application 2019 & 2032
- Table 53: South Africa Low Foam Surfactants Industry Revenue (Million) Forecast, by Application 2019 & 2032
- Table 54: South Africa Low Foam Surfactants Industry Volume (liter ) Forecast, by Application 2019 & 2032
- Table 55: Rest of Middle East and Africa Low Foam Surfactants Industry Revenue (Million) Forecast, by Application 2019 & 2032
- Table 56: Rest of Middle East and Africa Low Foam Surfactants Industry Volume (liter ) Forecast, by Application 2019 & 2032
- Table 57: Global Low Foam Surfactants Industry Revenue Million Forecast, by Type 2019 & 2032
- Table 58: Global Low Foam Surfactants Industry Volume liter Forecast, by Type 2019 & 2032
- Table 59: Global Low Foam Surfactants Industry Revenue Million Forecast, by End-user Industry 2019 & 2032
- Table 60: Global Low Foam Surfactants Industry Volume liter Forecast, by End-user Industry 2019 & 2032
- Table 61: Global Low Foam Surfactants Industry Revenue Million Forecast, by Country 2019 & 2032
- Table 62: Global Low Foam Surfactants Industry Volume liter Forecast, by Country 2019 & 2032
- Table 63: China Low Foam Surfactants Industry Revenue (Million) Forecast, by Application 2019 & 2032
- Table 64: China Low Foam Surfactants Industry Volume (liter ) Forecast, by Application 2019 & 2032
- Table 65: India Low Foam Surfactants Industry Revenue (Million) Forecast, by Application 2019 & 2032
- Table 66: India Low Foam Surfactants Industry Volume (liter ) Forecast, by Application 2019 & 2032
- Table 67: Japan Low Foam Surfactants Industry Revenue (Million) Forecast, by Application 2019 & 2032
- Table 68: Japan Low Foam Surfactants Industry Volume (liter ) Forecast, by Application 2019 & 2032
- Table 69: South Korea Low Foam Surfactants Industry Revenue (Million) Forecast, by Application 2019 & 2032
- Table 70: South Korea Low Foam Surfactants Industry Volume (liter ) Forecast, by Application 2019 & 2032
- Table 71: Rest of Asia Pacific Low Foam Surfactants Industry Revenue (Million) Forecast, by Application 2019 & 2032
- Table 72: Rest of Asia Pacific Low Foam Surfactants Industry Volume (liter ) Forecast, by Application 2019 & 2032
- Table 73: Global Low Foam Surfactants Industry Revenue Million Forecast, by Type 2019 & 2032
- Table 74: Global Low Foam Surfactants Industry Volume liter Forecast, by Type 2019 & 2032
- Table 75: Global Low Foam Surfactants Industry Revenue Million Forecast, by End-user Industry 2019 & 2032
- Table 76: Global Low Foam Surfactants Industry Volume liter Forecast, by End-user Industry 2019 & 2032
- Table 77: Global Low Foam Surfactants Industry Revenue Million Forecast, by Country 2019 & 2032
- Table 78: Global Low Foam Surfactants Industry Volume liter Forecast, by Country 2019 & 2032
- Table 79: United States Low Foam Surfactants Industry Revenue (Million) Forecast, by Application 2019 & 2032
- Table 80: United States Low Foam Surfactants Industry Volume (liter ) Forecast, by Application 2019 & 2032
- Table 81: Canada Low Foam Surfactants Industry Revenue (Million) Forecast, by Application 2019 & 2032
- Table 82: Canada Low Foam Surfactants Industry Volume (liter ) Forecast, by Application 2019 & 2032
- Table 83: Mexico Low Foam Surfactants Industry Revenue (Million) Forecast, by Application 2019 & 2032
- Table 84: Mexico Low Foam Surfactants Industry Volume (liter ) Forecast, by Application 2019 & 2032
- Table 85: Global Low Foam Surfactants Industry Revenue Million Forecast, by Type 2019 & 2032
- Table 86: Global Low Foam Surfactants Industry Volume liter Forecast, by Type 2019 & 2032
- Table 87: Global Low Foam Surfactants Industry Revenue Million Forecast, by End-user Industry 2019 & 2032
- Table 88: Global Low Foam Surfactants Industry Volume liter Forecast, by End-user Industry 2019 & 2032
- Table 89: Global Low Foam Surfactants Industry Revenue Million Forecast, by Country 2019 & 2032
- Table 90: Global Low Foam Surfactants Industry Volume liter Forecast, by Country 2019 & 2032
- Table 91: Germany Low Foam Surfactants Industry Revenue (Million) Forecast, by Application 2019 & 2032
- Table 92: Germany Low Foam Surfactants Industry Volume (liter ) Forecast, by Application 2019 & 2032
- Table 93: United Kingdom Low Foam Surfactants Industry Revenue (Million) Forecast, by Application 2019 & 2032
- Table 94: United Kingdom Low Foam Surfactants Industry Volume (liter ) Forecast, by Application 2019 & 2032
- Table 95: Italy Low Foam Surfactants Industry Revenue (Million) Forecast, by Application 2019 & 2032
- Table 96: Italy Low Foam Surfactants Industry Volume (liter ) Forecast, by Application 2019 & 2032
- Table 97: France Low Foam Surfactants Industry Revenue (Million) Forecast, by Application 2019 & 2032
- Table 98: France Low Foam Surfactants Industry Volume (liter ) Forecast, by Application 2019 & 2032
- Table 99: Rest of Europe Low Foam Surfactants Industry Revenue (Million) Forecast, by Application 2019 & 2032
- Table 100: Rest of Europe Low Foam Surfactants Industry Volume (liter ) Forecast, by Application 2019 & 2032
- Table 101: Global Low Foam Surfactants Industry Revenue Million Forecast, by Type 2019 & 2032
- Table 102: Global Low Foam Surfactants Industry Volume liter Forecast, by Type 2019 & 2032
- Table 103: Global Low Foam Surfactants Industry Revenue Million Forecast, by End-user Industry 2019 & 2032
- Table 104: Global Low Foam Surfactants Industry Volume liter Forecast, by End-user Industry 2019 & 2032
- Table 105: Global Low Foam Surfactants Industry Revenue Million Forecast, by Country 2019 & 2032
- Table 106: Global Low Foam Surfactants Industry Volume liter Forecast, by Country 2019 & 2032
- Table 107: Brazil Low Foam Surfactants Industry Revenue (Million) Forecast, by Application 2019 & 2032
- Table 108: Brazil Low Foam Surfactants Industry Volume (liter ) Forecast, by Application 2019 & 2032
- Table 109: Argentina Low Foam Surfactants Industry Revenue (Million) Forecast, by Application 2019 & 2032
- Table 110: Argentina Low Foam Surfactants Industry Volume (liter ) Forecast, by Application 2019 & 2032
- Table 111: Rest of South America Low Foam Surfactants Industry Revenue (Million) Forecast, by Application 2019 & 2032
- Table 112: Rest of South America Low Foam Surfactants Industry Volume (liter ) Forecast, by Application 2019 & 2032
- Table 113: Global Low Foam Surfactants Industry Revenue Million Forecast, by Type 2019 & 2032
- Table 114: Global Low Foam Surfactants Industry Volume liter Forecast, by Type 2019 & 2032
- Table 115: Global Low Foam Surfactants Industry Revenue Million Forecast, by End-user Industry 2019 & 2032
- Table 116: Global Low Foam Surfactants Industry Volume liter Forecast, by End-user Industry 2019 & 2032
- Table 117: Global Low Foam Surfactants Industry Revenue Million Forecast, by Country 2019 & 2032
- Table 118: Global Low Foam Surfactants Industry Volume liter Forecast, by Country 2019 & 2032
- Table 119: Saudi Arabia Low Foam Surfactants Industry Revenue (Million) Forecast, by Application 2019 & 2032
- Table 120: Saudi Arabia Low Foam Surfactants Industry Volume (liter ) Forecast, by Application 2019 & 2032
- Table 121: South Africa Low Foam Surfactants Industry Revenue (Million) Forecast, by Application 2019 & 2032
- Table 122: South Africa Low Foam Surfactants Industry Volume (liter ) Forecast, by Application 2019 & 2032
- Table 123: Rest of Middle East and Africa Low Foam Surfactants Industry Revenue (Million) Forecast, by Application 2019 & 2032
- Table 124: Rest of Middle East and Africa Low Foam Surfactants Industry Volume (liter ) Forecast, by Application 2019 & 2032
Frequently Asked Questions
1. What is the projected Compound Annual Growth Rate (CAGR) of the Low Foam Surfactants Industry?
The projected CAGR is approximately > 4.00%.
2. Which companies are prominent players in the Low Foam Surfactants Industry?
Key companies in the market include AkzoNobel N V, Nufarm, Solvay, Croda International plc, Evonik Industries AG, BASF SE, Huntsman International LLC, Dow, KAO CORPORATION, Oxiteno SA, Stepan Company*List Not Exhaustive, Clariant AG.
3. What are the main segments of the Low Foam Surfactants Industry?
The market segments include Type, End-user Industry.
4. Can you provide details about the market size?
The market size is estimated to be USD 14.35 Million as of 2022.
5. What are some drivers contributing to market growth?
Significant Growth in Detergents and Cleaning Agents; Increased Demand for Sustainable Surfactants; The rising demand for personal care products.
6. What are the notable trends driving market growth?
Detergents and Cleaning Agents End-user Industry Segment to Dominate the Market.
7. Are there any restraints impacting market growth?
The Stringent Enviornmental Regulations; The Availability of Other Substitutes.
8. Can you provide examples of recent developments in the market?
April 2022: BASF SE announced the expansion of a new line of products, such as Dehypound M and Dehypound HDG. These high-performance nonionic surfactant blends are used for multi-soil, multi-application cleaning, and degreasing.
9. What pricing options are available for accessing the report?
Pricing options include single-user, multi-user, and enterprise licenses priced at USD 4750, USD 5250, and USD 8750 respectively.
10. Is the market size provided in terms of value or volume?
The market size is provided in terms of value, measured in Million and volume, measured in liter .
11. Are there any specific market keywords associated with the report?
Yes, the market keyword associated with the report is "Low Foam Surfactants Industry," which aids in identifying and referencing the specific market segment covered.
12. How do I determine which pricing option suits my needs best?
The pricing options vary based on user requirements and access needs. Individual users may opt for single-user licenses, while businesses requiring broader access may choose multi-user or enterprise licenses for cost-effective access to the report.
13. Are there any additional resources or data provided in the Low Foam Surfactants Industry report?
While the report offers comprehensive insights, it's advisable to review the specific contents or supplementary materials provided to ascertain if additional resources or data are available.
14. How can I stay updated on further developments or reports in the Low Foam Surfactants Industry?
To stay informed about further developments, trends, and reports in the Low Foam Surfactants Industry, consider subscribing to industry newsletters, following relevant companies and organizations, or regularly checking reputable industry news sources and publications.
Methodology
Step 1 - Identification of Relevant Samples Size from Population Database


Step 2 - Approaches for Defining Global Market Size (Value, Volume* & Price*)

Note*: In applicable scenarios
Step 3 - Data Sources
Primary Research
- Web Analytics
- Survey Reports
- Research Institute
- Latest Research Reports
- Opinion Leaders
Secondary Research
- Annual Reports
- White Paper
- Latest Press Release
- Industry Association
- Paid Database
- Investor Presentations

Step 4 - Data Triangulation
Involves using different sources of information in order to increase the validity of a study
These sources are likely to be stakeholders in a program - participants, other researchers, program staff, other community members, and so on.
Then we put all data in single framework & apply various statistical tools to find out the dynamic on the market.
During the analysis stage, feedback from the stakeholder groups would be compared to determine areas of agreement as well as areas of divergence
