

Key Insights
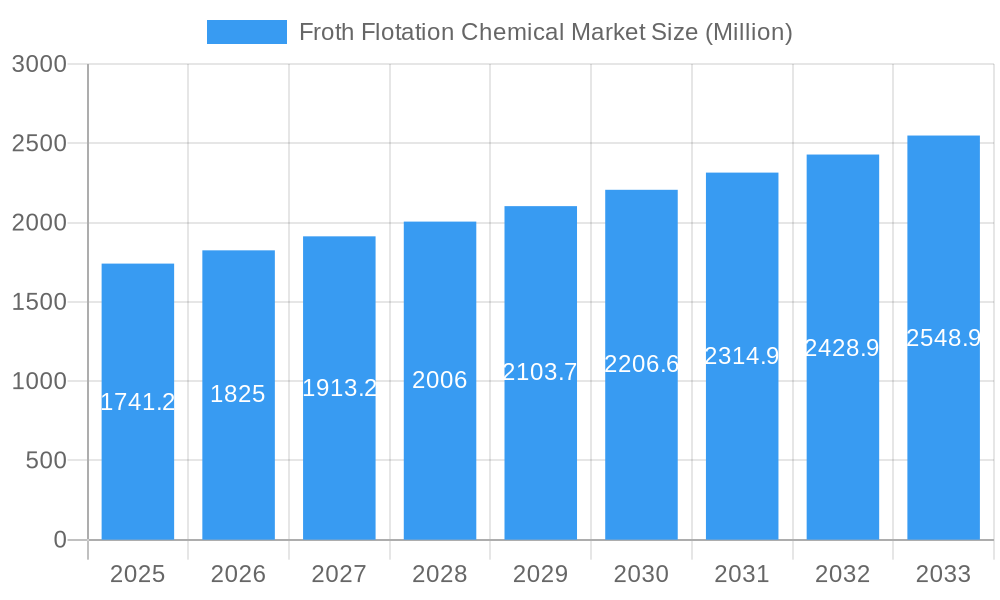
The Froth Flotation Chemical market, valued at $1741.2 million in 2025, is projected to experience robust growth, exhibiting a Compound Annual Growth Rate (CAGR) exceeding 4.50% from 2025 to 2033. This expansion is driven by the increasing demand for efficient mineral processing techniques in the mining industry, particularly for base metals and precious metals extraction. Growth is also fueled by the expanding pulp and paper industry, which relies heavily on froth flotation for efficient fiber separation and purification. Furthermore, the rising need for effective industrial waste and sewage treatment solutions is contributing to market growth, as froth flotation plays a vital role in removing pollutants and recovering valuable resources from wastewater streams. Specific reagent types like collectors and frothers are key segments experiencing significant growth due to technological advancements leading to improved selectivity and efficiency in flotation processes. Geographically, the Asia-Pacific region, especially China and India, is expected to dominate the market due to rapid industrialization and substantial investments in mining and related sectors. However, regulatory pressures concerning environmental protection and sustainable mining practices present potential restraints on market growth, requiring manufacturers to develop more environmentally friendly froth flotation chemicals.
Froth Flotation Chemical Market Market Size (In Billion)
The market's segmentation reveals significant opportunities. The neutral modifiers segment is likely to maintain its leading position due to their versatility in various applications. The deactivators segment is poised for steady growth, driven by the increasing need for precise control of the flotation process. Within end-user industries, mining will continue to be the largest segment, followed by the pulp and paper sector. The industrial waste and sewage treatment segment is projected to register the fastest growth due to stringent environmental regulations and the rising importance of resource recovery. Leading companies like Arkema, Air Products and Chemicals Inc., Solvay, and BASF SE are expected to maintain their market dominance through innovation and strategic acquisitions. Future growth will hinge on technological advancements focused on improving selectivity, reducing chemical consumption, and enhancing environmental sustainability.
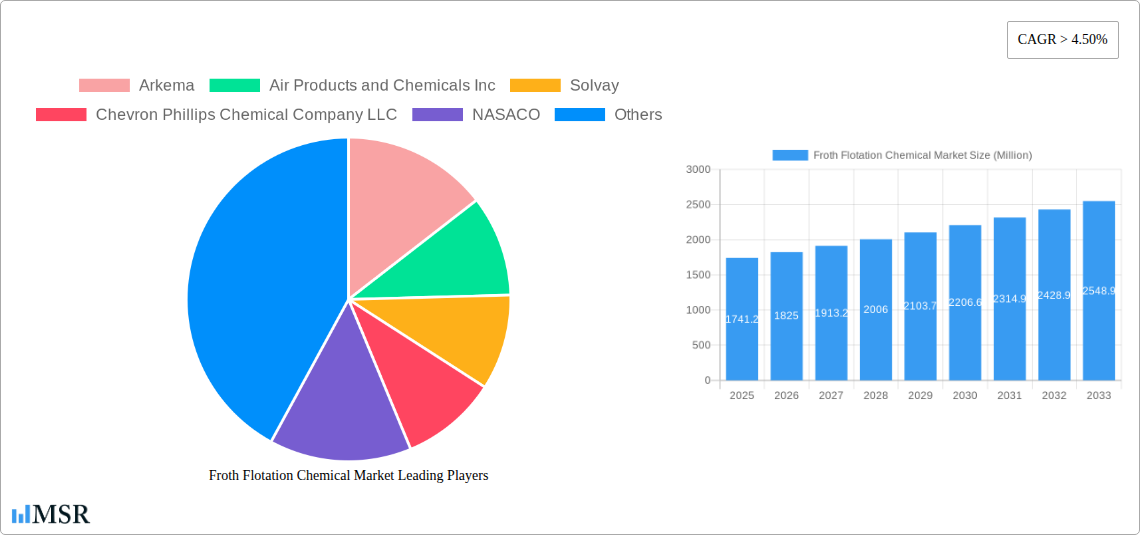
Froth Flotation Chemical Market Company Market Share
Froth Flotation Chemical Market: A Comprehensive Report (2019-2033)
This in-depth report provides a comprehensive analysis of the Froth Flotation Chemical market, encompassing market size, growth drivers, key segments, leading players, and future trends. With a study period spanning 2019-2033, a base year of 2025, and a forecast period of 2025-2033, this report offers invaluable insights for industry stakeholders, investors, and researchers seeking to understand and capitalize on the opportunities within this dynamic market. The global market size is estimated at xx Million in 2025 and is projected to reach xx Million by 2033, exhibiting a CAGR of xx%.
Froth Flotation Chemical Market Concentration & Dynamics
The Froth Flotation Chemical market exhibits a moderately concentrated landscape, with key players like Arkema, Air Products and Chemicals Inc, Solvay, Chevron Phillips Chemical Company LLC, NASACO, Nouryon, BASF SE, Kemira, Dow, and Clariant holding significant market share. Market concentration is influenced by factors such as economies of scale, technological advancements, and M&A activities. The market has witnessed xx M&A deals in the historical period (2019-2024), indicating a trend of consolidation.
- Market Share: The top five players collectively hold approximately xx% of the market share.
- Innovation Ecosystem: Continuous innovation in reagent types, particularly in collectors and frothers, drives market growth. The development of environmentally friendly and high-efficiency reagents is gaining traction.
- Regulatory Frameworks: Stringent environmental regulations related to mining and industrial waste treatment are impacting the market, driving demand for eco-friendly reagents.
- Substitute Products: The availability of alternative separation technologies poses a challenge, albeit a limited one, given froth flotation's efficiency in specific applications.
- End-User Trends: Growing demand from the mining industry, particularly in developing economies, fuels market expansion. Increased focus on sustainable practices in the pulp and paper industry also contributes to growth.
Froth Flotation Chemical Market Industry Insights & Trends
The Froth Flotation Chemical market is experiencing robust growth, driven by several factors. The increasing demand for minerals and metals, coupled with the expanding pulp and paper industry, is a primary growth driver. Technological advancements, particularly the development of AI-powered optimization systems like Solvay's SmartFloat, are enhancing the efficiency and cost-effectiveness of froth flotation processes. Furthermore, the growing awareness of environmental concerns is pushing the demand for eco-friendly reagents. The market size witnessed significant growth in the historical period (2019-2024), expanding from xx Million to xx Million, showcasing a robust growth trajectory. This momentum is expected to continue throughout the forecast period, with a projected CAGR of xx%. The evolving consumer behavior towards environmentally conscious practices further supports the adoption of sustainable froth flotation chemicals.
Key Markets & Segments Leading Froth Flotation Chemical Market
The Mining industry remains the dominant end-user segment for froth flotation chemicals, accounting for approximately xx% of the market share. Geographically, the Asia-Pacific region is the leading market, driven by robust mining activities and economic growth.
- Drivers in the Mining Sector:
- High demand for minerals and metals.
- Expansion of mining operations in developing economies.
- Technological advancements enhancing efficiency.
- Drivers in the Pulp & Paper Sector:
- Growth in the global demand for paper and paper products.
- Focus on sustainable practices in pulp production.
- Dominance Analysis: The mining sector's dominance is attributable to the large-scale use of froth flotation in mineral processing. Asia-Pacific's leading role reflects the high concentration of mining activities in this region. The Neutral Modifiers segment holds a significant share within the reagent type category.
Froth Flotation Chemical Market Product Developments
Recent advancements in froth flotation chemicals focus on enhancing selectivity, efficiency, and environmental friendliness. New collector and frother formulations are being developed to improve recovery rates and reduce reagent consumption. The integration of AI and digital technologies is optimizing reagent dosage and improving overall process control. These innovations provide competitive advantages by reducing operating costs and minimizing environmental impact.
Challenges in the Froth Flotation Chemical Market
The market faces challenges such as fluctuating raw material prices, stringent environmental regulations, and intense competition among existing players. Supply chain disruptions can impact reagent availability and pricing, creating uncertainties in the market. Furthermore, the emergence of alternative separation technologies poses a competitive threat, albeit a limited one, for froth flotation in specialized applications.
Forces Driving Froth Flotation Chemical Market Growth
Technological advancements, coupled with increasing demand from key end-user industries, are the primary growth drivers. The development of more efficient and eco-friendly reagents is pushing market expansion. Government initiatives promoting sustainable mining practices further contribute to market growth. Strong economic growth in developing economies also fuels demand.
Long-Term Growth Catalysts in the Froth Flotation Chemical Market
Long-term growth will be fueled by innovations in reagent formulations, strategic partnerships between chemical manufacturers and mining companies, and expansion into new geographic markets, particularly in developing economies with significant mineral resources. The focus on sustainability and the integration of AI-powered solutions will be key drivers for future growth.
Emerging Opportunities in Froth Flotation Chemical Market
Emerging opportunities lie in the development of specialized reagents for challenging ore types, the growing demand for eco-friendly alternatives, and the integration of digital technologies to optimize froth flotation processes. Expansion into new end-user industries, such as industrial waste treatment and recycling, offers significant potential.
Leading Players in the Froth Flotation Chemical Market Sector
- Arkema
- Air Products and Chemicals Inc
- Solvay
- Chevron Phillips Chemical Company LLC
- NASACO
- Nouryon
- BASF SE
- Kemira
- Dow
- CLARIANT
Key Milestones in Froth Flotation Chemical Market Industry
- October 2022: Solvay launched 'SmartFloat,' an AI-based reagent optimization system for mining, significantly enhancing process efficiency and data utilization. This launch underscores the growing importance of digitalization in the froth flotation chemical market.
Strategic Outlook for Froth Flotation Chemical Market
The Froth Flotation Chemical market is poised for continued growth, driven by technological advancements, increasing demand from key industries, and a growing focus on sustainability. Strategic opportunities exist for companies to invest in R&D, expand into new markets, and develop innovative products to meet the evolving needs of the industry. The integration of digital technologies and the focus on environmentally friendly solutions will be crucial for long-term success.
Froth Flotation Chemical Market Segmentation
-
1. Reagent Type
-
1.1. Collectors
- 1.1.1. Cationic
- 1.1.2. Anionic
- 1.1.3. Non-ionic
-
1.2. Frothers
- 1.2.1. Acidic
- 1.2.2. Basic
- 1.2.3. Neutral
-
1.3. Modifiers
- 1.3.1. Acidic Depressants
- 1.3.2. pH modifiers
- 1.3.3. Activators
- 1.3.4. Deactivators
- 1.4. Other Reagent Types
-
1.1. Collectors
-
2. End-user Industry
- 2.1. Mining
- 2.2. Pulp and Paper
- 2.3. Industrial Waste and Sewage Treatment
- 2.4. Other End-user Industries
Froth Flotation Chemical Market Segmentation By Geography
-
1. Asia Pacific
- 1.1. China
- 1.2. India
- 1.3. Japan
- 1.4. South Korea
- 1.5. Rest of Asia Pacific
-
2. North America
- 2.1. United States
- 2.2. Canada
- 2.3. Mexico
-
3. Europe
- 3.1. Germany
- 3.2. United Kingdom
- 3.3. France
- 3.4. Italy
- 3.5. Rest of Europe
-
4. South America
- 4.1. Brazil
- 4.2. Argentina
- 4.3. Rest of South America
-
5. Middle East and Africa
- 5.1. Saudi Arabia
- 5.2. South Africa
- 5.3. Rest of Middle East and Africa
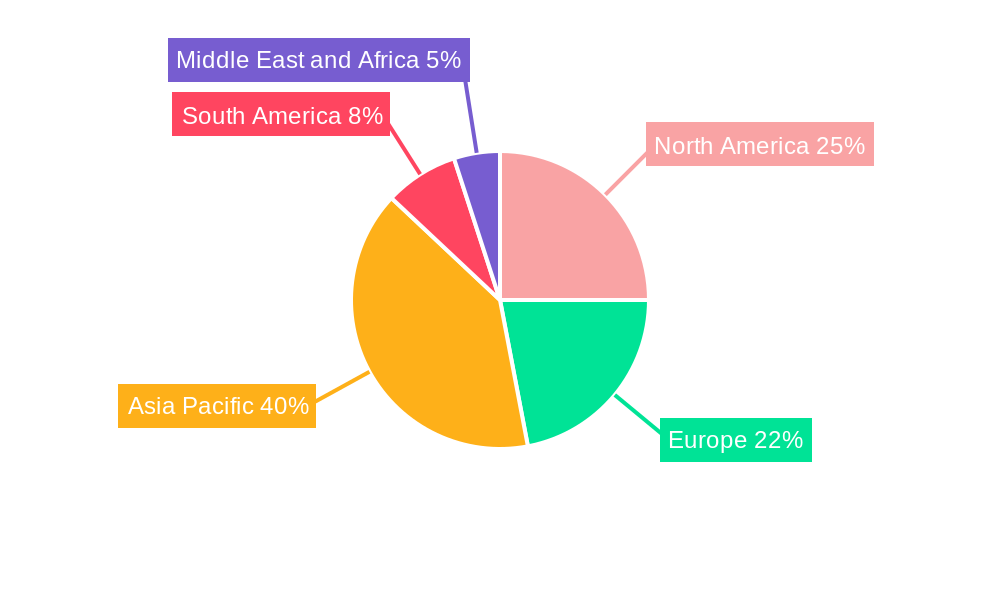
Froth Flotation Chemical Market Regional Market Share
Geographic Coverage of Froth Flotation Chemical Market
Froth Flotation Chemical Market REPORT HIGHLIGHTS
| Aspects | Details |
|---|---|
| Study Period | 2020-2034 |
| Base Year | 2025 |
| Estimated Year | 2026 |
| Forecast Period | 2026-2034 |
| Historical Period | 2020-2025 |
| Growth Rate | CAGR of > 4.50% from 2020-2034 |
| Segmentation |
|
Table of Contents
- 1. Introduction
- 1.1. Research Scope
- 1.2. Market Segmentation
- 1.3. Research Objective
- 1.4. Definitions and Assumptions
- 2. Executive Summary
- 2.1. Market Snapshot
- 3. Market Dynamics
- 3.1. Market Drivers
- 3.2. Market Restrains
- 3.3. Market Trends
- 3.4. Market Opportunities
- 4. Market Factor Analysis
- 4.1. Porters Five Forces
- 4.1.1. Bargaining Power of Suppliers
- 4.1.2. Bargaining Power of Buyers
- 4.1.3. Threat of New Entrants
- 4.1.4. Threat of Substitutes
- 4.1.5. Competitive Rivalry
- 4.2. PESTEL analysis
- 4.3. BCG Analysis
- 4.3.1. Stars (High Growth, High Market Share)
- 4.3.2. Cash Cows (Low Growth, High Market Share)
- 4.3.3. Question Mark (High Growth, Low Market Share)
- 4.3.4. Dogs (Low Growth, Low Market Share)
- 4.4. Ansoff Matrix Analysis
- 4.5. Supply Chain Analysis
- 4.6. Regulatory Landscape
- 4.7. Current Market Potential and Opportunity Assessment (TAM–SAM–SOM Framework)
- 4.8. MSR Analyst Note
- 4.1. Porters Five Forces
- 5. Market Analysis, Insights and Forecast 2021-2033
- 5.1. Market Analysis, Insights and Forecast - by Reagent Type
- 5.1.1. Collectors
- 5.1.1.1. Cationic
- 5.1.1.2. Anionic
- 5.1.1.3. Non-ionic
- 5.1.2. Frothers
- 5.1.2.1. Acidic
- 5.1.2.2. Basic
- 5.1.2.3. Neutral
- 5.1.3. Modifiers
- 5.1.3.1. Acidic Depressants
- 5.1.3.2. pH modifiers
- 5.1.3.3. Activators
- 5.1.3.4. Deactivators
- 5.1.4. Other Reagent Types
- 5.1.1. Collectors
- 5.2. Market Analysis, Insights and Forecast - by End-user Industry
- 5.2.1. Mining
- 5.2.2. Pulp and Paper
- 5.2.3. Industrial Waste and Sewage Treatment
- 5.2.4. Other End-user Industries
- 5.3. Market Analysis, Insights and Forecast - by Region
- 5.3.1. Asia Pacific
- 5.3.2. North America
- 5.3.3. Europe
- 5.3.4. South America
- 5.3.5. Middle East and Africa
- 5.1. Market Analysis, Insights and Forecast - by Reagent Type
- 6. Global Froth Flotation Chemical Market Analysis, Insights and Forecast, 2021-2033
- 6.1. Market Analysis, Insights and Forecast - by Reagent Type
- 6.1.1. Collectors
- 6.1.1.1. Cationic
- 6.1.1.2. Anionic
- 6.1.1.3. Non-ionic
- 6.1.2. Frothers
- 6.1.2.1. Acidic
- 6.1.2.2. Basic
- 6.1.2.3. Neutral
- 6.1.3. Modifiers
- 6.1.3.1. Acidic Depressants
- 6.1.3.2. pH modifiers
- 6.1.3.3. Activators
- 6.1.3.4. Deactivators
- 6.1.4. Other Reagent Types
- 6.1.1. Collectors
- 6.2. Market Analysis, Insights and Forecast - by End-user Industry
- 6.2.1. Mining
- 6.2.2. Pulp and Paper
- 6.2.3. Industrial Waste and Sewage Treatment
- 6.2.4. Other End-user Industries
- 6.1. Market Analysis, Insights and Forecast - by Reagent Type
- 7. Asia Pacific Froth Flotation Chemical Market Analysis, Insights and Forecast, 2020-2032
- 7.1. Market Analysis, Insights and Forecast - by Reagent Type
- 7.1.1. Collectors
- 7.1.1.1. Cationic
- 7.1.1.2. Anionic
- 7.1.1.3. Non-ionic
- 7.1.2. Frothers
- 7.1.2.1. Acidic
- 7.1.2.2. Basic
- 7.1.2.3. Neutral
- 7.1.3. Modifiers
- 7.1.3.1. Acidic Depressants
- 7.1.3.2. pH modifiers
- 7.1.3.3. Activators
- 7.1.3.4. Deactivators
- 7.1.4. Other Reagent Types
- 7.1.1. Collectors
- 7.2. Market Analysis, Insights and Forecast - by End-user Industry
- 7.2.1. Mining
- 7.2.2. Pulp and Paper
- 7.2.3. Industrial Waste and Sewage Treatment
- 7.2.4. Other End-user Industries
- 7.1. Market Analysis, Insights and Forecast - by Reagent Type
- 8. North America Froth Flotation Chemical Market Analysis, Insights and Forecast, 2020-2032
- 8.1. Market Analysis, Insights and Forecast - by Reagent Type
- 8.1.1. Collectors
- 8.1.1.1. Cationic
- 8.1.1.2. Anionic
- 8.1.1.3. Non-ionic
- 8.1.2. Frothers
- 8.1.2.1. Acidic
- 8.1.2.2. Basic
- 8.1.2.3. Neutral
- 8.1.3. Modifiers
- 8.1.3.1. Acidic Depressants
- 8.1.3.2. pH modifiers
- 8.1.3.3. Activators
- 8.1.3.4. Deactivators
- 8.1.4. Other Reagent Types
- 8.1.1. Collectors
- 8.2. Market Analysis, Insights and Forecast - by End-user Industry
- 8.2.1. Mining
- 8.2.2. Pulp and Paper
- 8.2.3. Industrial Waste and Sewage Treatment
- 8.2.4. Other End-user Industries
- 8.1. Market Analysis, Insights and Forecast - by Reagent Type
- 9. Europe Froth Flotation Chemical Market Analysis, Insights and Forecast, 2020-2032
- 9.1. Market Analysis, Insights and Forecast - by Reagent Type
- 9.1.1. Collectors
- 9.1.1.1. Cationic
- 9.1.1.2. Anionic
- 9.1.1.3. Non-ionic
- 9.1.2. Frothers
- 9.1.2.1. Acidic
- 9.1.2.2. Basic
- 9.1.2.3. Neutral
- 9.1.3. Modifiers
- 9.1.3.1. Acidic Depressants
- 9.1.3.2. pH modifiers
- 9.1.3.3. Activators
- 9.1.3.4. Deactivators
- 9.1.4. Other Reagent Types
- 9.1.1. Collectors
- 9.2. Market Analysis, Insights and Forecast - by End-user Industry
- 9.2.1. Mining
- 9.2.2. Pulp and Paper
- 9.2.3. Industrial Waste and Sewage Treatment
- 9.2.4. Other End-user Industries
- 9.1. Market Analysis, Insights and Forecast - by Reagent Type
- 10. South America Froth Flotation Chemical Market Analysis, Insights and Forecast, 2020-2032
- 10.1. Market Analysis, Insights and Forecast - by Reagent Type
- 10.1.1. Collectors
- 10.1.1.1. Cationic
- 10.1.1.2. Anionic
- 10.1.1.3. Non-ionic
- 10.1.2. Frothers
- 10.1.2.1. Acidic
- 10.1.2.2. Basic
- 10.1.2.3. Neutral
- 10.1.3. Modifiers
- 10.1.3.1. Acidic Depressants
- 10.1.3.2. pH modifiers
- 10.1.3.3. Activators
- 10.1.3.4. Deactivators
- 10.1.4. Other Reagent Types
- 10.1.1. Collectors
- 10.2. Market Analysis, Insights and Forecast - by End-user Industry
- 10.2.1. Mining
- 10.2.2. Pulp and Paper
- 10.2.3. Industrial Waste and Sewage Treatment
- 10.2.4. Other End-user Industries
- 10.1. Market Analysis, Insights and Forecast - by Reagent Type
- 11. Middle East and Africa Froth Flotation Chemical Market Analysis, Insights and Forecast, 2020-2032
- 11.1. Market Analysis, Insights and Forecast - by Reagent Type
- 11.1.1. Collectors
- 11.1.1.1. Cationic
- 11.1.1.2. Anionic
- 11.1.1.3. Non-ionic
- 11.1.2. Frothers
- 11.1.2.1. Acidic
- 11.1.2.2. Basic
- 11.1.2.3. Neutral
- 11.1.3. Modifiers
- 11.1.3.1. Acidic Depressants
- 11.1.3.2. pH modifiers
- 11.1.3.3. Activators
- 11.1.3.4. Deactivators
- 11.1.4. Other Reagent Types
- 11.1.1. Collectors
- 11.2. Market Analysis, Insights and Forecast - by End-user Industry
- 11.2.1. Mining
- 11.2.2. Pulp and Paper
- 11.2.3. Industrial Waste and Sewage Treatment
- 11.2.4. Other End-user Industries
- 11.1. Market Analysis, Insights and Forecast - by Reagent Type
- 12. Competitive Analysis
- 12.1. Company Profiles
- 12.1.1 Arkema
- 12.1.1.1. Company Overview
- 12.1.1.2. Products
- 12.1.1.3. Company Financials
- 12.1.1.4. SWOT Analysis
- 12.1.2 Air Products and Chemicals Inc
- 12.1.2.1. Company Overview
- 12.1.2.2. Products
- 12.1.2.3. Company Financials
- 12.1.2.4. SWOT Analysis
- 12.1.3 Solvay
- 12.1.3.1. Company Overview
- 12.1.3.2. Products
- 12.1.3.3. Company Financials
- 12.1.3.4. SWOT Analysis
- 12.1.4 Chevron Phillips Chemical Company LLC
- 12.1.4.1. Company Overview
- 12.1.4.2. Products
- 12.1.4.3. Company Financials
- 12.1.4.4. SWOT Analysis
- 12.1.5 NASACO
- 12.1.5.1. Company Overview
- 12.1.5.2. Products
- 12.1.5.3. Company Financials
- 12.1.5.4. SWOT Analysis
- 12.1.6 Nouryon*List Not Exhaustive
- 12.1.6.1. Company Overview
- 12.1.6.2. Products
- 12.1.6.3. Company Financials
- 12.1.6.4. SWOT Analysis
- 12.1.7 BASF SE
- 12.1.7.1. Company Overview
- 12.1.7.2. Products
- 12.1.7.3. Company Financials
- 12.1.7.4. SWOT Analysis
- 12.1.8 Kemira
- 12.1.8.1. Company Overview
- 12.1.8.2. Products
- 12.1.8.3. Company Financials
- 12.1.8.4. SWOT Analysis
- 12.1.9 Dow
- 12.1.9.1. Company Overview
- 12.1.9.2. Products
- 12.1.9.3. Company Financials
- 12.1.9.4. SWOT Analysis
- 12.1.10 CLARIANT
- 12.1.10.1. Company Overview
- 12.1.10.2. Products
- 12.1.10.3. Company Financials
- 12.1.10.4. SWOT Analysis
- 12.1.1 Arkema
- 12.2. Market Entropy
- 12.2.1 Company's Key Areas Served
- 12.2.2 Recent Developments
- 12.3. Company Market Share Analysis 2025
- 12.3.1 Top 5 Companies Market Share Analysis
- 12.3.2 Top 3 Companies Market Share Analysis
- 12.4. List of Potential Customers
- 13. Research Methodology
List of Figures
- Figure 1: Global Froth Flotation Chemical Market Revenue Breakdown (Million, %) by Region 2025 & 2033
- Figure 2: Global Froth Flotation Chemical Market Volume Breakdown (K Tons, %) by Region 2025 & 2033
- Figure 3: Asia Pacific Froth Flotation Chemical Market Revenue (Million), by Reagent Type 2025 & 2033
- Figure 4: Asia Pacific Froth Flotation Chemical Market Volume (K Tons), by Reagent Type 2025 & 2033
- Figure 5: Asia Pacific Froth Flotation Chemical Market Revenue Share (%), by Reagent Type 2025 & 2033
- Figure 6: Asia Pacific Froth Flotation Chemical Market Volume Share (%), by Reagent Type 2025 & 2033
- Figure 7: Asia Pacific Froth Flotation Chemical Market Revenue (Million), by End-user Industry 2025 & 2033
- Figure 8: Asia Pacific Froth Flotation Chemical Market Volume (K Tons), by End-user Industry 2025 & 2033
- Figure 9: Asia Pacific Froth Flotation Chemical Market Revenue Share (%), by End-user Industry 2025 & 2033
- Figure 10: Asia Pacific Froth Flotation Chemical Market Volume Share (%), by End-user Industry 2025 & 2033
- Figure 11: Asia Pacific Froth Flotation Chemical Market Revenue (Million), by Country 2025 & 2033
- Figure 12: Asia Pacific Froth Flotation Chemical Market Volume (K Tons), by Country 2025 & 2033
- Figure 13: Asia Pacific Froth Flotation Chemical Market Revenue Share (%), by Country 2025 & 2033
- Figure 14: Asia Pacific Froth Flotation Chemical Market Volume Share (%), by Country 2025 & 2033
- Figure 15: North America Froth Flotation Chemical Market Revenue (Million), by Reagent Type 2025 & 2033
- Figure 16: North America Froth Flotation Chemical Market Volume (K Tons), by Reagent Type 2025 & 2033
- Figure 17: North America Froth Flotation Chemical Market Revenue Share (%), by Reagent Type 2025 & 2033
- Figure 18: North America Froth Flotation Chemical Market Volume Share (%), by Reagent Type 2025 & 2033
- Figure 19: North America Froth Flotation Chemical Market Revenue (Million), by End-user Industry 2025 & 2033
- Figure 20: North America Froth Flotation Chemical Market Volume (K Tons), by End-user Industry 2025 & 2033
- Figure 21: North America Froth Flotation Chemical Market Revenue Share (%), by End-user Industry 2025 & 2033
- Figure 22: North America Froth Flotation Chemical Market Volume Share (%), by End-user Industry 2025 & 2033
- Figure 23: North America Froth Flotation Chemical Market Revenue (Million), by Country 2025 & 2033
- Figure 24: North America Froth Flotation Chemical Market Volume (K Tons), by Country 2025 & 2033
- Figure 25: North America Froth Flotation Chemical Market Revenue Share (%), by Country 2025 & 2033
- Figure 26: North America Froth Flotation Chemical Market Volume Share (%), by Country 2025 & 2033
- Figure 27: Europe Froth Flotation Chemical Market Revenue (Million), by Reagent Type 2025 & 2033
- Figure 28: Europe Froth Flotation Chemical Market Volume (K Tons), by Reagent Type 2025 & 2033
- Figure 29: Europe Froth Flotation Chemical Market Revenue Share (%), by Reagent Type 2025 & 2033
- Figure 30: Europe Froth Flotation Chemical Market Volume Share (%), by Reagent Type 2025 & 2033
- Figure 31: Europe Froth Flotation Chemical Market Revenue (Million), by End-user Industry 2025 & 2033
- Figure 32: Europe Froth Flotation Chemical Market Volume (K Tons), by End-user Industry 2025 & 2033
- Figure 33: Europe Froth Flotation Chemical Market Revenue Share (%), by End-user Industry 2025 & 2033
- Figure 34: Europe Froth Flotation Chemical Market Volume Share (%), by End-user Industry 2025 & 2033
- Figure 35: Europe Froth Flotation Chemical Market Revenue (Million), by Country 2025 & 2033
- Figure 36: Europe Froth Flotation Chemical Market Volume (K Tons), by Country 2025 & 2033
- Figure 37: Europe Froth Flotation Chemical Market Revenue Share (%), by Country 2025 & 2033
- Figure 38: Europe Froth Flotation Chemical Market Volume Share (%), by Country 2025 & 2033
- Figure 39: South America Froth Flotation Chemical Market Revenue (Million), by Reagent Type 2025 & 2033
- Figure 40: South America Froth Flotation Chemical Market Volume (K Tons), by Reagent Type 2025 & 2033
- Figure 41: South America Froth Flotation Chemical Market Revenue Share (%), by Reagent Type 2025 & 2033
- Figure 42: South America Froth Flotation Chemical Market Volume Share (%), by Reagent Type 2025 & 2033
- Figure 43: South America Froth Flotation Chemical Market Revenue (Million), by End-user Industry 2025 & 2033
- Figure 44: South America Froth Flotation Chemical Market Volume (K Tons), by End-user Industry 2025 & 2033
- Figure 45: South America Froth Flotation Chemical Market Revenue Share (%), by End-user Industry 2025 & 2033
- Figure 46: South America Froth Flotation Chemical Market Volume Share (%), by End-user Industry 2025 & 2033
- Figure 47: South America Froth Flotation Chemical Market Revenue (Million), by Country 2025 & 2033
- Figure 48: South America Froth Flotation Chemical Market Volume (K Tons), by Country 2025 & 2033
- Figure 49: South America Froth Flotation Chemical Market Revenue Share (%), by Country 2025 & 2033
- Figure 50: South America Froth Flotation Chemical Market Volume Share (%), by Country 2025 & 2033
- Figure 51: Middle East and Africa Froth Flotation Chemical Market Revenue (Million), by Reagent Type 2025 & 2033
- Figure 52: Middle East and Africa Froth Flotation Chemical Market Volume (K Tons), by Reagent Type 2025 & 2033
- Figure 53: Middle East and Africa Froth Flotation Chemical Market Revenue Share (%), by Reagent Type 2025 & 2033
- Figure 54: Middle East and Africa Froth Flotation Chemical Market Volume Share (%), by Reagent Type 2025 & 2033
- Figure 55: Middle East and Africa Froth Flotation Chemical Market Revenue (Million), by End-user Industry 2025 & 2033
- Figure 56: Middle East and Africa Froth Flotation Chemical Market Volume (K Tons), by End-user Industry 2025 & 2033
- Figure 57: Middle East and Africa Froth Flotation Chemical Market Revenue Share (%), by End-user Industry 2025 & 2033
- Figure 58: Middle East and Africa Froth Flotation Chemical Market Volume Share (%), by End-user Industry 2025 & 2033
- Figure 59: Middle East and Africa Froth Flotation Chemical Market Revenue (Million), by Country 2025 & 2033
- Figure 60: Middle East and Africa Froth Flotation Chemical Market Volume (K Tons), by Country 2025 & 2033
- Figure 61: Middle East and Africa Froth Flotation Chemical Market Revenue Share (%), by Country 2025 & 2033
- Figure 62: Middle East and Africa Froth Flotation Chemical Market Volume Share (%), by Country 2025 & 2033
List of Tables
- Table 1: Global Froth Flotation Chemical Market Revenue Million Forecast, by Reagent Type 2020 & 2033
- Table 2: Global Froth Flotation Chemical Market Volume K Tons Forecast, by Reagent Type 2020 & 2033
- Table 3: Global Froth Flotation Chemical Market Revenue Million Forecast, by End-user Industry 2020 & 2033
- Table 4: Global Froth Flotation Chemical Market Volume K Tons Forecast, by End-user Industry 2020 & 2033
- Table 5: Global Froth Flotation Chemical Market Revenue Million Forecast, by Region 2020 & 2033
- Table 6: Global Froth Flotation Chemical Market Volume K Tons Forecast, by Region 2020 & 2033
- Table 7: Global Froth Flotation Chemical Market Revenue Million Forecast, by Reagent Type 2020 & 2033
- Table 8: Global Froth Flotation Chemical Market Volume K Tons Forecast, by Reagent Type 2020 & 2033
- Table 9: Global Froth Flotation Chemical Market Revenue Million Forecast, by End-user Industry 2020 & 2033
- Table 10: Global Froth Flotation Chemical Market Volume K Tons Forecast, by End-user Industry 2020 & 2033
- Table 11: Global Froth Flotation Chemical Market Revenue Million Forecast, by Country 2020 & 2033
- Table 12: Global Froth Flotation Chemical Market Volume K Tons Forecast, by Country 2020 & 2033
- Table 13: China Froth Flotation Chemical Market Revenue (Million) Forecast, by Application 2020 & 2033
- Table 14: China Froth Flotation Chemical Market Volume (K Tons) Forecast, by Application 2020 & 2033
- Table 15: India Froth Flotation Chemical Market Revenue (Million) Forecast, by Application 2020 & 2033
- Table 16: India Froth Flotation Chemical Market Volume (K Tons) Forecast, by Application 2020 & 2033
- Table 17: Japan Froth Flotation Chemical Market Revenue (Million) Forecast, by Application 2020 & 2033
- Table 18: Japan Froth Flotation Chemical Market Volume (K Tons) Forecast, by Application 2020 & 2033
- Table 19: South Korea Froth Flotation Chemical Market Revenue (Million) Forecast, by Application 2020 & 2033
- Table 20: South Korea Froth Flotation Chemical Market Volume (K Tons) Forecast, by Application 2020 & 2033
- Table 21: Rest of Asia Pacific Froth Flotation Chemical Market Revenue (Million) Forecast, by Application 2020 & 2033
- Table 22: Rest of Asia Pacific Froth Flotation Chemical Market Volume (K Tons) Forecast, by Application 2020 & 2033
- Table 23: Global Froth Flotation Chemical Market Revenue Million Forecast, by Reagent Type 2020 & 2033
- Table 24: Global Froth Flotation Chemical Market Volume K Tons Forecast, by Reagent Type 2020 & 2033
- Table 25: Global Froth Flotation Chemical Market Revenue Million Forecast, by End-user Industry 2020 & 2033
- Table 26: Global Froth Flotation Chemical Market Volume K Tons Forecast, by End-user Industry 2020 & 2033
- Table 27: Global Froth Flotation Chemical Market Revenue Million Forecast, by Country 2020 & 2033
- Table 28: Global Froth Flotation Chemical Market Volume K Tons Forecast, by Country 2020 & 2033
- Table 29: United States Froth Flotation Chemical Market Revenue (Million) Forecast, by Application 2020 & 2033
- Table 30: United States Froth Flotation Chemical Market Volume (K Tons) Forecast, by Application 2020 & 2033
- Table 31: Canada Froth Flotation Chemical Market Revenue (Million) Forecast, by Application 2020 & 2033
- Table 32: Canada Froth Flotation Chemical Market Volume (K Tons) Forecast, by Application 2020 & 2033
- Table 33: Mexico Froth Flotation Chemical Market Revenue (Million) Forecast, by Application 2020 & 2033
- Table 34: Mexico Froth Flotation Chemical Market Volume (K Tons) Forecast, by Application 2020 & 2033
- Table 35: Global Froth Flotation Chemical Market Revenue Million Forecast, by Reagent Type 2020 & 2033
- Table 36: Global Froth Flotation Chemical Market Volume K Tons Forecast, by Reagent Type 2020 & 2033
- Table 37: Global Froth Flotation Chemical Market Revenue Million Forecast, by End-user Industry 2020 & 2033
- Table 38: Global Froth Flotation Chemical Market Volume K Tons Forecast, by End-user Industry 2020 & 2033
- Table 39: Global Froth Flotation Chemical Market Revenue Million Forecast, by Country 2020 & 2033
- Table 40: Global Froth Flotation Chemical Market Volume K Tons Forecast, by Country 2020 & 2033
- Table 41: Germany Froth Flotation Chemical Market Revenue (Million) Forecast, by Application 2020 & 2033
- Table 42: Germany Froth Flotation Chemical Market Volume (K Tons) Forecast, by Application 2020 & 2033
- Table 43: United Kingdom Froth Flotation Chemical Market Revenue (Million) Forecast, by Application 2020 & 2033
- Table 44: United Kingdom Froth Flotation Chemical Market Volume (K Tons) Forecast, by Application 2020 & 2033
- Table 45: France Froth Flotation Chemical Market Revenue (Million) Forecast, by Application 2020 & 2033
- Table 46: France Froth Flotation Chemical Market Volume (K Tons) Forecast, by Application 2020 & 2033
- Table 47: Italy Froth Flotation Chemical Market Revenue (Million) Forecast, by Application 2020 & 2033
- Table 48: Italy Froth Flotation Chemical Market Volume (K Tons) Forecast, by Application 2020 & 2033
- Table 49: Rest of Europe Froth Flotation Chemical Market Revenue (Million) Forecast, by Application 2020 & 2033
- Table 50: Rest of Europe Froth Flotation Chemical Market Volume (K Tons) Forecast, by Application 2020 & 2033
- Table 51: Global Froth Flotation Chemical Market Revenue Million Forecast, by Reagent Type 2020 & 2033
- Table 52: Global Froth Flotation Chemical Market Volume K Tons Forecast, by Reagent Type 2020 & 2033
- Table 53: Global Froth Flotation Chemical Market Revenue Million Forecast, by End-user Industry 2020 & 2033
- Table 54: Global Froth Flotation Chemical Market Volume K Tons Forecast, by End-user Industry 2020 & 2033
- Table 55: Global Froth Flotation Chemical Market Revenue Million Forecast, by Country 2020 & 2033
- Table 56: Global Froth Flotation Chemical Market Volume K Tons Forecast, by Country 2020 & 2033
- Table 57: Brazil Froth Flotation Chemical Market Revenue (Million) Forecast, by Application 2020 & 2033
- Table 58: Brazil Froth Flotation Chemical Market Volume (K Tons) Forecast, by Application 2020 & 2033
- Table 59: Argentina Froth Flotation Chemical Market Revenue (Million) Forecast, by Application 2020 & 2033
- Table 60: Argentina Froth Flotation Chemical Market Volume (K Tons) Forecast, by Application 2020 & 2033
- Table 61: Rest of South America Froth Flotation Chemical Market Revenue (Million) Forecast, by Application 2020 & 2033
- Table 62: Rest of South America Froth Flotation Chemical Market Volume (K Tons) Forecast, by Application 2020 & 2033
- Table 63: Global Froth Flotation Chemical Market Revenue Million Forecast, by Reagent Type 2020 & 2033
- Table 64: Global Froth Flotation Chemical Market Volume K Tons Forecast, by Reagent Type 2020 & 2033
- Table 65: Global Froth Flotation Chemical Market Revenue Million Forecast, by End-user Industry 2020 & 2033
- Table 66: Global Froth Flotation Chemical Market Volume K Tons Forecast, by End-user Industry 2020 & 2033
- Table 67: Global Froth Flotation Chemical Market Revenue Million Forecast, by Country 2020 & 2033
- Table 68: Global Froth Flotation Chemical Market Volume K Tons Forecast, by Country 2020 & 2033
- Table 69: Saudi Arabia Froth Flotation Chemical Market Revenue (Million) Forecast, by Application 2020 & 2033
- Table 70: Saudi Arabia Froth Flotation Chemical Market Volume (K Tons) Forecast, by Application 2020 & 2033
- Table 71: South Africa Froth Flotation Chemical Market Revenue (Million) Forecast, by Application 2020 & 2033
- Table 72: South Africa Froth Flotation Chemical Market Volume (K Tons) Forecast, by Application 2020 & 2033
- Table 73: Rest of Middle East and Africa Froth Flotation Chemical Market Revenue (Million) Forecast, by Application 2020 & 2033
- Table 74: Rest of Middle East and Africa Froth Flotation Chemical Market Volume (K Tons) Forecast, by Application 2020 & 2033
Frequently Asked Questions
1. What is the projected Compound Annual Growth Rate (CAGR) of the Froth Flotation Chemical Market?
The projected CAGR is approximately > 4.50%.
2. Which companies are prominent players in the Froth Flotation Chemical Market?
Key companies in the market include Arkema, Air Products and Chemicals Inc, Solvay, Chevron Phillips Chemical Company LLC, NASACO, Nouryon*List Not Exhaustive, BASF SE, Kemira, Dow, CLARIANT.
3. What are the main segments of the Froth Flotation Chemical Market?
The market segments include Reagent Type, End-user Industry.
4. Can you provide details about the market size?
The market size is estimated to be USD 1741.2 Million as of 2022.
5. What are some drivers contributing to market growth?
Rising Demand for Froth Flotation Chemicals in Asia-Pacific; Increasing Mining Activities in Canada and Mexico; Other Drivers.
6. What are the notable trends driving market growth?
Rising Demand from the Mining Industry.
7. Are there any restraints impacting market growth?
Stringent Policies and Changing Regulatory Landscape Exist in North America and Europe; Other Restraints.
8. Can you provide examples of recent developments in the market?
October 2022: Solvay launched a digital mining solution, 'SmartFloat,' an AI-based reagent optimization system. It helps mining companies capture more value from their data and optimize froth flotation processes.
9. What pricing options are available for accessing the report?
Pricing options include single-user, multi-user, and enterprise licenses priced at USD 4750, USD 5250, and USD 8750 respectively.
10. Is the market size provided in terms of value or volume?
The market size is provided in terms of value, measured in Million and volume, measured in K Tons.
11. Are there any specific market keywords associated with the report?
Yes, the market keyword associated with the report is "Froth Flotation Chemical Market," which aids in identifying and referencing the specific market segment covered.
12. How do I determine which pricing option suits my needs best?
The pricing options vary based on user requirements and access needs. Individual users may opt for single-user licenses, while businesses requiring broader access may choose multi-user or enterprise licenses for cost-effective access to the report.
13. Are there any additional resources or data provided in the Froth Flotation Chemical Market report?
While the report offers comprehensive insights, it's advisable to review the specific contents or supplementary materials provided to ascertain if additional resources or data are available.
14. How can I stay updated on further developments or reports in the Froth Flotation Chemical Market?
To stay informed about further developments, trends, and reports in the Froth Flotation Chemical Market, consider subscribing to industry newsletters, following relevant companies and organizations, or regularly checking reputable industry news sources and publications.
Methodology
Step 1 - Identification of Relevant Samples Size from Population Database


Step 2 - Approaches for Defining Global Market Size (Value, Volume* & Price*)

Note*: In applicable scenarios
Step 3 - Data Sources
Primary Research
- Web Analytics
- Survey Reports
- Research Institute
- Latest Research Reports
- Opinion Leaders
Secondary Research
- Annual Reports
- White Paper
- Latest Press Release
- Industry Association
- Paid Database
- Investor Presentations

Step 4 - Data Triangulation
Involves using different sources of information in order to increase the validity of a study
These sources are likely to be stakeholders in a program - participants, other researchers, program staff, other community members, and so on.
Then we put all data in single framework & apply various statistical tools to find out the dynamic on the market.
During the analysis stage, feedback from the stakeholder groups would be compared to determine areas of agreement as well as areas of divergence