

Key Insights
The MEA plastic packaging market, exhibiting a robust CAGR of 6.54%, presents significant growth opportunities. Driven by factors such as increasing urbanization, rising disposable incomes leading to higher consumption of packaged goods, and a burgeoning food and beverage sector, the market is poised for expansion. The preference for convenient and safe packaging solutions across various end-user industries, including food, beverages, healthcare, and cosmetics, fuels this growth. While the dominance of polyethylene (PE) and polyethylene terephthalate (PET) is evident, the market is witnessing a gradual shift towards sustainable and eco-friendly alternatives due to growing environmental concerns. This trend is likely to influence material choices in the coming years, potentially impacting the growth of traditional plastic types. Furthermore, technological advancements in packaging design and manufacturing are contributing to improved product shelf life and enhanced consumer experience, driving market growth. The regional distribution of the market likely reflects the varying economic development and industrialization levels across the MEA region, with countries like Saudi Arabia and the UAE potentially leading the growth. Competition is moderately intense with both local and international players vying for market share. However, the market is also characterized by a presence of smaller, regionally focused players, often specialized in niche segments.
The forecast period (2025-2033) expects continued growth, albeit potentially at a slightly moderated pace compared to the historical period (2019-2024). Factors such as fluctuating oil prices (impacting raw material costs) and government regulations promoting sustainable packaging practices could influence the growth trajectory. The segment breakdown indicates a substantial share held by rigid packaging types, reflecting the demand for sturdy packaging solutions for various products. Further analysis focusing on specific segments within the MEA region (e.g., Saudi Arabia's food packaging market) would provide even greater insight into growth drivers and opportunities within the diverse landscape. The market is ripe for innovation with opportunities for players focusing on sustainable packaging, advanced materials, and efficient supply chain solutions.

MEA Plastic Packaging Industry: A Comprehensive Market Report (2019-2033)
This comprehensive report provides a detailed analysis of the Middle East and Africa (MEA) plastic packaging industry, offering invaluable insights for stakeholders across the value chain. From market size and growth projections to key players and emerging trends, this study covers all essential aspects of this dynamic sector. With a study period spanning 2019-2033, a base year of 2025, and a forecast period of 2025-2033, this report is an indispensable resource for strategic decision-making. The market is segmented by product type (Bottles and Jars, Tubs, Cups, Bowls, and Trays, Intermediate Bulk Containers, Pouches, Other Products), packaging type (Rigid, Flexible), material (Polyethylene (PE), Polyethylene Terephthalate (PET), Polypropylene (PP), Polystyrene (PS) and Expanded Polystyrene (EPS), Polyvinyl Chloride (PVC), Polyethene (PE), Bi-orientated Polypropylene (BOPP), Cast Polypropylene (CPP), Polyvinyl Chloride (PVC), Other Flexible Plastic Packaging Materials), and end-user industry (Food, Beverage, Healthcare and Pharmaceutical, Cosmetics and Personal Care, Other End-user Industries). Key players analyzed include KANR For Plastic Industries, Al Nawakheth Factory Company, Arabian Plastics Industrial Company Limited (APICO), Napco Group (Napco National), SABIC - Saudi Basic Industries Corporation, Zamil Plastic Industries Co, Sealed Air Corporation (Sealed Air Saudi Arabia), Takween Advanced Industries, AL-Ghandoura Co Manuf Plastic (GhanPlast), Saudi Arabian Packaging Industry WLL (SAPIN), Saudi Plastic Factory Company, Arnon Plastic Industry Co Ltd, Plastico SPS, Coloredsun, National Plastic Factory LLC, and Packaging Products Company (PPC). The report projects a market value of xx Million by 2033.
MEA Plastic Packaging Industry Market Concentration & Dynamics
The MEA plastic packaging market exhibits a moderately concentrated structure, with several large players holding significant market share. However, a considerable number of smaller, regional players also contribute significantly, particularly in niche segments. The market is characterized by a dynamic innovation ecosystem, with ongoing research and development focused on sustainable and recyclable materials. Regulatory frameworks vary across the MEA region, with increasing emphasis on environmental regulations related to plastic waste management. Substitute products, such as paper and biodegradable materials, are gaining traction, although plastic continues to dominate due to its cost-effectiveness and versatility. End-user trends indicate a growing preference for convenient and sustainable packaging solutions. M&A activity has been moderate in recent years, with xx deals recorded between 2019 and 2024.
- Market Share: Top 5 players hold approximately xx% of the market share.
- M&A Activity: xx deals recorded between 2019 and 2024, indicating a moderate level of consolidation.
- Innovation: Focus on biodegradable and recyclable materials, lightweighting, and improved barrier properties.
- Regulatory Landscape: Increasing focus on plastic waste reduction and recycling mandates.
MEA Plastic Packaging Industry Industry Insights & Trends
The MEA plastic packaging market is experiencing robust growth, driven by factors such as rising disposable incomes, rapid urbanization, and expanding consumer base. The market size was valued at xx Million in 2024 and is projected to reach xx Million by 2033, registering a CAGR of xx% during the forecast period. Technological advancements, including the adoption of automation in packaging processes and the development of innovative materials, are further propelling market expansion. Changing consumer preferences, including a growing demand for sustainable and eco-friendly packaging solutions, are influencing industry dynamics. E-commerce growth significantly impacts demand for suitable packaging solutions for online deliveries. The rising adoption of flexible packaging, particularly in food and beverage, further boosts the market growth. The market faces challenges such as fluctuating raw material prices and increasing concerns about environmental sustainability, necessitating the development of innovative solutions and responsible production practices.

Key Markets & Segments Leading MEA Plastic Packaging Industry
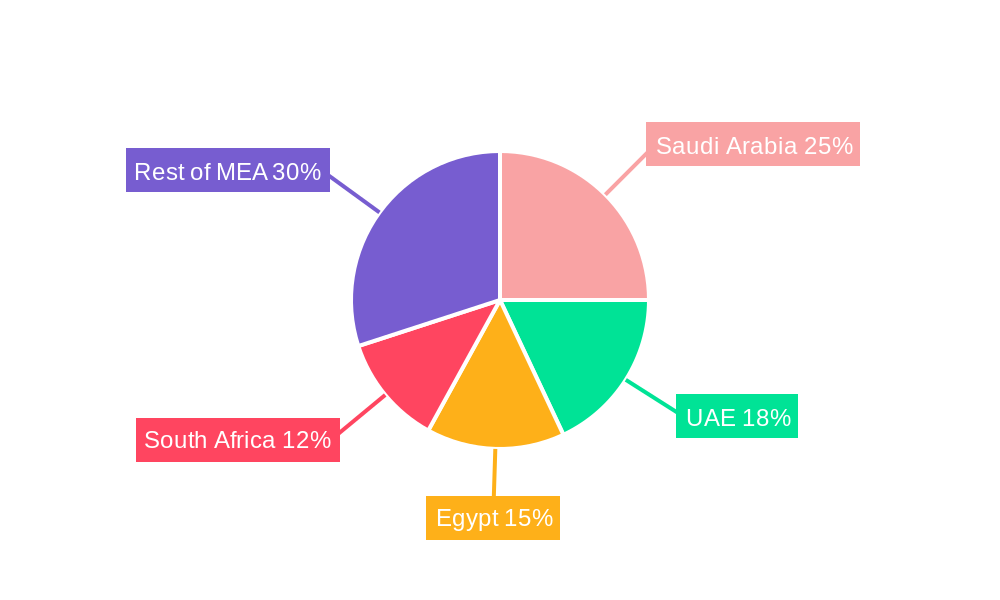
The food and beverage sector remains the dominant end-user industry for plastic packaging in the MEA region, accounting for approximately xx% of the overall market in 2024. Within product types, bottles and jars represent the largest segment, driven by the significant demand from the beverage industry. The flexible packaging type is growing at the fastest rate, propelled by its versatility and convenience. Polyethylene (PE) and Polyethylene Terephthalate (PET) are the most widely used materials, owing to their cost-effectiveness and suitability for diverse applications. The GCC region, particularly Saudi Arabia and the UAE, represents the largest market within the MEA region.
- Growth Drivers:
- Rapid economic growth and rising disposable incomes.
- Increasing urbanization and population growth.
- Expanding food and beverage industry.
- Growing e-commerce sector.
- Technological advancements in packaging materials and processes.
MEA Plastic Packaging Industry Product Developments
Recent product innovations in the MEA plastic packaging market focus on lightweighting, improved barrier properties, and enhanced sustainability. The development of biodegradable and compostable plastic alternatives is gaining momentum, driven by growing environmental concerns. Companies are increasingly exploring advanced technologies such as active and intelligent packaging to enhance product preservation and extend shelf life. These advancements are aimed at providing consumers with superior packaging solutions while mitigating the environmental impact of plastic waste. Competition is driving innovation as companies seek to develop unique and value-added packaging solutions to capture market share.
Challenges in the MEA Plastic Packaging Industry Market
The MEA plastic packaging industry faces significant challenges, including increasing raw material prices, supply chain disruptions, and stringent environmental regulations. Fluctuating oil prices impact the cost of plastic resins, leading to price volatility in the market. Logistics challenges and infrastructure limitations in some parts of the region contribute to supply chain disruptions. The growing emphasis on environmental sustainability necessitates investments in recycling infrastructure and the development of more sustainable packaging solutions. These factors can significantly impact profitability and overall market growth. Increased competition from both domestic and international players creates pressure on pricing and margins.
Forces Driving MEA Plastic Packaging Industry Growth
Several factors drive the growth of the MEA plastic packaging industry. Technological advancements such as automation and the development of innovative materials are improving efficiency and creating new opportunities. Economic growth in the region is fueling demand across various end-user industries. Favorable government policies and initiatives promoting industrial development are creating a conducive business environment. The growing adoption of e-commerce is driving demand for suitable packaging solutions for online deliveries.
Challenges in the MEA Plastic Packaging Industry Market
Long-term growth catalysts include the increasing adoption of sustainable packaging solutions, strategic partnerships to improve supply chain efficiency, and expansion into new markets within the MEA region. The development and commercialization of biodegradable and recyclable plastic alternatives will be crucial for sustainable growth. Collaboration between industry players, research institutions, and government agencies will be critical for advancing sustainable practices and overcoming environmental challenges. Market expansion into rapidly growing economies within the MEA region will also offer significant growth opportunities.
Emerging Opportunities in MEA Plastic Packaging Industry
Emerging opportunities include the rising demand for sustainable and eco-friendly packaging solutions, the growth of e-commerce and its associated packaging needs, and the expansion of the food and beverage industry in the MEA region. The adoption of smart packaging technologies to enhance product traceability and shelf life management represents a significant opportunity. Investing in recycling infrastructure and promoting circular economy principles will be key to realizing sustainable growth and mitigating the environmental impact of plastic waste. New materials such as bioplastics and paper-based alternatives will play a crucial role in the transition towards more sustainable packaging practices.
Leading Players in the MEA Plastic Packaging Industry Sector
- KANR For Plastic Industries
- Al Nawakheth Factory Company
- Arabian Plastics Industrial Company Limited (APICO)
- Napco Group (Napco National)
- SABIC - Saudi Basic Industries Corporation
- Zamil Plastic Industries Co
- Sealed Air Corporation (Sealed Air Saudi Arabia)
- Takween Advanced Industries
- AL-Ghandoura Co Manuf Plastic (GhanPlast)
- Saudi Arabian Packaging Industry WLL (SAPIN)
- Saudi Plastic Factory Company
- Arnon Plastic Industry Co Ltd
- Plastico SPS
- Coloredsun
- National Plastic Factory LLC
- Packaging Products Company (PPC)
Key Milestones in MEA Plastic Packaging Industry Industry
- June 2022: SABIC's collaboration with Heinz, Tesco, and Berry on a UK recycling trial showcasing closed-loop recycling of soft plastic food packaging, creating certified circular polypropylene (PP) for Heinz Beanz Snap Pots. This highlights a significant move towards sustainable packaging practices within the industry.
Strategic Outlook for MEA Plastic Packaging Industry Market
The MEA plastic packaging market is poised for continued growth, driven by a combination of factors such as expanding consumer base, rising disposable incomes, and increasing demand for convenient packaging solutions. Strategic investments in sustainable packaging technologies, supply chain optimization, and capacity expansion will be crucial for capturing market share and ensuring long-term success. Companies that focus on innovation, sustainability, and customer-centric solutions will be best positioned to capitalize on the growth opportunities presented by this dynamic market.
MEA Plastic Packaging Industry Segmentation
-
1. Packaging Type
-
1.1. Rigid
-
1.1.1. By Material
- 1.1.1.1. Polyethylene (PE)
- 1.1.1.2. Polyethylene Terephthalate (PET)
- 1.1.1.3. Polypropylene (PP)
- 1.1.1.4. Polystyrene (PS) and Expanded Polystyrene (EPS)
- 1.1.1.5. Polyvinyl Chloride (PVC)
-
1.1.2. By End-user Industry
- 1.1.2.1. Food
- 1.1.2.2. Beverage
- 1.1.2.3. Healthcare and Pharmaceutical
- 1.1.2.4. Cosmetics and Personal Care
- 1.1.2.5. Other End-user Industries
-
1.1.1. By Material
-
1.2. Flexible
- 1.2.1. Polyethene (PE)
- 1.2.2. Bi-orientated Polypropylene (BOPP)
- 1.2.3. Cast Polypropylene (CPP)
- 1.2.4. Other Flexible Plastic Packaging Materials
-
1.1. Rigid
-
2. Product
- 2.1. Bottles and Jars
- 2.2. Tubs, Cups, Bowls, and Trays
- 2.3. Intermediate Bulk Containers
- 2.4. Pouches
- 2.5. Other Products
-
3. Geography
- 3.1. United Arab Emirates
- 3.2. Saudi Arabia
- 3.3. Egypt
- 3.4. South Africa
- 3.5. Rest of Middle East and Africa
MEA Plastic Packaging Industry Segmentation By Geography
- 1. United Arab Emirates
- 2. Saudi Arabia
- 3. Egypt
- 4. South Africa
- 5. Rest of Middle East and Africa
MEA Plastic Packaging Industry REPORT HIGHLIGHTS
| Aspects | Details |
|---|---|
| Study Period | 2019-2033 |
| Base Year | 2024 |
| Estimated Year | 2025 |
| Forecast Period | 2025-2033 |
| Historical Period | 2019-2024 |
| Growth Rate | CAGR of 6.54% from 2019-2033 |
| Segmentation |
|
Table of Contents
- 1. Introduction
- 1.1. Research Scope
- 1.2. Market Segmentation
- 1.3. Research Methodology
- 1.4. Definitions and Assumptions
- 2. Executive Summary
- 2.1. Introduction
- 3. Market Dynamics
- 3.1. Introduction
- 3.2. Market Drivers
- 3.2.1. Demand for Oxo-Degradable Plastics
- 3.3. Market Restrains
- 3.3.1. Environmental Concerns Over Recycling and Safe Disposal and Price Volatility of Raw Materials
- 3.4. Market Trends
- 3.4.1. Flexible Packaging is Expected to Witness Significant Growth
- 4. Market Factor Analysis
- 4.1. Porters Five Forces
- 4.2. Supply/Value Chain
- 4.3. PESTEL analysis
- 4.4. Market Entropy
- 4.5. Patent/Trademark Analysis
- 5. Global MEA Plastic Packaging Industry Analysis, Insights and Forecast, 2019-2031
- 5.1. Market Analysis, Insights and Forecast - by Packaging Type
- 5.1.1. Rigid
- 5.1.1.1. By Material
- 5.1.1.1.1. Polyethylene (PE)
- 5.1.1.1.2. Polyethylene Terephthalate (PET)
- 5.1.1.1.3. Polypropylene (PP)
- 5.1.1.1.4. Polystyrene (PS) and Expanded Polystyrene (EPS)
- 5.1.1.1.5. Polyvinyl Chloride (PVC)
- 5.1.1.2. By End-user Industry
- 5.1.1.2.1. Food
- 5.1.1.2.2. Beverage
- 5.1.1.2.3. Healthcare and Pharmaceutical
- 5.1.1.2.4. Cosmetics and Personal Care
- 5.1.1.2.5. Other End-user Industries
- 5.1.1.1. By Material
- 5.1.2. Flexible
- 5.1.2.1. Polyethene (PE)
- 5.1.2.2. Bi-orientated Polypropylene (BOPP)
- 5.1.2.3. Cast Polypropylene (CPP)
- 5.1.2.4. Other Flexible Plastic Packaging Materials
- 5.1.1. Rigid
- 5.2. Market Analysis, Insights and Forecast - by Product
- 5.2.1. Bottles and Jars
- 5.2.2. Tubs, Cups, Bowls, and Trays
- 5.2.3. Intermediate Bulk Containers
- 5.2.4. Pouches
- 5.2.5. Other Products
- 5.3. Market Analysis, Insights and Forecast - by Geography
- 5.3.1. United Arab Emirates
- 5.3.2. Saudi Arabia
- 5.3.3. Egypt
- 5.3.4. South Africa
- 5.3.5. Rest of Middle East and Africa
- 5.4. Market Analysis, Insights and Forecast - by Region
- 5.4.1. United Arab Emirates
- 5.4.2. Saudi Arabia
- 5.4.3. Egypt
- 5.4.4. South Africa
- 5.4.5. Rest of Middle East and Africa
- 5.1. Market Analysis, Insights and Forecast - by Packaging Type
- 6. United Arab Emirates MEA Plastic Packaging Industry Analysis, Insights and Forecast, 2019-2031
- 6.1. Market Analysis, Insights and Forecast - by Packaging Type
- 6.1.1. Rigid
- 6.1.1.1. By Material
- 6.1.1.1.1. Polyethylene (PE)
- 6.1.1.1.2. Polyethylene Terephthalate (PET)
- 6.1.1.1.3. Polypropylene (PP)
- 6.1.1.1.4. Polystyrene (PS) and Expanded Polystyrene (EPS)
- 6.1.1.1.5. Polyvinyl Chloride (PVC)
- 6.1.1.2. By End-user Industry
- 6.1.1.2.1. Food
- 6.1.1.2.2. Beverage
- 6.1.1.2.3. Healthcare and Pharmaceutical
- 6.1.1.2.4. Cosmetics and Personal Care
- 6.1.1.2.5. Other End-user Industries
- 6.1.1.1. By Material
- 6.1.2. Flexible
- 6.1.2.1. Polyethene (PE)
- 6.1.2.2. Bi-orientated Polypropylene (BOPP)
- 6.1.2.3. Cast Polypropylene (CPP)
- 6.1.2.4. Other Flexible Plastic Packaging Materials
- 6.1.1. Rigid
- 6.2. Market Analysis, Insights and Forecast - by Product
- 6.2.1. Bottles and Jars
- 6.2.2. Tubs, Cups, Bowls, and Trays
- 6.2.3. Intermediate Bulk Containers
- 6.2.4. Pouches
- 6.2.5. Other Products
- 6.3. Market Analysis, Insights and Forecast - by Geography
- 6.3.1. United Arab Emirates
- 6.3.2. Saudi Arabia
- 6.3.3. Egypt
- 6.3.4. South Africa
- 6.3.5. Rest of Middle East and Africa
- 6.1. Market Analysis, Insights and Forecast - by Packaging Type
- 7. Saudi Arabia MEA Plastic Packaging Industry Analysis, Insights and Forecast, 2019-2031
- 7.1. Market Analysis, Insights and Forecast - by Packaging Type
- 7.1.1. Rigid
- 7.1.1.1. By Material
- 7.1.1.1.1. Polyethylene (PE)
- 7.1.1.1.2. Polyethylene Terephthalate (PET)
- 7.1.1.1.3. Polypropylene (PP)
- 7.1.1.1.4. Polystyrene (PS) and Expanded Polystyrene (EPS)
- 7.1.1.1.5. Polyvinyl Chloride (PVC)
- 7.1.1.2. By End-user Industry
- 7.1.1.2.1. Food
- 7.1.1.2.2. Beverage
- 7.1.1.2.3. Healthcare and Pharmaceutical
- 7.1.1.2.4. Cosmetics and Personal Care
- 7.1.1.2.5. Other End-user Industries
- 7.1.1.1. By Material
- 7.1.2. Flexible
- 7.1.2.1. Polyethene (PE)
- 7.1.2.2. Bi-orientated Polypropylene (BOPP)
- 7.1.2.3. Cast Polypropylene (CPP)
- 7.1.2.4. Other Flexible Plastic Packaging Materials
- 7.1.1. Rigid
- 7.2. Market Analysis, Insights and Forecast - by Product
- 7.2.1. Bottles and Jars
- 7.2.2. Tubs, Cups, Bowls, and Trays
- 7.2.3. Intermediate Bulk Containers
- 7.2.4. Pouches
- 7.2.5. Other Products
- 7.3. Market Analysis, Insights and Forecast - by Geography
- 7.3.1. United Arab Emirates
- 7.3.2. Saudi Arabia
- 7.3.3. Egypt
- 7.3.4. South Africa
- 7.3.5. Rest of Middle East and Africa
- 7.1. Market Analysis, Insights and Forecast - by Packaging Type
- 8. Egypt MEA Plastic Packaging Industry Analysis, Insights and Forecast, 2019-2031
- 8.1. Market Analysis, Insights and Forecast - by Packaging Type
- 8.1.1. Rigid
- 8.1.1.1. By Material
- 8.1.1.1.1. Polyethylene (PE)
- 8.1.1.1.2. Polyethylene Terephthalate (PET)
- 8.1.1.1.3. Polypropylene (PP)
- 8.1.1.1.4. Polystyrene (PS) and Expanded Polystyrene (EPS)
- 8.1.1.1.5. Polyvinyl Chloride (PVC)
- 8.1.1.2. By End-user Industry
- 8.1.1.2.1. Food
- 8.1.1.2.2. Beverage
- 8.1.1.2.3. Healthcare and Pharmaceutical
- 8.1.1.2.4. Cosmetics and Personal Care
- 8.1.1.2.5. Other End-user Industries
- 8.1.1.1. By Material
- 8.1.2. Flexible
- 8.1.2.1. Polyethene (PE)
- 8.1.2.2. Bi-orientated Polypropylene (BOPP)
- 8.1.2.3. Cast Polypropylene (CPP)
- 8.1.2.4. Other Flexible Plastic Packaging Materials
- 8.1.1. Rigid
- 8.2. Market Analysis, Insights and Forecast - by Product
- 8.2.1. Bottles and Jars
- 8.2.2. Tubs, Cups, Bowls, and Trays
- 8.2.3. Intermediate Bulk Containers
- 8.2.4. Pouches
- 8.2.5. Other Products
- 8.3. Market Analysis, Insights and Forecast - by Geography
- 8.3.1. United Arab Emirates
- 8.3.2. Saudi Arabia
- 8.3.3. Egypt
- 8.3.4. South Africa
- 8.3.5. Rest of Middle East and Africa
- 8.1. Market Analysis, Insights and Forecast - by Packaging Type
- 9. South Africa MEA Plastic Packaging Industry Analysis, Insights and Forecast, 2019-2031
- 9.1. Market Analysis, Insights and Forecast - by Packaging Type
- 9.1.1. Rigid
- 9.1.1.1. By Material
- 9.1.1.1.1. Polyethylene (PE)
- 9.1.1.1.2. Polyethylene Terephthalate (PET)
- 9.1.1.1.3. Polypropylene (PP)
- 9.1.1.1.4. Polystyrene (PS) and Expanded Polystyrene (EPS)
- 9.1.1.1.5. Polyvinyl Chloride (PVC)
- 9.1.1.2. By End-user Industry
- 9.1.1.2.1. Food
- 9.1.1.2.2. Beverage
- 9.1.1.2.3. Healthcare and Pharmaceutical
- 9.1.1.2.4. Cosmetics and Personal Care
- 9.1.1.2.5. Other End-user Industries
- 9.1.1.1. By Material
- 9.1.2. Flexible
- 9.1.2.1. Polyethene (PE)
- 9.1.2.2. Bi-orientated Polypropylene (BOPP)
- 9.1.2.3. Cast Polypropylene (CPP)
- 9.1.2.4. Other Flexible Plastic Packaging Materials
- 9.1.1. Rigid
- 9.2. Market Analysis, Insights and Forecast - by Product
- 9.2.1. Bottles and Jars
- 9.2.2. Tubs, Cups, Bowls, and Trays
- 9.2.3. Intermediate Bulk Containers
- 9.2.4. Pouches
- 9.2.5. Other Products
- 9.3. Market Analysis, Insights and Forecast - by Geography
- 9.3.1. United Arab Emirates
- 9.3.2. Saudi Arabia
- 9.3.3. Egypt
- 9.3.4. South Africa
- 9.3.5. Rest of Middle East and Africa
- 9.1. Market Analysis, Insights and Forecast - by Packaging Type
- 10. Rest of Middle East and Africa MEA Plastic Packaging Industry Analysis, Insights and Forecast, 2019-2031
- 10.1. Market Analysis, Insights and Forecast - by Packaging Type
- 10.1.1. Rigid
- 10.1.1.1. By Material
- 10.1.1.1.1. Polyethylene (PE)
- 10.1.1.1.2. Polyethylene Terephthalate (PET)
- 10.1.1.1.3. Polypropylene (PP)
- 10.1.1.1.4. Polystyrene (PS) and Expanded Polystyrene (EPS)
- 10.1.1.1.5. Polyvinyl Chloride (PVC)
- 10.1.1.2. By End-user Industry
- 10.1.1.2.1. Food
- 10.1.1.2.2. Beverage
- 10.1.1.2.3. Healthcare and Pharmaceutical
- 10.1.1.2.4. Cosmetics and Personal Care
- 10.1.1.2.5. Other End-user Industries
- 10.1.1.1. By Material
- 10.1.2. Flexible
- 10.1.2.1. Polyethene (PE)
- 10.1.2.2. Bi-orientated Polypropylene (BOPP)
- 10.1.2.3. Cast Polypropylene (CPP)
- 10.1.2.4. Other Flexible Plastic Packaging Materials
- 10.1.1. Rigid
- 10.2. Market Analysis, Insights and Forecast - by Product
- 10.2.1. Bottles and Jars
- 10.2.2. Tubs, Cups, Bowls, and Trays
- 10.2.3. Intermediate Bulk Containers
- 10.2.4. Pouches
- 10.2.5. Other Products
- 10.3. Market Analysis, Insights and Forecast - by Geography
- 10.3.1. United Arab Emirates
- 10.3.2. Saudi Arabia
- 10.3.3. Egypt
- 10.3.4. South Africa
- 10.3.5. Rest of Middle East and Africa
- 10.1. Market Analysis, Insights and Forecast - by Packaging Type
- 11. North America MEA Plastic Packaging Industry Analysis, Insights and Forecast, 2019-2031
- 11.1. Market Analysis, Insights and Forecast - By Country/Sub-region
- 11.1.1 United States
- 11.1.2 Canada
- 11.1.3 Mexico
- 12. Europe MEA Plastic Packaging Industry Analysis, Insights and Forecast, 2019-2031
- 12.1. Market Analysis, Insights and Forecast - By Country/Sub-region
- 12.1.1 Germany
- 12.1.2 United Kingdom
- 12.1.3 France
- 12.1.4 Spain
- 12.1.5 Italy
- 12.1.6 Spain
- 12.1.7 Belgium
- 12.1.8 Netherland
- 12.1.9 Nordics
- 12.1.10 Rest of Europe
- 13. Asia Pacific MEA Plastic Packaging Industry Analysis, Insights and Forecast, 2019-2031
- 13.1. Market Analysis, Insights and Forecast - By Country/Sub-region
- 13.1.1 China
- 13.1.2 Japan
- 13.1.3 India
- 13.1.4 South Korea
- 13.1.5 Southeast Asia
- 13.1.6 Australia
- 13.1.7 Indonesia
- 13.1.8 Phillipes
- 13.1.9 Singapore
- 13.1.10 Thailandc
- 13.1.11 Rest of Asia Pacific
- 14. South America MEA Plastic Packaging Industry Analysis, Insights and Forecast, 2019-2031
- 14.1. Market Analysis, Insights and Forecast - By Country/Sub-region
- 14.1.1 Brazil
- 14.1.2 Argentina
- 14.1.3 Peru
- 14.1.4 Chile
- 14.1.5 Colombia
- 14.1.6 Ecuador
- 14.1.7 Venezuela
- 14.1.8 Rest of South America
- 15. North America MEA Plastic Packaging Industry Analysis, Insights and Forecast, 2019-2031
- 15.1. Market Analysis, Insights and Forecast - By Country/Sub-region
- 15.1.1 United States
- 15.1.2 Canada
- 15.1.3 Mexico
- 16. MEA MEA Plastic Packaging Industry Analysis, Insights and Forecast, 2019-2031
- 16.1. Market Analysis, Insights and Forecast - By Country/Sub-region
- 16.1.1 United Arab Emirates
- 16.1.2 Saudi Arabia
- 16.1.3 South Africa
- 16.1.4 Rest of Middle East and Africa
- 17. Competitive Analysis
- 17.1. Global Market Share Analysis 2024
- 17.2. Company Profiles
- 17.2.1 KANR For Plastic Industries
- 17.2.1.1. Overview
- 17.2.1.2. Products
- 17.2.1.3. SWOT Analysis
- 17.2.1.4. Recent Developments
- 17.2.1.5. Financials (Based on Availability)
- 17.2.2 Al Nawakheth Factory Company
- 17.2.2.1. Overview
- 17.2.2.2. Products
- 17.2.2.3. SWOT Analysis
- 17.2.2.4. Recent Developments
- 17.2.2.5. Financials (Based on Availability)
- 17.2.3 Arabian Plastics Industrial Company Limited (APICO)
- 17.2.3.1. Overview
- 17.2.3.2. Products
- 17.2.3.3. SWOT Analysis
- 17.2.3.4. Recent Developments
- 17.2.3.5. Financials (Based on Availability)
- 17.2.4 Napco Group (Napco National)
- 17.2.4.1. Overview
- 17.2.4.2. Products
- 17.2.4.3. SWOT Analysis
- 17.2.4.4. Recent Developments
- 17.2.4.5. Financials (Based on Availability)
- 17.2.5 SABIC - Saudi Basic Industries Corporation
- 17.2.5.1. Overview
- 17.2.5.2. Products
- 17.2.5.3. SWOT Analysis
- 17.2.5.4. Recent Developments
- 17.2.5.5. Financials (Based on Availability)
- 17.2.6 Zamil Plastic Industries Co
- 17.2.6.1. Overview
- 17.2.6.2. Products
- 17.2.6.3. SWOT Analysis
- 17.2.6.4. Recent Developments
- 17.2.6.5. Financials (Based on Availability)
- 17.2.7 Sealed Air Corporation (Sealed Air Saudi Arabia)*List Not Exhaustive
- 17.2.7.1. Overview
- 17.2.7.2. Products
- 17.2.7.3. SWOT Analysis
- 17.2.7.4. Recent Developments
- 17.2.7.5. Financials (Based on Availability)
- 17.2.8 Takween Advanced Industries
- 17.2.8.1. Overview
- 17.2.8.2. Products
- 17.2.8.3. SWOT Analysis
- 17.2.8.4. Recent Developments
- 17.2.8.5. Financials (Based on Availability)
- 17.2.9 AL-Ghandoura Co Manuf Plastic GhanPlast)
- 17.2.9.1. Overview
- 17.2.9.2. Products
- 17.2.9.3. SWOT Analysis
- 17.2.9.4. Recent Developments
- 17.2.9.5. Financials (Based on Availability)
- 17.2.10 Saudi Arabian Packaging Industry WLL (SAPIN)
- 17.2.10.1. Overview
- 17.2.10.2. Products
- 17.2.10.3. SWOT Analysis
- 17.2.10.4. Recent Developments
- 17.2.10.5. Financials (Based on Availability)
- 17.2.11 Saudi Plastic Factory Company
- 17.2.11.1. Overview
- 17.2.11.2. Products
- 17.2.11.3. SWOT Analysis
- 17.2.11.4. Recent Developments
- 17.2.11.5. Financials (Based on Availability)
- 17.2.12 Arnon Plastic Industry Co Ltd
- 17.2.12.1. Overview
- 17.2.12.2. Products
- 17.2.12.3. SWOT Analysis
- 17.2.12.4. Recent Developments
- 17.2.12.5. Financials (Based on Availability)
- 17.2.13 Plastico SPS
- 17.2.13.1. Overview
- 17.2.13.2. Products
- 17.2.13.3. SWOT Analysis
- 17.2.13.4. Recent Developments
- 17.2.13.5. Financials (Based on Availability)
- 17.2.14 Coloredsun
- 17.2.14.1. Overview
- 17.2.14.2. Products
- 17.2.14.3. SWOT Analysis
- 17.2.14.4. Recent Developments
- 17.2.14.5. Financials (Based on Availability)
- 17.2.15 National Plastic Factory LLC
- 17.2.15.1. Overview
- 17.2.15.2. Products
- 17.2.15.3. SWOT Analysis
- 17.2.15.4. Recent Developments
- 17.2.15.5. Financials (Based on Availability)
- 17.2.16 Packaging Products Company (PPC)
- 17.2.16.1. Overview
- 17.2.16.2. Products
- 17.2.16.3. SWOT Analysis
- 17.2.16.4. Recent Developments
- 17.2.16.5. Financials (Based on Availability)
- 17.2.1 KANR For Plastic Industries
List of Figures
- Figure 1: Global MEA Plastic Packaging Industry Revenue Breakdown (Million, %) by Region 2024 & 2032
- Figure 2: North America MEA Plastic Packaging Industry Revenue (Million), by Country 2024 & 2032
- Figure 3: North America MEA Plastic Packaging Industry Revenue Share (%), by Country 2024 & 2032
- Figure 4: Europe MEA Plastic Packaging Industry Revenue (Million), by Country 2024 & 2032
- Figure 5: Europe MEA Plastic Packaging Industry Revenue Share (%), by Country 2024 & 2032
- Figure 6: Asia Pacific MEA Plastic Packaging Industry Revenue (Million), by Country 2024 & 2032
- Figure 7: Asia Pacific MEA Plastic Packaging Industry Revenue Share (%), by Country 2024 & 2032
- Figure 8: South America MEA Plastic Packaging Industry Revenue (Million), by Country 2024 & 2032
- Figure 9: South America MEA Plastic Packaging Industry Revenue Share (%), by Country 2024 & 2032
- Figure 10: North America MEA Plastic Packaging Industry Revenue (Million), by Country 2024 & 2032
- Figure 11: North America MEA Plastic Packaging Industry Revenue Share (%), by Country 2024 & 2032
- Figure 12: MEA MEA Plastic Packaging Industry Revenue (Million), by Country 2024 & 2032
- Figure 13: MEA MEA Plastic Packaging Industry Revenue Share (%), by Country 2024 & 2032
- Figure 14: United Arab Emirates MEA Plastic Packaging Industry Revenue (Million), by Packaging Type 2024 & 2032
- Figure 15: United Arab Emirates MEA Plastic Packaging Industry Revenue Share (%), by Packaging Type 2024 & 2032
- Figure 16: United Arab Emirates MEA Plastic Packaging Industry Revenue (Million), by Product 2024 & 2032
- Figure 17: United Arab Emirates MEA Plastic Packaging Industry Revenue Share (%), by Product 2024 & 2032
- Figure 18: United Arab Emirates MEA Plastic Packaging Industry Revenue (Million), by Geography 2024 & 2032
- Figure 19: United Arab Emirates MEA Plastic Packaging Industry Revenue Share (%), by Geography 2024 & 2032
- Figure 20: United Arab Emirates MEA Plastic Packaging Industry Revenue (Million), by Country 2024 & 2032
- Figure 21: United Arab Emirates MEA Plastic Packaging Industry Revenue Share (%), by Country 2024 & 2032
- Figure 22: Saudi Arabia MEA Plastic Packaging Industry Revenue (Million), by Packaging Type 2024 & 2032
- Figure 23: Saudi Arabia MEA Plastic Packaging Industry Revenue Share (%), by Packaging Type 2024 & 2032
- Figure 24: Saudi Arabia MEA Plastic Packaging Industry Revenue (Million), by Product 2024 & 2032
- Figure 25: Saudi Arabia MEA Plastic Packaging Industry Revenue Share (%), by Product 2024 & 2032
- Figure 26: Saudi Arabia MEA Plastic Packaging Industry Revenue (Million), by Geography 2024 & 2032
- Figure 27: Saudi Arabia MEA Plastic Packaging Industry Revenue Share (%), by Geography 2024 & 2032
- Figure 28: Saudi Arabia MEA Plastic Packaging Industry Revenue (Million), by Country 2024 & 2032
- Figure 29: Saudi Arabia MEA Plastic Packaging Industry Revenue Share (%), by Country 2024 & 2032
- Figure 30: Egypt MEA Plastic Packaging Industry Revenue (Million), by Packaging Type 2024 & 2032
- Figure 31: Egypt MEA Plastic Packaging Industry Revenue Share (%), by Packaging Type 2024 & 2032
- Figure 32: Egypt MEA Plastic Packaging Industry Revenue (Million), by Product 2024 & 2032
- Figure 33: Egypt MEA Plastic Packaging Industry Revenue Share (%), by Product 2024 & 2032
- Figure 34: Egypt MEA Plastic Packaging Industry Revenue (Million), by Geography 2024 & 2032
- Figure 35: Egypt MEA Plastic Packaging Industry Revenue Share (%), by Geography 2024 & 2032
- Figure 36: Egypt MEA Plastic Packaging Industry Revenue (Million), by Country 2024 & 2032
- Figure 37: Egypt MEA Plastic Packaging Industry Revenue Share (%), by Country 2024 & 2032
- Figure 38: South Africa MEA Plastic Packaging Industry Revenue (Million), by Packaging Type 2024 & 2032
- Figure 39: South Africa MEA Plastic Packaging Industry Revenue Share (%), by Packaging Type 2024 & 2032
- Figure 40: South Africa MEA Plastic Packaging Industry Revenue (Million), by Product 2024 & 2032
- Figure 41: South Africa MEA Plastic Packaging Industry Revenue Share (%), by Product 2024 & 2032
- Figure 42: South Africa MEA Plastic Packaging Industry Revenue (Million), by Geography 2024 & 2032
- Figure 43: South Africa MEA Plastic Packaging Industry Revenue Share (%), by Geography 2024 & 2032
- Figure 44: South Africa MEA Plastic Packaging Industry Revenue (Million), by Country 2024 & 2032
- Figure 45: South Africa MEA Plastic Packaging Industry Revenue Share (%), by Country 2024 & 2032
- Figure 46: Rest of Middle East and Africa MEA Plastic Packaging Industry Revenue (Million), by Packaging Type 2024 & 2032
- Figure 47: Rest of Middle East and Africa MEA Plastic Packaging Industry Revenue Share (%), by Packaging Type 2024 & 2032
- Figure 48: Rest of Middle East and Africa MEA Plastic Packaging Industry Revenue (Million), by Product 2024 & 2032
- Figure 49: Rest of Middle East and Africa MEA Plastic Packaging Industry Revenue Share (%), by Product 2024 & 2032
- Figure 50: Rest of Middle East and Africa MEA Plastic Packaging Industry Revenue (Million), by Geography 2024 & 2032
- Figure 51: Rest of Middle East and Africa MEA Plastic Packaging Industry Revenue Share (%), by Geography 2024 & 2032
- Figure 52: Rest of Middle East and Africa MEA Plastic Packaging Industry Revenue (Million), by Country 2024 & 2032
- Figure 53: Rest of Middle East and Africa MEA Plastic Packaging Industry Revenue Share (%), by Country 2024 & 2032
List of Tables
- Table 1: Global MEA Plastic Packaging Industry Revenue Million Forecast, by Region 2019 & 2032
- Table 2: Global MEA Plastic Packaging Industry Revenue Million Forecast, by Packaging Type 2019 & 2032
- Table 3: Global MEA Plastic Packaging Industry Revenue Million Forecast, by Product 2019 & 2032
- Table 4: Global MEA Plastic Packaging Industry Revenue Million Forecast, by Geography 2019 & 2032
- Table 5: Global MEA Plastic Packaging Industry Revenue Million Forecast, by Region 2019 & 2032
- Table 6: Global MEA Plastic Packaging Industry Revenue Million Forecast, by Country 2019 & 2032
- Table 7: United States MEA Plastic Packaging Industry Revenue (Million) Forecast, by Application 2019 & 2032
- Table 8: Canada MEA Plastic Packaging Industry Revenue (Million) Forecast, by Application 2019 & 2032
- Table 9: Mexico MEA Plastic Packaging Industry Revenue (Million) Forecast, by Application 2019 & 2032
- Table 10: Global MEA Plastic Packaging Industry Revenue Million Forecast, by Country 2019 & 2032
- Table 11: Germany MEA Plastic Packaging Industry Revenue (Million) Forecast, by Application 2019 & 2032
- Table 12: United Kingdom MEA Plastic Packaging Industry Revenue (Million) Forecast, by Application 2019 & 2032
- Table 13: France MEA Plastic Packaging Industry Revenue (Million) Forecast, by Application 2019 & 2032
- Table 14: Spain MEA Plastic Packaging Industry Revenue (Million) Forecast, by Application 2019 & 2032
- Table 15: Italy MEA Plastic Packaging Industry Revenue (Million) Forecast, by Application 2019 & 2032
- Table 16: Spain MEA Plastic Packaging Industry Revenue (Million) Forecast, by Application 2019 & 2032
- Table 17: Belgium MEA Plastic Packaging Industry Revenue (Million) Forecast, by Application 2019 & 2032
- Table 18: Netherland MEA Plastic Packaging Industry Revenue (Million) Forecast, by Application 2019 & 2032
- Table 19: Nordics MEA Plastic Packaging Industry Revenue (Million) Forecast, by Application 2019 & 2032
- Table 20: Rest of Europe MEA Plastic Packaging Industry Revenue (Million) Forecast, by Application 2019 & 2032
- Table 21: Global MEA Plastic Packaging Industry Revenue Million Forecast, by Country 2019 & 2032
- Table 22: China MEA Plastic Packaging Industry Revenue (Million) Forecast, by Application 2019 & 2032
- Table 23: Japan MEA Plastic Packaging Industry Revenue (Million) Forecast, by Application 2019 & 2032
- Table 24: India MEA Plastic Packaging Industry Revenue (Million) Forecast, by Application 2019 & 2032
- Table 25: South Korea MEA Plastic Packaging Industry Revenue (Million) Forecast, by Application 2019 & 2032
- Table 26: Southeast Asia MEA Plastic Packaging Industry Revenue (Million) Forecast, by Application 2019 & 2032
- Table 27: Australia MEA Plastic Packaging Industry Revenue (Million) Forecast, by Application 2019 & 2032
- Table 28: Indonesia MEA Plastic Packaging Industry Revenue (Million) Forecast, by Application 2019 & 2032
- Table 29: Phillipes MEA Plastic Packaging Industry Revenue (Million) Forecast, by Application 2019 & 2032
- Table 30: Singapore MEA Plastic Packaging Industry Revenue (Million) Forecast, by Application 2019 & 2032
- Table 31: Thailandc MEA Plastic Packaging Industry Revenue (Million) Forecast, by Application 2019 & 2032
- Table 32: Rest of Asia Pacific MEA Plastic Packaging Industry Revenue (Million) Forecast, by Application 2019 & 2032
- Table 33: Global MEA Plastic Packaging Industry Revenue Million Forecast, by Country 2019 & 2032
- Table 34: Brazil MEA Plastic Packaging Industry Revenue (Million) Forecast, by Application 2019 & 2032
- Table 35: Argentina MEA Plastic Packaging Industry Revenue (Million) Forecast, by Application 2019 & 2032
- Table 36: Peru MEA Plastic Packaging Industry Revenue (Million) Forecast, by Application 2019 & 2032
- Table 37: Chile MEA Plastic Packaging Industry Revenue (Million) Forecast, by Application 2019 & 2032
- Table 38: Colombia MEA Plastic Packaging Industry Revenue (Million) Forecast, by Application 2019 & 2032
- Table 39: Ecuador MEA Plastic Packaging Industry Revenue (Million) Forecast, by Application 2019 & 2032
- Table 40: Venezuela MEA Plastic Packaging Industry Revenue (Million) Forecast, by Application 2019 & 2032
- Table 41: Rest of South America MEA Plastic Packaging Industry Revenue (Million) Forecast, by Application 2019 & 2032
- Table 42: Global MEA Plastic Packaging Industry Revenue Million Forecast, by Country 2019 & 2032
- Table 43: United States MEA Plastic Packaging Industry Revenue (Million) Forecast, by Application 2019 & 2032
- Table 44: Canada MEA Plastic Packaging Industry Revenue (Million) Forecast, by Application 2019 & 2032
- Table 45: Mexico MEA Plastic Packaging Industry Revenue (Million) Forecast, by Application 2019 & 2032
- Table 46: Global MEA Plastic Packaging Industry Revenue Million Forecast, by Country 2019 & 2032
- Table 47: United Arab Emirates MEA Plastic Packaging Industry Revenue (Million) Forecast, by Application 2019 & 2032
- Table 48: Saudi Arabia MEA Plastic Packaging Industry Revenue (Million) Forecast, by Application 2019 & 2032
- Table 49: South Africa MEA Plastic Packaging Industry Revenue (Million) Forecast, by Application 2019 & 2032
- Table 50: Rest of Middle East and Africa MEA Plastic Packaging Industry Revenue (Million) Forecast, by Application 2019 & 2032
- Table 51: Global MEA Plastic Packaging Industry Revenue Million Forecast, by Packaging Type 2019 & 2032
- Table 52: Global MEA Plastic Packaging Industry Revenue Million Forecast, by Product 2019 & 2032
- Table 53: Global MEA Plastic Packaging Industry Revenue Million Forecast, by Geography 2019 & 2032
- Table 54: Global MEA Plastic Packaging Industry Revenue Million Forecast, by Country 2019 & 2032
- Table 55: Global MEA Plastic Packaging Industry Revenue Million Forecast, by Packaging Type 2019 & 2032
- Table 56: Global MEA Plastic Packaging Industry Revenue Million Forecast, by Product 2019 & 2032
- Table 57: Global MEA Plastic Packaging Industry Revenue Million Forecast, by Geography 2019 & 2032
- Table 58: Global MEA Plastic Packaging Industry Revenue Million Forecast, by Country 2019 & 2032
- Table 59: Global MEA Plastic Packaging Industry Revenue Million Forecast, by Packaging Type 2019 & 2032
- Table 60: Global MEA Plastic Packaging Industry Revenue Million Forecast, by Product 2019 & 2032
- Table 61: Global MEA Plastic Packaging Industry Revenue Million Forecast, by Geography 2019 & 2032
- Table 62: Global MEA Plastic Packaging Industry Revenue Million Forecast, by Country 2019 & 2032
- Table 63: Global MEA Plastic Packaging Industry Revenue Million Forecast, by Packaging Type 2019 & 2032
- Table 64: Global MEA Plastic Packaging Industry Revenue Million Forecast, by Product 2019 & 2032
- Table 65: Global MEA Plastic Packaging Industry Revenue Million Forecast, by Geography 2019 & 2032
- Table 66: Global MEA Plastic Packaging Industry Revenue Million Forecast, by Country 2019 & 2032
- Table 67: Global MEA Plastic Packaging Industry Revenue Million Forecast, by Packaging Type 2019 & 2032
- Table 68: Global MEA Plastic Packaging Industry Revenue Million Forecast, by Product 2019 & 2032
- Table 69: Global MEA Plastic Packaging Industry Revenue Million Forecast, by Geography 2019 & 2032
- Table 70: Global MEA Plastic Packaging Industry Revenue Million Forecast, by Country 2019 & 2032
Frequently Asked Questions
1. What is the projected Compound Annual Growth Rate (CAGR) of the MEA Plastic Packaging Industry?
The projected CAGR is approximately 6.54%.
2. Which companies are prominent players in the MEA Plastic Packaging Industry?
Key companies in the market include KANR For Plastic Industries, Al Nawakheth Factory Company, Arabian Plastics Industrial Company Limited (APICO), Napco Group (Napco National), SABIC - Saudi Basic Industries Corporation, Zamil Plastic Industries Co, Sealed Air Corporation (Sealed Air Saudi Arabia)*List Not Exhaustive, Takween Advanced Industries, AL-Ghandoura Co Manuf Plastic GhanPlast), Saudi Arabian Packaging Industry WLL (SAPIN), Saudi Plastic Factory Company, Arnon Plastic Industry Co Ltd, Plastico SPS, Coloredsun, National Plastic Factory LLC, Packaging Products Company (PPC).
3. What are the main segments of the MEA Plastic Packaging Industry?
The market segments include Packaging Type, Product, Geography.
4. Can you provide details about the market size?
The market size is estimated to be USD XX Million as of 2022.
5. What are some drivers contributing to market growth?
Demand for Oxo-Degradable Plastics.
6. What are the notable trends driving market growth?
Flexible Packaging is Expected to Witness Significant Growth.
7. Are there any restraints impacting market growth?
Environmental Concerns Over Recycling and Safe Disposal and Price Volatility of Raw Materials.
8. Can you provide examples of recent developments in the market?
June 2022: Sabic, a global leader in the chemical industry, joined forces with Heinz, Tesco, and Berry in an innovative recycling trial in the United Kingdom designed to close the loop on soft plastic food packaging. Flexible plastic packaging collected from Tesco stores has been used to produce certified circular polypropylene (PP) from Sabic's Trucircle portfolio for microwavable Heinz Beanz Snap Pots, made from 39% recycled soft plastic. Consumers are encouraged to return the soft plastic packaging to collection points at Tesco stores.
9. What pricing options are available for accessing the report?
Pricing options include single-user, multi-user, and enterprise licenses priced at USD 4750, USD 5250, and USD 8750 respectively.
10. Is the market size provided in terms of value or volume?
The market size is provided in terms of value, measured in Million.
11. Are there any specific market keywords associated with the report?
Yes, the market keyword associated with the report is "MEA Plastic Packaging Industry," which aids in identifying and referencing the specific market segment covered.
12. How do I determine which pricing option suits my needs best?
The pricing options vary based on user requirements and access needs. Individual users may opt for single-user licenses, while businesses requiring broader access may choose multi-user or enterprise licenses for cost-effective access to the report.
13. Are there any additional resources or data provided in the MEA Plastic Packaging Industry report?
While the report offers comprehensive insights, it's advisable to review the specific contents or supplementary materials provided to ascertain if additional resources or data are available.
14. How can I stay updated on further developments or reports in the MEA Plastic Packaging Industry?
To stay informed about further developments, trends, and reports in the MEA Plastic Packaging Industry, consider subscribing to industry newsletters, following relevant companies and organizations, or regularly checking reputable industry news sources and publications.
Methodology
Step 1 - Identification of Relevant Samples Size from Population Database


Step 2 - Approaches for Defining Global Market Size (Value, Volume* & Price*)

Note*: In applicable scenarios
Step 3 - Data Sources
Primary Research
- Web Analytics
- Survey Reports
- Research Institute
- Latest Research Reports
- Opinion Leaders
Secondary Research
- Annual Reports
- White Paper
- Latest Press Release
- Industry Association
- Paid Database
- Investor Presentations

Step 4 - Data Triangulation
Involves using different sources of information in order to increase the validity of a study
These sources are likely to be stakeholders in a program - participants, other researchers, program staff, other community members, and so on.
Then we put all data in single framework & apply various statistical tools to find out the dynamic on the market.
During the analysis stage, feedback from the stakeholder groups would be compared to determine areas of agreement as well as areas of divergence
