

Key Insights
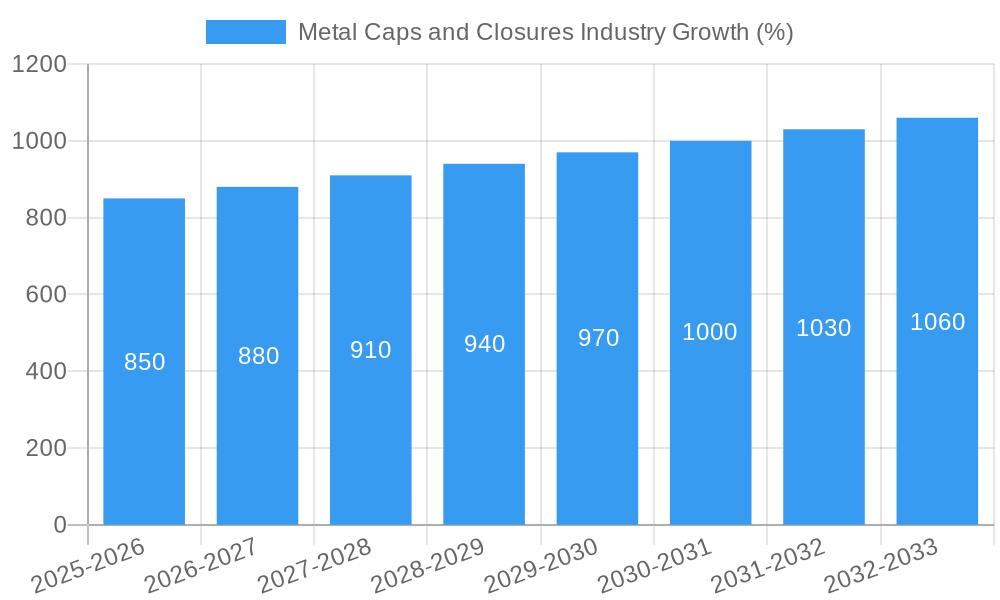
The global metal caps and closures market, valued at $24.57 billion in 2025, is projected to experience steady growth, driven by the increasing demand for packaged food and beverages, particularly in developing economies. A compound annual growth rate (CAGR) of 3.38% from 2025 to 2033 indicates a substantial market expansion. Key growth drivers include the rising preference for convenient packaging solutions, stringent food safety regulations necessitating tamper-evident closures, and the growing popularity of ready-to-drink beverages. The market is segmented by material type (aluminum, steel, tin), closure type (crown caps, screw caps, twist metal caps, easy open ends, ROPP metal caps), and end-user industry (food, beverages, pharmaceuticals, personal care). Aluminum dominates the material segment due to its lightweight nature, recyclability, and cost-effectiveness. Screw caps are the leading closure type, favored for their ease of use and secure sealing properties. The food and beverage industries constitute the largest end-user segment, fueled by the escalating demand for processed and packaged food products globally. However, fluctuating raw material prices and the emergence of alternative packaging solutions present significant challenges to market growth. Companies like Closure Systems International, Crown Holdings, and Guala Closures are major players, competing on innovation, pricing, and geographical reach. Future growth will likely be influenced by sustainable packaging trends, increasing automation in manufacturing processes, and expanding e-commerce channels.
The regional distribution of the market is likely to show significant variations. North America and Europe currently hold substantial market shares due to established food and beverage industries and high per capita consumption. However, Asia-Pacific is anticipated to witness the fastest growth rate in the forecast period due to rapid economic development, rising disposable incomes, and expanding packaged food consumption. Latin America and the Middle East & Africa are also expected to show moderate growth, albeit at a slower pace compared to Asia-Pacific. Market players are increasingly focusing on regional expansion strategies to capitalize on growth opportunities in emerging markets. This involves adapting products to local preferences, establishing strategic partnerships, and investing in local manufacturing capabilities.

Metal Caps and Closures Industry: A Comprehensive Market Report (2019-2033)
This comprehensive report provides a detailed analysis of the global Metal Caps and Closures industry, offering invaluable insights for stakeholders, investors, and industry professionals. With a focus on market dynamics, key players, and future trends, this report covers the period from 2019 to 2033, with a base year of 2025 and a forecast period spanning 2025-2033. The report encompasses a market size exceeding xx Million by 2033, showcasing significant growth potential. Key segments analyzed include aluminum, steel, and tin metal caps and closures, categorized by crown caps, screw caps, twist metal caps, and other closure types, across diverse end-user industries, including food, beverages, pharmaceuticals, and personal care.
Metal Caps and Closures Industry Market Concentration & Dynamics
The global metal caps and closures market exhibits a moderately consolidated structure, with several major players holding significant market share. Key players like Crown Holdings Inc, Amcor PLC, and Guala Closures S.p.A. command a considerable portion of the market, while numerous smaller regional players contribute to the overall landscape. The market share of the top 5 players is estimated at xx%, indicating opportunities for both expansion and consolidation.
Market Dynamics:
- Innovation Ecosystem: Continuous innovation in materials, designs (e.g., easy-open ends, ROPP metal caps), and sustainable solutions drives market growth.
- Regulatory Frameworks: Stringent regulations regarding food safety and material compliance influence product development and manufacturing processes.
- Substitute Products: Competition from plastic and other alternative closure types presents a challenge, necessitating ongoing innovation to maintain market share.
- End-User Trends: The rising demand for convenient and tamper-evident packaging in food and beverage, pharmaceutical, and personal care sectors fuels market expansion.
- M&A Activities: The industry has witnessed significant M&A activity in recent years (xx deals in the last 5 years), indicating a trend toward consolidation and expansion of market reach.
Metal Caps and Closures Industry Industry Insights & Trends
The global metal caps and closures market is projected to witness robust growth, with a Compound Annual Growth Rate (CAGR) of xx% during the forecast period (2025-2033). This growth is primarily driven by the increasing demand for packaged goods across various end-user industries. The market size in 2025 is estimated at xx Million, expected to reach xx Million by 2033.
Several factors contribute to this growth:
- Rising Disposable Incomes: Increased purchasing power globally fuels demand for packaged goods, thereby increasing the demand for metal caps and closures.
- Technological Advancements: Innovations in material science and manufacturing technologies lead to improved product quality, functionality, and sustainability.
- Evolving Consumer Behavior: Growing preference for convenience, safety, and sustainability influences the selection of packaging materials and closures.
- Expansion in Emerging Economies: Rapid economic growth in developing countries drives the demand for packaged goods and metal closures, particularly in food and beverage sectors.
Key Markets & Segments Leading Metal Caps and Closures Industry
The Asia-Pacific region dominates the global metal caps and closures market, driven by rapid industrialization, expanding food & beverage sector, and a large population base. Within the segments:
By Material Type:
- Aluminum dominates due to its lightweight, recyclability, and corrosion resistance.
- Steel maintains a significant share due to its strength and cost-effectiveness.
- Tin finds niche applications where high-barrier properties are critical.
By Closures Type:
- Crown caps remain prevalent in the beverage industry.
- Screw caps are widely used due to their convenience and ease of use.
- Twist metal caps offer a secure and tamper-evident closure option.
- Other types, including easy-open ends and ROPP (Roll-on Pilfer Proof) metal caps, cater to specific product requirements.
By End-User Industry:
- The Food and Beverage industry accounts for a significant market share.
- Pharmaceuticals and personal care industries represent sizable and growing segments, driven by safety and hygiene concerns.
Drivers:
- Rapid economic growth in emerging economies.
- Expansion of the food and beverage industry.
- Increasing demand for convenient and tamper-evident packaging.
- Growth of the pharmaceutical and personal care sectors.
Metal Caps and Closures Industry Product Developments
Recent innovations include the development of lightweight, sustainable, and functional metal closures. Advances in material science, coatings, and manufacturing processes have led to improved barrier properties, enhanced recyclability, and customized designs to meet specific application needs. These innovations provide competitive advantages in terms of product performance and cost-effectiveness, driving market growth.
Challenges in the Metal Caps and Closures Industry Market
The industry faces challenges such as fluctuations in raw material prices (impacting profitability by xx%), stringent environmental regulations (resulting in xx% increase in compliance costs), intense competition (leading to reduced profit margins by xx%), and supply chain disruptions (causing delays in production and delivery by xx%).
Forces Driving Metal Caps and Closures Industry Growth
Technological advancements in manufacturing processes, material science and sustainable packaging solutions are key growth drivers. Growing demand from the food and beverage sector in developing economies, combined with the need for tamper-evident and convenient closures, further accelerate market expansion. Stringent regulatory compliance drives innovation in eco-friendly materials and processes.
Long-Term Growth Catalysts in the Metal Caps and Closures Industry
Long-term growth hinges on strategic partnerships for innovation and distribution, focusing on eco-friendly materials and sustainable packaging solutions, and expanding into new and emerging markets. Further product diversification, including specialized closures for unique applications, promises significant growth potential.
Emerging Opportunities in Metal Caps and Closures Industry
Emerging opportunities include the development of specialized closures for niche applications, adoption of sustainable and eco-friendly materials (e.g., recycled aluminum), and expansion into e-commerce packaging. Customized closure designs to meet specific product and brand requirements offer significant market potential.
Leading Players in the Metal Caps and Closures Industry Sector
- Closure Systems International Inc (CSI)
- Qorpak (Berlin Packaging)
- Guala Closures S.p.A
- Crown Holdings Inc
- Nippon Closures Co Ltd
- Amcor PLC
- Pelliconi & C SpA
- Sks Bottle & Packaging Inc
- Alameda Packaging LLC
- Silgan White Cap LLC
- O Berk Company
Key Milestones in Metal Caps and Closures Industry Industry
- January 2023: Guala Closures Group's SBTi validation for its 2030 GHG emission targets highlights industry focus on sustainability.
- March 2022: Pelliconi's San Francisco outpost signals expansion and focus on innovation in the Food & Beverage sector.
Strategic Outlook for Metal Caps and Closures Industry Market
The future of the metal caps and closures market is bright, driven by sustained growth in the food and beverage industry, increasing demand for sustainable packaging solutions, and ongoing innovation in closure technologies. Strategic partnerships and investments in research and development will be crucial for maintaining a competitive edge and capturing market share in this dynamic industry.
Metal Caps and Closures Industry Segmentation
-
1. Material Type
- 1.1. Aluminium
- 1.2. Steel
- 1.3. Tin
-
2. Closures Type
- 2.1. Crown Caps
- 2.2. Screw Caps
- 2.3. Twist Metal Caps
- 2.4. Other Cl
-
3. End-User Industry
- 3.1. Food
-
3.2. Beverages
- 3.2.1. Alcoholic
- 3.2.2. Non-Alcoholic
- 3.3. Pharmaceuticals
- 3.4. Personal Care
- 3.5. Other End-User Industries
Metal Caps and Closures Industry Segmentation By Geography
- 1. North America
- 2. Europe
- 3. Asia
- 4. Australia and New Zealand
- 5. Latin America
- 6. Middle East and Africa

Metal Caps and Closures Industry REPORT HIGHLIGHTS
| Aspects | Details |
|---|---|
| Study Period | 2019-2033 |
| Base Year | 2024 |
| Estimated Year | 2025 |
| Forecast Period | 2025-2033 |
| Historical Period | 2019-2024 |
| Growth Rate | CAGR of 3.38% from 2019-2033 |
| Segmentation |
|
Table of Contents
- 1. Introduction
- 1.1. Research Scope
- 1.2. Market Segmentation
- 1.3. Research Methodology
- 1.4. Definitions and Assumptions
- 2. Executive Summary
- 2.1. Introduction
- 3. Market Dynamics
- 3.1. Introduction
- 3.2. Market Drivers
- 3.2.1. Increasing Consumption of Beverages with a Rising Need for Sustainable Packaging Materials; Superior Properties Compared to Other Closure Materials
- 3.3. Market Restrains
- 3.3.1. High Adoption Rate of Other Types of Closure Materials
- 3.4. Market Trends
- 3.4.1. Pharmaceutical Application Offers Potential Growth
- 4. Market Factor Analysis
- 4.1. Porters Five Forces
- 4.2. Supply/Value Chain
- 4.3. PESTEL analysis
- 4.4. Market Entropy
- 4.5. Patent/Trademark Analysis
- 5. Global Metal Caps and Closures Industry Analysis, Insights and Forecast, 2019-2031
- 5.1. Market Analysis, Insights and Forecast - by Material Type
- 5.1.1. Aluminium
- 5.1.2. Steel
- 5.1.3. Tin
- 5.2. Market Analysis, Insights and Forecast - by Closures Type
- 5.2.1. Crown Caps
- 5.2.2. Screw Caps
- 5.2.3. Twist Metal Caps
- 5.2.4. Other Cl
- 5.3. Market Analysis, Insights and Forecast - by End-User Industry
- 5.3.1. Food
- 5.3.2. Beverages
- 5.3.2.1. Alcoholic
- 5.3.2.2. Non-Alcoholic
- 5.3.3. Pharmaceuticals
- 5.3.4. Personal Care
- 5.3.5. Other End-User Industries
- 5.4. Market Analysis, Insights and Forecast - by Region
- 5.4.1. North America
- 5.4.2. Europe
- 5.4.3. Asia
- 5.4.4. Australia and New Zealand
- 5.4.5. Latin America
- 5.4.6. Middle East and Africa
- 5.1. Market Analysis, Insights and Forecast - by Material Type
- 6. North America Metal Caps and Closures Industry Analysis, Insights and Forecast, 2019-2031
- 6.1. Market Analysis, Insights and Forecast - by Material Type
- 6.1.1. Aluminium
- 6.1.2. Steel
- 6.1.3. Tin
- 6.2. Market Analysis, Insights and Forecast - by Closures Type
- 6.2.1. Crown Caps
- 6.2.2. Screw Caps
- 6.2.3. Twist Metal Caps
- 6.2.4. Other Cl
- 6.3. Market Analysis, Insights and Forecast - by End-User Industry
- 6.3.1. Food
- 6.3.2. Beverages
- 6.3.2.1. Alcoholic
- 6.3.2.2. Non-Alcoholic
- 6.3.3. Pharmaceuticals
- 6.3.4. Personal Care
- 6.3.5. Other End-User Industries
- 6.1. Market Analysis, Insights and Forecast - by Material Type
- 7. Europe Metal Caps and Closures Industry Analysis, Insights and Forecast, 2019-2031
- 7.1. Market Analysis, Insights and Forecast - by Material Type
- 7.1.1. Aluminium
- 7.1.2. Steel
- 7.1.3. Tin
- 7.2. Market Analysis, Insights and Forecast - by Closures Type
- 7.2.1. Crown Caps
- 7.2.2. Screw Caps
- 7.2.3. Twist Metal Caps
- 7.2.4. Other Cl
- 7.3. Market Analysis, Insights and Forecast - by End-User Industry
- 7.3.1. Food
- 7.3.2. Beverages
- 7.3.2.1. Alcoholic
- 7.3.2.2. Non-Alcoholic
- 7.3.3. Pharmaceuticals
- 7.3.4. Personal Care
- 7.3.5. Other End-User Industries
- 7.1. Market Analysis, Insights and Forecast - by Material Type
- 8. Asia Metal Caps and Closures Industry Analysis, Insights and Forecast, 2019-2031
- 8.1. Market Analysis, Insights and Forecast - by Material Type
- 8.1.1. Aluminium
- 8.1.2. Steel
- 8.1.3. Tin
- 8.2. Market Analysis, Insights and Forecast - by Closures Type
- 8.2.1. Crown Caps
- 8.2.2. Screw Caps
- 8.2.3. Twist Metal Caps
- 8.2.4. Other Cl
- 8.3. Market Analysis, Insights and Forecast - by End-User Industry
- 8.3.1. Food
- 8.3.2. Beverages
- 8.3.2.1. Alcoholic
- 8.3.2.2. Non-Alcoholic
- 8.3.3. Pharmaceuticals
- 8.3.4. Personal Care
- 8.3.5. Other End-User Industries
- 8.1. Market Analysis, Insights and Forecast - by Material Type
- 9. Australia and New Zealand Metal Caps and Closures Industry Analysis, Insights and Forecast, 2019-2031
- 9.1. Market Analysis, Insights and Forecast - by Material Type
- 9.1.1. Aluminium
- 9.1.2. Steel
- 9.1.3. Tin
- 9.2. Market Analysis, Insights and Forecast - by Closures Type
- 9.2.1. Crown Caps
- 9.2.2. Screw Caps
- 9.2.3. Twist Metal Caps
- 9.2.4. Other Cl
- 9.3. Market Analysis, Insights and Forecast - by End-User Industry
- 9.3.1. Food
- 9.3.2. Beverages
- 9.3.2.1. Alcoholic
- 9.3.2.2. Non-Alcoholic
- 9.3.3. Pharmaceuticals
- 9.3.4. Personal Care
- 9.3.5. Other End-User Industries
- 9.1. Market Analysis, Insights and Forecast - by Material Type
- 10. Latin America Metal Caps and Closures Industry Analysis, Insights and Forecast, 2019-2031
- 10.1. Market Analysis, Insights and Forecast - by Material Type
- 10.1.1. Aluminium
- 10.1.2. Steel
- 10.1.3. Tin
- 10.2. Market Analysis, Insights and Forecast - by Closures Type
- 10.2.1. Crown Caps
- 10.2.2. Screw Caps
- 10.2.3. Twist Metal Caps
- 10.2.4. Other Cl
- 10.3. Market Analysis, Insights and Forecast - by End-User Industry
- 10.3.1. Food
- 10.3.2. Beverages
- 10.3.2.1. Alcoholic
- 10.3.2.2. Non-Alcoholic
- 10.3.3. Pharmaceuticals
- 10.3.4. Personal Care
- 10.3.5. Other End-User Industries
- 10.1. Market Analysis, Insights and Forecast - by Material Type
- 11. Middle East and Africa Metal Caps and Closures Industry Analysis, Insights and Forecast, 2019-2031
- 11.1. Market Analysis, Insights and Forecast - by Material Type
- 11.1.1. Aluminium
- 11.1.2. Steel
- 11.1.3. Tin
- 11.2. Market Analysis, Insights and Forecast - by Closures Type
- 11.2.1. Crown Caps
- 11.2.2. Screw Caps
- 11.2.3. Twist Metal Caps
- 11.2.4. Other Cl
- 11.3. Market Analysis, Insights and Forecast - by End-User Industry
- 11.3.1. Food
- 11.3.2. Beverages
- 11.3.2.1. Alcoholic
- 11.3.2.2. Non-Alcoholic
- 11.3.3. Pharmaceuticals
- 11.3.4. Personal Care
- 11.3.5. Other End-User Industries
- 11.1. Market Analysis, Insights and Forecast - by Material Type
- 12. North America Metal Caps and Closures Industry Analysis, Insights and Forecast, 2019-2031
- 12.1. Market Analysis, Insights and Forecast - By Country/Sub-region
- 12.1.1.
- 13. Europe Metal Caps and Closures Industry Analysis, Insights and Forecast, 2019-2031
- 13.1. Market Analysis, Insights and Forecast - By Country/Sub-region
- 13.1.1.
- 14. Asia Metal Caps and Closures Industry Analysis, Insights and Forecast, 2019-2031
- 14.1. Market Analysis, Insights and Forecast - By Country/Sub-region
- 14.1.1.
- 15. Australia and New Zealand Metal Caps and Closures Industry Analysis, Insights and Forecast, 2019-2031
- 15.1. Market Analysis, Insights and Forecast - By Country/Sub-region
- 15.1.1.
- 16. Latin America Metal Caps and Closures Industry Analysis, Insights and Forecast, 2019-2031
- 16.1. Market Analysis, Insights and Forecast - By Country/Sub-region
- 16.1.1.
- 17. Middle East and Africa Metal Caps and Closures Industry Analysis, Insights and Forecast, 2019-2031
- 17.1. Market Analysis, Insights and Forecast - By Country/Sub-region
- 17.1.1.
- 18. Competitive Analysis
- 18.1. Global Market Share Analysis 2024
- 18.2. Company Profiles
- 18.2.1 Closure Systems International Inc (CSI)*List Not Exhaustive
- 18.2.1.1. Overview
- 18.2.1.2. Products
- 18.2.1.3. SWOT Analysis
- 18.2.1.4. Recent Developments
- 18.2.1.5. Financials (Based on Availability)
- 18.2.2 Qorpak (Berlin Packaging)
- 18.2.2.1. Overview
- 18.2.2.2. Products
- 18.2.2.3. SWOT Analysis
- 18.2.2.4. Recent Developments
- 18.2.2.5. Financials (Based on Availability)
- 18.2.3 Guala Closures S P A
- 18.2.3.1. Overview
- 18.2.3.2. Products
- 18.2.3.3. SWOT Analysis
- 18.2.3.4. Recent Developments
- 18.2.3.5. Financials (Based on Availability)
- 18.2.4 Crown Holdings Inc
- 18.2.4.1. Overview
- 18.2.4.2. Products
- 18.2.4.3. SWOT Analysis
- 18.2.4.4. Recent Developments
- 18.2.4.5. Financials (Based on Availability)
- 18.2.5 Nippon Closures Co Ltd
- 18.2.5.1. Overview
- 18.2.5.2. Products
- 18.2.5.3. SWOT Analysis
- 18.2.5.4. Recent Developments
- 18.2.5.5. Financials (Based on Availability)
- 18.2.6 Amcor PLC
- 18.2.6.1. Overview
- 18.2.6.2. Products
- 18.2.6.3. SWOT Analysis
- 18.2.6.4. Recent Developments
- 18.2.6.5. Financials (Based on Availability)
- 18.2.7 Pelliconi & C SpA
- 18.2.7.1. Overview
- 18.2.7.2. Products
- 18.2.7.3. SWOT Analysis
- 18.2.7.4. Recent Developments
- 18.2.7.5. Financials (Based on Availability)
- 18.2.8 Sks Bottle & Packaging Inc
- 18.2.8.1. Overview
- 18.2.8.2. Products
- 18.2.8.3. SWOT Analysis
- 18.2.8.4. Recent Developments
- 18.2.8.5. Financials (Based on Availability)
- 18.2.9 Alameda Packaging LLC
- 18.2.9.1. Overview
- 18.2.9.2. Products
- 18.2.9.3. SWOT Analysis
- 18.2.9.4. Recent Developments
- 18.2.9.5. Financials (Based on Availability)
- 18.2.10 Silgan White Cap LLC
- 18.2.10.1. Overview
- 18.2.10.2. Products
- 18.2.10.3. SWOT Analysis
- 18.2.10.4. Recent Developments
- 18.2.10.5. Financials (Based on Availability)
- 18.2.11 O Berk Company
- 18.2.11.1. Overview
- 18.2.11.2. Products
- 18.2.11.3. SWOT Analysis
- 18.2.11.4. Recent Developments
- 18.2.11.5. Financials (Based on Availability)
- 18.2.1 Closure Systems International Inc (CSI)*List Not Exhaustive
List of Figures
- Figure 1: Global Metal Caps and Closures Industry Revenue Breakdown (Million, %) by Region 2024 & 2032
- Figure 2: North America Metal Caps and Closures Industry Revenue (Million), by Country 2024 & 2032
- Figure 3: North America Metal Caps and Closures Industry Revenue Share (%), by Country 2024 & 2032
- Figure 4: Europe Metal Caps and Closures Industry Revenue (Million), by Country 2024 & 2032
- Figure 5: Europe Metal Caps and Closures Industry Revenue Share (%), by Country 2024 & 2032
- Figure 6: Asia Metal Caps and Closures Industry Revenue (Million), by Country 2024 & 2032
- Figure 7: Asia Metal Caps and Closures Industry Revenue Share (%), by Country 2024 & 2032
- Figure 8: Australia and New Zealand Metal Caps and Closures Industry Revenue (Million), by Country 2024 & 2032
- Figure 9: Australia and New Zealand Metal Caps and Closures Industry Revenue Share (%), by Country 2024 & 2032
- Figure 10: Latin America Metal Caps and Closures Industry Revenue (Million), by Country 2024 & 2032
- Figure 11: Latin America Metal Caps and Closures Industry Revenue Share (%), by Country 2024 & 2032
- Figure 12: Middle East and Africa Metal Caps and Closures Industry Revenue (Million), by Country 2024 & 2032
- Figure 13: Middle East and Africa Metal Caps and Closures Industry Revenue Share (%), by Country 2024 & 2032
- Figure 14: North America Metal Caps and Closures Industry Revenue (Million), by Material Type 2024 & 2032
- Figure 15: North America Metal Caps and Closures Industry Revenue Share (%), by Material Type 2024 & 2032
- Figure 16: North America Metal Caps and Closures Industry Revenue (Million), by Closures Type 2024 & 2032
- Figure 17: North America Metal Caps and Closures Industry Revenue Share (%), by Closures Type 2024 & 2032
- Figure 18: North America Metal Caps and Closures Industry Revenue (Million), by End-User Industry 2024 & 2032
- Figure 19: North America Metal Caps and Closures Industry Revenue Share (%), by End-User Industry 2024 & 2032
- Figure 20: North America Metal Caps and Closures Industry Revenue (Million), by Country 2024 & 2032
- Figure 21: North America Metal Caps and Closures Industry Revenue Share (%), by Country 2024 & 2032
- Figure 22: Europe Metal Caps and Closures Industry Revenue (Million), by Material Type 2024 & 2032
- Figure 23: Europe Metal Caps and Closures Industry Revenue Share (%), by Material Type 2024 & 2032
- Figure 24: Europe Metal Caps and Closures Industry Revenue (Million), by Closures Type 2024 & 2032
- Figure 25: Europe Metal Caps and Closures Industry Revenue Share (%), by Closures Type 2024 & 2032
- Figure 26: Europe Metal Caps and Closures Industry Revenue (Million), by End-User Industry 2024 & 2032
- Figure 27: Europe Metal Caps and Closures Industry Revenue Share (%), by End-User Industry 2024 & 2032
- Figure 28: Europe Metal Caps and Closures Industry Revenue (Million), by Country 2024 & 2032
- Figure 29: Europe Metal Caps and Closures Industry Revenue Share (%), by Country 2024 & 2032
- Figure 30: Asia Metal Caps and Closures Industry Revenue (Million), by Material Type 2024 & 2032
- Figure 31: Asia Metal Caps and Closures Industry Revenue Share (%), by Material Type 2024 & 2032
- Figure 32: Asia Metal Caps and Closures Industry Revenue (Million), by Closures Type 2024 & 2032
- Figure 33: Asia Metal Caps and Closures Industry Revenue Share (%), by Closures Type 2024 & 2032
- Figure 34: Asia Metal Caps and Closures Industry Revenue (Million), by End-User Industry 2024 & 2032
- Figure 35: Asia Metal Caps and Closures Industry Revenue Share (%), by End-User Industry 2024 & 2032
- Figure 36: Asia Metal Caps and Closures Industry Revenue (Million), by Country 2024 & 2032
- Figure 37: Asia Metal Caps and Closures Industry Revenue Share (%), by Country 2024 & 2032
- Figure 38: Australia and New Zealand Metal Caps and Closures Industry Revenue (Million), by Material Type 2024 & 2032
- Figure 39: Australia and New Zealand Metal Caps and Closures Industry Revenue Share (%), by Material Type 2024 & 2032
- Figure 40: Australia and New Zealand Metal Caps and Closures Industry Revenue (Million), by Closures Type 2024 & 2032
- Figure 41: Australia and New Zealand Metal Caps and Closures Industry Revenue Share (%), by Closures Type 2024 & 2032
- Figure 42: Australia and New Zealand Metal Caps and Closures Industry Revenue (Million), by End-User Industry 2024 & 2032
- Figure 43: Australia and New Zealand Metal Caps and Closures Industry Revenue Share (%), by End-User Industry 2024 & 2032
- Figure 44: Australia and New Zealand Metal Caps and Closures Industry Revenue (Million), by Country 2024 & 2032
- Figure 45: Australia and New Zealand Metal Caps and Closures Industry Revenue Share (%), by Country 2024 & 2032
- Figure 46: Latin America Metal Caps and Closures Industry Revenue (Million), by Material Type 2024 & 2032
- Figure 47: Latin America Metal Caps and Closures Industry Revenue Share (%), by Material Type 2024 & 2032
- Figure 48: Latin America Metal Caps and Closures Industry Revenue (Million), by Closures Type 2024 & 2032
- Figure 49: Latin America Metal Caps and Closures Industry Revenue Share (%), by Closures Type 2024 & 2032
- Figure 50: Latin America Metal Caps and Closures Industry Revenue (Million), by End-User Industry 2024 & 2032
- Figure 51: Latin America Metal Caps and Closures Industry Revenue Share (%), by End-User Industry 2024 & 2032
- Figure 52: Latin America Metal Caps and Closures Industry Revenue (Million), by Country 2024 & 2032
- Figure 53: Latin America Metal Caps and Closures Industry Revenue Share (%), by Country 2024 & 2032
- Figure 54: Middle East and Africa Metal Caps and Closures Industry Revenue (Million), by Material Type 2024 & 2032
- Figure 55: Middle East and Africa Metal Caps and Closures Industry Revenue Share (%), by Material Type 2024 & 2032
- Figure 56: Middle East and Africa Metal Caps and Closures Industry Revenue (Million), by Closures Type 2024 & 2032
- Figure 57: Middle East and Africa Metal Caps and Closures Industry Revenue Share (%), by Closures Type 2024 & 2032
- Figure 58: Middle East and Africa Metal Caps and Closures Industry Revenue (Million), by End-User Industry 2024 & 2032
- Figure 59: Middle East and Africa Metal Caps and Closures Industry Revenue Share (%), by End-User Industry 2024 & 2032
- Figure 60: Middle East and Africa Metal Caps and Closures Industry Revenue (Million), by Country 2024 & 2032
- Figure 61: Middle East and Africa Metal Caps and Closures Industry Revenue Share (%), by Country 2024 & 2032
List of Tables
- Table 1: Global Metal Caps and Closures Industry Revenue Million Forecast, by Region 2019 & 2032
- Table 2: Global Metal Caps and Closures Industry Revenue Million Forecast, by Material Type 2019 & 2032
- Table 3: Global Metal Caps and Closures Industry Revenue Million Forecast, by Closures Type 2019 & 2032
- Table 4: Global Metal Caps and Closures Industry Revenue Million Forecast, by End-User Industry 2019 & 2032
- Table 5: Global Metal Caps and Closures Industry Revenue Million Forecast, by Region 2019 & 2032
- Table 6: Global Metal Caps and Closures Industry Revenue Million Forecast, by Country 2019 & 2032
- Table 7: Metal Caps and Closures Industry Revenue (Million) Forecast, by Application 2019 & 2032
- Table 8: Global Metal Caps and Closures Industry Revenue Million Forecast, by Country 2019 & 2032
- Table 9: Metal Caps and Closures Industry Revenue (Million) Forecast, by Application 2019 & 2032
- Table 10: Global Metal Caps and Closures Industry Revenue Million Forecast, by Country 2019 & 2032
- Table 11: Metal Caps and Closures Industry Revenue (Million) Forecast, by Application 2019 & 2032
- Table 12: Global Metal Caps and Closures Industry Revenue Million Forecast, by Country 2019 & 2032
- Table 13: Metal Caps and Closures Industry Revenue (Million) Forecast, by Application 2019 & 2032
- Table 14: Global Metal Caps and Closures Industry Revenue Million Forecast, by Country 2019 & 2032
- Table 15: Metal Caps and Closures Industry Revenue (Million) Forecast, by Application 2019 & 2032
- Table 16: Global Metal Caps and Closures Industry Revenue Million Forecast, by Country 2019 & 2032
- Table 17: Metal Caps and Closures Industry Revenue (Million) Forecast, by Application 2019 & 2032
- Table 18: Global Metal Caps and Closures Industry Revenue Million Forecast, by Material Type 2019 & 2032
- Table 19: Global Metal Caps and Closures Industry Revenue Million Forecast, by Closures Type 2019 & 2032
- Table 20: Global Metal Caps and Closures Industry Revenue Million Forecast, by End-User Industry 2019 & 2032
- Table 21: Global Metal Caps and Closures Industry Revenue Million Forecast, by Country 2019 & 2032
- Table 22: Global Metal Caps and Closures Industry Revenue Million Forecast, by Material Type 2019 & 2032
- Table 23: Global Metal Caps and Closures Industry Revenue Million Forecast, by Closures Type 2019 & 2032
- Table 24: Global Metal Caps and Closures Industry Revenue Million Forecast, by End-User Industry 2019 & 2032
- Table 25: Global Metal Caps and Closures Industry Revenue Million Forecast, by Country 2019 & 2032
- Table 26: Global Metal Caps and Closures Industry Revenue Million Forecast, by Material Type 2019 & 2032
- Table 27: Global Metal Caps and Closures Industry Revenue Million Forecast, by Closures Type 2019 & 2032
- Table 28: Global Metal Caps and Closures Industry Revenue Million Forecast, by End-User Industry 2019 & 2032
- Table 29: Global Metal Caps and Closures Industry Revenue Million Forecast, by Country 2019 & 2032
- Table 30: Global Metal Caps and Closures Industry Revenue Million Forecast, by Material Type 2019 & 2032
- Table 31: Global Metal Caps and Closures Industry Revenue Million Forecast, by Closures Type 2019 & 2032
- Table 32: Global Metal Caps and Closures Industry Revenue Million Forecast, by End-User Industry 2019 & 2032
- Table 33: Global Metal Caps and Closures Industry Revenue Million Forecast, by Country 2019 & 2032
- Table 34: Global Metal Caps and Closures Industry Revenue Million Forecast, by Material Type 2019 & 2032
- Table 35: Global Metal Caps and Closures Industry Revenue Million Forecast, by Closures Type 2019 & 2032
- Table 36: Global Metal Caps and Closures Industry Revenue Million Forecast, by End-User Industry 2019 & 2032
- Table 37: Global Metal Caps and Closures Industry Revenue Million Forecast, by Country 2019 & 2032
- Table 38: Global Metal Caps and Closures Industry Revenue Million Forecast, by Material Type 2019 & 2032
- Table 39: Global Metal Caps and Closures Industry Revenue Million Forecast, by Closures Type 2019 & 2032
- Table 40: Global Metal Caps and Closures Industry Revenue Million Forecast, by End-User Industry 2019 & 2032
- Table 41: Global Metal Caps and Closures Industry Revenue Million Forecast, by Country 2019 & 2032
Frequently Asked Questions
1. What is the projected Compound Annual Growth Rate (CAGR) of the Metal Caps and Closures Industry?
The projected CAGR is approximately 3.38%.
2. Which companies are prominent players in the Metal Caps and Closures Industry?
Key companies in the market include Closure Systems International Inc (CSI)*List Not Exhaustive, Qorpak (Berlin Packaging), Guala Closures S P A, Crown Holdings Inc, Nippon Closures Co Ltd, Amcor PLC, Pelliconi & C SpA, Sks Bottle & Packaging Inc, Alameda Packaging LLC, Silgan White Cap LLC, O Berk Company.
3. What are the main segments of the Metal Caps and Closures Industry?
The market segments include Material Type, Closures Type, End-User Industry.
4. Can you provide details about the market size?
The market size is estimated to be USD 24.57 Million as of 2022.
5. What are some drivers contributing to market growth?
Increasing Consumption of Beverages with a Rising Need for Sustainable Packaging Materials; Superior Properties Compared to Other Closure Materials.
6. What are the notable trends driving market growth?
Pharmaceutical Application Offers Potential Growth.
7. Are there any restraints impacting market growth?
High Adoption Rate of Other Types of Closure Materials.
8. Can you provide examples of recent developments in the market?
January 2023: Guala Closures Group, a prominent manufacturer of aluminum and specialty closures, received validation from the Science Based Targets Initiative (SBTi) for its 2030 Greenhouse Gas (GHG) emission targets. The targets have been recognized as meeting the ambitious 1.5°C goal, which is a significant milestone in the group's sustainability journey. The company has pledged to reduce absolute scope 1 and 2 GHG emissions by 44% by 2030, based on a 2020 starting point, by adopting science-based targets.
9. What pricing options are available for accessing the report?
Pricing options include single-user, multi-user, and enterprise licenses priced at USD 4750, USD 5250, and USD 8750 respectively.
10. Is the market size provided in terms of value or volume?
The market size is provided in terms of value, measured in Million.
11. Are there any specific market keywords associated with the report?
Yes, the market keyword associated with the report is "Metal Caps and Closures Industry," which aids in identifying and referencing the specific market segment covered.
12. How do I determine which pricing option suits my needs best?
The pricing options vary based on user requirements and access needs. Individual users may opt for single-user licenses, while businesses requiring broader access may choose multi-user or enterprise licenses for cost-effective access to the report.
13. Are there any additional resources or data provided in the Metal Caps and Closures Industry report?
While the report offers comprehensive insights, it's advisable to review the specific contents or supplementary materials provided to ascertain if additional resources or data are available.
14. How can I stay updated on further developments or reports in the Metal Caps and Closures Industry?
To stay informed about further developments, trends, and reports in the Metal Caps and Closures Industry, consider subscribing to industry newsletters, following relevant companies and organizations, or regularly checking reputable industry news sources and publications.
Methodology
Step 1 - Identification of Relevant Samples Size from Population Database


Step 2 - Approaches for Defining Global Market Size (Value, Volume* & Price*)

Note*: In applicable scenarios
Step 3 - Data Sources
Primary Research
- Web Analytics
- Survey Reports
- Research Institute
- Latest Research Reports
- Opinion Leaders
Secondary Research
- Annual Reports
- White Paper
- Latest Press Release
- Industry Association
- Paid Database
- Investor Presentations

Step 4 - Data Triangulation
Involves using different sources of information in order to increase the validity of a study
These sources are likely to be stakeholders in a program - participants, other researchers, program staff, other community members, and so on.
Then we put all data in single framework & apply various statistical tools to find out the dynamic on the market.
During the analysis stage, feedback from the stakeholder groups would be compared to determine areas of agreement as well as areas of divergence
