

Key Insights
The global neuroprosthetics market, valued at $12.01 billion in 2025, is poised for significant growth, exhibiting a Compound Annual Growth Rate (CAGR) of 11.83% from 2025 to 2033. This expansion is driven by several key factors. The increasing prevalence of neurological disorders like Parkinson's disease, Alzheimer's disease, and epilepsy fuels demand for effective treatment options. Advancements in neurostimulation techniques, such as deep brain stimulation (DBS) and spinal cord stimulation (SCS), are enhancing the precision and efficacy of neuroprosthetics, leading to improved patient outcomes and a wider adoption of these technologies. Furthermore, ongoing research and development efforts focused on creating more sophisticated and biocompatible neural interfaces are further accelerating market growth. The market is segmented by type (input and output neural prosthetics), technique (DBS, SCS, vagus nerve stimulation, and others), and application (Parkinson's, Alzheimer's, epilepsy, auditory, ophthalmic, and other disorders). The high cost of these devices and procedures, along with the need for specialized healthcare professionals for implantation and follow-up care, present some challenges to market expansion. However, continuous technological advancements, coupled with rising healthcare spending and improved reimbursement policies, are expected to mitigate these restraints.
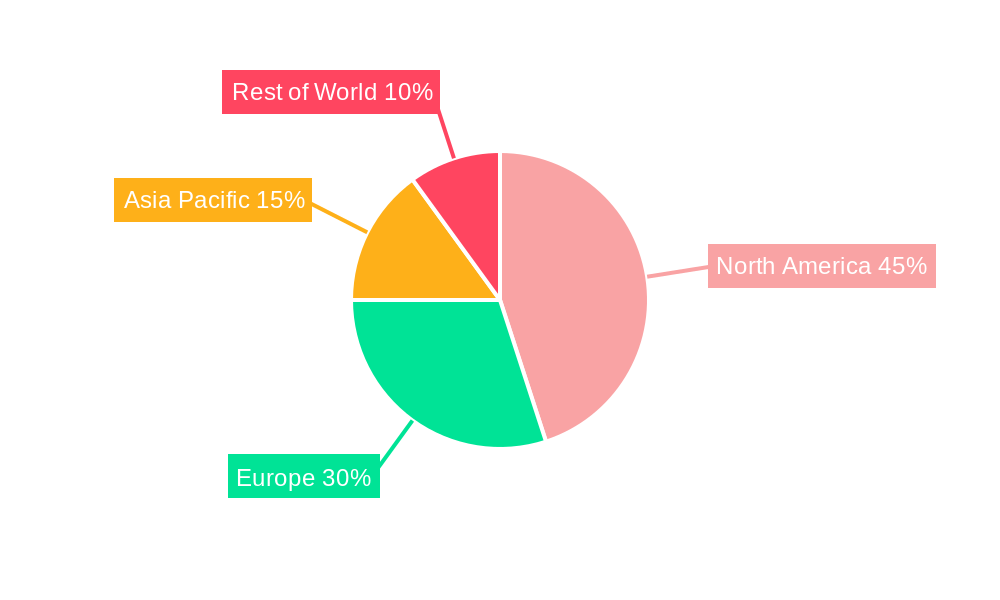
North America currently dominates the neuroprosthetics market due to strong technological innovation, robust healthcare infrastructure, and high adoption rates. However, significant growth opportunities exist in the Asia-Pacific region, driven by rising disposable incomes, an expanding geriatric population, and increasing healthcare investment. The European market also exhibits substantial growth potential, fueled by increasing awareness of neuroprosthetics and supportive regulatory frameworks. Competitive landscape analysis reveals key players like Medtronic, Abbott Laboratories, and Boston Scientific leading the market with their extensive product portfolios and strong distribution networks. Smaller companies focused on niche applications and innovative technologies are also contributing to market dynamics, fueling innovation and fostering competition. The future of neuroprosthetics looks promising, with continued advancements in materials science, artificial intelligence, and minimally invasive surgical techniques promising to make these life-changing technologies even more accessible and effective.

Neuroprosthetics Industry Market Report: 2019-2033
This comprehensive report provides a detailed analysis of the Neuroprosthetics industry, covering market size, growth drivers, key players, and future opportunities. The study period spans from 2019 to 2033, with 2025 serving as the base and estimated year. This report is crucial for industry stakeholders, investors, and researchers seeking actionable insights into this rapidly evolving sector. The global market value is projected to reach xx Million by 2033.
Neuroprosthetics Industry Market Concentration & Dynamics
The Neuroprosthetics market is moderately concentrated, with several major players holding significant market share. However, the landscape is dynamic, characterized by ongoing innovation, strategic mergers and acquisitions (M&A), and evolving regulatory frameworks. Key players like Medtronic PLC, Abbott Laboratories, and Cochlear Limited dominate, while smaller companies are driving innovation in niche areas.
- Market Concentration: The top 5 players hold approximately xx% of the global market share in 2025. This is expected to slightly decrease to xx% by 2033 due to increased competition from smaller firms.
- Innovation Ecosystems: Significant R&D investments are driving innovation in materials science, miniaturization, and biocompatibility, leading to improved device performance and reduced invasiveness. Collaboration between academia, research institutions, and industry players is fostering innovation.
- Regulatory Frameworks: Stringent regulatory approvals (e.g., FDA in the US, EMA in Europe) pose challenges, but also ensure safety and efficacy. Regulatory changes and approvals significantly impact market entry and growth.
- Substitute Products: Limited substitute products exist, mainly focusing on non-invasive therapies. However, advancements in these areas could pose a potential threat to the neuroprosthetics market.
- End-User Trends: Increasing prevalence of neurological disorders, growing demand for improved quality of life, and rising healthcare expenditure are driving market growth. Patient preferences and technological advancements influence adoption rates.
- M&A Activities: The number of M&A deals in the Neuroprosthetics industry has increased steadily over the past five years, with an estimated xx deals in 2024, driven by consolidation and expansion strategies. Larger companies are acquiring smaller innovative firms to broaden their product portfolios and technologies.
Neuroprosthetics Industry Insights & Trends
The Neuroprosthetics market is experiencing robust growth, driven by a confluence of factors including technological advancements, increasing prevalence of neurological disorders, and favorable regulatory environments. The global market size was valued at xx Million in 2024 and is projected to reach xx Million by 2033, exhibiting a Compound Annual Growth Rate (CAGR) of xx% during the forecast period (2025-2033). Technological disruptions, such as the development of advanced brain-computer interfaces (BCIs) and minimally invasive surgical techniques, are accelerating market expansion. Evolving consumer behaviors, including increased awareness and acceptance of neuroprosthetics, are further fueling demand. Specific metrics like market size and CAGR are presented in detailed tables within the full report.

Key Markets & Segments Leading Neuroprosthetics Industry
The North American region currently dominates the Neuroprosthetics market due to factors such as high healthcare expenditure, advanced healthcare infrastructure, and a large patient pool. However, Asia Pacific is projected to show significant growth owing to increasing awareness, improving healthcare infrastructure, and rising disposable incomes.
Dominant Segments:
- Type: Output neural prosthetics currently holds a larger market share than input neural prosthetics, though input is experiencing faster growth.
- Technique: Deep brain stimulation (DBS) leads in terms of market share due to its established application in treating Parkinson's disease and other movement disorders. However, spinal cord stimulation (SCS) is also a significant segment.
- Application: Parkinson's Disease remains the largest application segment. However, other applications such as epilepsy and auditory processing disorders are experiencing growth.
Drivers:
- Economic Growth: Higher disposable incomes and increased healthcare spending in developed and emerging economies are contributing to market expansion.
- Technological Advancements: Continuous improvements in device technology, miniaturization, and biocompatibility are driving adoption rates.
- Government Initiatives: Government support for research and development, and favorable reimbursement policies, positively impact market growth.
- Infrastructure Development: Improvements in healthcare infrastructure, particularly in emerging markets, are creating opportunities for market expansion.
Neuroprosthetics Industry Product Developments
Recent years have witnessed significant advancements in neuroprosthetics, with a focus on improving biocompatibility, miniaturization, and functionality. New materials and improved surgical techniques are leading to less invasive procedures and better patient outcomes. The development of advanced BCIs holds immense potential for treating a wider range of neurological disorders, creating new market opportunities. The competitive edge is driven by innovation in materials, design, and surgical approaches offering improved patient outcomes.
Challenges in the Neuroprosthetics Industry Market
The Neuroprosthetics market faces challenges including stringent regulatory approvals, high manufacturing costs, and ethical considerations regarding brain-computer interfaces. Supply chain disruptions can also impact availability and pricing. The high cost of treatment and limited insurance coverage present accessibility barriers. These factors can collectively impact the market by slowing down growth. The xx% increase in raw material cost in 2023 impacted profitability margins.
Forces Driving Neuroprosthetics Industry Growth
Technological advancements such as the development of sophisticated BCIs, minimally invasive surgical techniques, and improved biocompatible materials are key growth drivers. Government funding for research and development further accelerate market growth. Rising prevalence of neurological diseases, increasing healthcare spending, and growing demand for improved quality of life also contribute to positive market trends. The FDA's approval of new devices further fuels market expansion.
Long-Term Growth Catalysts in the Neuroprosthetics Industry
Long-term growth will be fueled by continuous innovation in device design and functionality, partnerships between technology companies and healthcare providers, and expansion into new geographical markets. The development of personalized neuroprosthetics will cater to individual patient needs, driving market expansion. Increased adoption in emerging markets will significantly impact long-term growth.
Emerging Opportunities in Neuroprosthetics Industry
Emerging opportunities lie in the development of closed-loop BCIs, wireless and implantable devices, and the application of AI and machine learning to enhance device performance. New applications are emerging for treating a broader range of neurological disorders beyond those currently addressed. Expansion into untapped markets in emerging economies presents a significant opportunity for growth.
Leading Players in the Neuroprosthetics Industry Sector
- MED-EL Medical Electronics
- Cyberonics Inc
- Abbott Laboratories
- Medtronic PLC
- Sonova Holding AG
- LivaNova PLC
- Demant AS
- Boston Scientific Corporation
- Second Sight
- Cochlear Limited
- BrainGate
Key Milestones in Neuroprosthetics Industry
- December 2022: The Government of Saskatchewan implemented an expanded Cochlear Implant Program, significantly increasing accessibility to these devices.
- October 2022: Axoft launched its brain-machine interface (BMI), securing USD 8 Million in funding for further development and clinical trials. This highlights the increasing investment in innovative neurotechnologies.
Strategic Outlook for Neuroprosthetics Industry Market
The Neuroprosthetics market exhibits significant long-term growth potential, driven by technological advancements, increasing prevalence of neurological disorders, and expanding healthcare spending. Strategic opportunities exist in developing innovative devices, expanding into new applications, and establishing strategic partnerships to accelerate market penetration. Focusing on personalized medicine and improving accessibility will be crucial for future success.
Neuroprosthetics Industry Segmentation
-
1. Type
- 1.1. Output Neural Prosthetics
- 1.2. Input Neural Prosthetics
-
2. Technique
- 2.1. Spinal Cord Stimulation
- 2.2. Deep Brain Stimulation
- 2.3. Vagus Nerve Stimulation
- 2.4. Other Techniques
-
3. Application
- 3.1. Parkinson's Disease
- 3.2. Alzheimer's Disease
- 3.3. Epilepsy
- 3.4. Auditory Processing Disorders
- 3.5. Ophthalmic Disorders
- 3.6. Other Applications
Neuroprosthetics Industry Segmentation By Geography
-
1. North America
- 1.1. United States
- 1.2. Canada
- 1.3. Mexico
-
2. Europe
- 2.1. Germany
- 2.2. United Kingdom
- 2.3. France
- 2.4. Italy
- 2.5. Spain
- 2.6. Rest of Europe
-
3. Asia Pacific
- 3.1. China
- 3.2. Japan
- 3.3. India
- 3.4. Australia
- 3.5. South Korea
- 3.6. Rest of Asia Pacific
-
4. Middle East and Africa
- 4.1. GCC
- 4.2. South Africa
- 4.3. Rest of Middle East and Africa
-
5. South America
- 5.1. Brazil
- 5.2. Argentina
- 5.3. Rest of South America
Neuroprosthetics Industry REPORT HIGHLIGHTS
| Aspects | Details |
|---|---|
| Study Period | 2019-2033 |
| Base Year | 2024 |
| Estimated Year | 2025 |
| Forecast Period | 2025-2033 |
| Historical Period | 2019-2024 |
| Growth Rate | CAGR of 11.83% from 2019-2033 |
| Segmentation |
|
Table of Contents
- 1. Introduction
- 1.1. Research Scope
- 1.2. Market Segmentation
- 1.3. Research Methodology
- 1.4. Definitions and Assumptions
- 2. Executive Summary
- 2.1. Introduction
- 3. Market Dynamics
- 3.1. Introduction
- 3.2. Market Drivers
- 3.2.1. Increasing Number of Patients Suffering from Neurological Disorders and Nerve Injury; Growing Burden of Hearing Loss and Related Defects
- 3.3. Market Restrains
- 3.3.1. Availability of Alternative Treatment Options; High Cost of Neuroprosthetics
- 3.4. Market Trends
- 3.4.1. The Input Neural Prosthetics Segment is Expected to Show a Significant Growth Over the Forecast Period
- 4. Market Factor Analysis
- 4.1. Porters Five Forces
- 4.2. Supply/Value Chain
- 4.3. PESTEL analysis
- 4.4. Market Entropy
- 4.5. Patent/Trademark Analysis
- 5. Global Neuroprosthetics Industry Analysis, Insights and Forecast, 2019-2031
- 5.1. Market Analysis, Insights and Forecast - by Type
- 5.1.1. Output Neural Prosthetics
- 5.1.2. Input Neural Prosthetics
- 5.2. Market Analysis, Insights and Forecast - by Technique
- 5.2.1. Spinal Cord Stimulation
- 5.2.2. Deep Brain Stimulation
- 5.2.3. Vagus Nerve Stimulation
- 5.2.4. Other Techniques
- 5.3. Market Analysis, Insights and Forecast - by Application
- 5.3.1. Parkinson's Disease
- 5.3.2. Alzheimer's Disease
- 5.3.3. Epilepsy
- 5.3.4. Auditory Processing Disorders
- 5.3.5. Ophthalmic Disorders
- 5.3.6. Other Applications
- 5.4. Market Analysis, Insights and Forecast - by Region
- 5.4.1. North America
- 5.4.2. Europe
- 5.4.3. Asia Pacific
- 5.4.4. Middle East and Africa
- 5.4.5. South America
- 5.1. Market Analysis, Insights and Forecast - by Type
- 6. North America Neuroprosthetics Industry Analysis, Insights and Forecast, 2019-2031
- 6.1. Market Analysis, Insights and Forecast - by Type
- 6.1.1. Output Neural Prosthetics
- 6.1.2. Input Neural Prosthetics
- 6.2. Market Analysis, Insights and Forecast - by Technique
- 6.2.1. Spinal Cord Stimulation
- 6.2.2. Deep Brain Stimulation
- 6.2.3. Vagus Nerve Stimulation
- 6.2.4. Other Techniques
- 6.3. Market Analysis, Insights and Forecast - by Application
- 6.3.1. Parkinson's Disease
- 6.3.2. Alzheimer's Disease
- 6.3.3. Epilepsy
- 6.3.4. Auditory Processing Disorders
- 6.3.5. Ophthalmic Disorders
- 6.3.6. Other Applications
- 6.1. Market Analysis, Insights and Forecast - by Type
- 7. Europe Neuroprosthetics Industry Analysis, Insights and Forecast, 2019-2031
- 7.1. Market Analysis, Insights and Forecast - by Type
- 7.1.1. Output Neural Prosthetics
- 7.1.2. Input Neural Prosthetics
- 7.2. Market Analysis, Insights and Forecast - by Technique
- 7.2.1. Spinal Cord Stimulation
- 7.2.2. Deep Brain Stimulation
- 7.2.3. Vagus Nerve Stimulation
- 7.2.4. Other Techniques
- 7.3. Market Analysis, Insights and Forecast - by Application
- 7.3.1. Parkinson's Disease
- 7.3.2. Alzheimer's Disease
- 7.3.3. Epilepsy
- 7.3.4. Auditory Processing Disorders
- 7.3.5. Ophthalmic Disorders
- 7.3.6. Other Applications
- 7.1. Market Analysis, Insights and Forecast - by Type
- 8. Asia Pacific Neuroprosthetics Industry Analysis, Insights and Forecast, 2019-2031
- 8.1. Market Analysis, Insights and Forecast - by Type
- 8.1.1. Output Neural Prosthetics
- 8.1.2. Input Neural Prosthetics
- 8.2. Market Analysis, Insights and Forecast - by Technique
- 8.2.1. Spinal Cord Stimulation
- 8.2.2. Deep Brain Stimulation
- 8.2.3. Vagus Nerve Stimulation
- 8.2.4. Other Techniques
- 8.3. Market Analysis, Insights and Forecast - by Application
- 8.3.1. Parkinson's Disease
- 8.3.2. Alzheimer's Disease
- 8.3.3. Epilepsy
- 8.3.4. Auditory Processing Disorders
- 8.3.5. Ophthalmic Disorders
- 8.3.6. Other Applications
- 8.1. Market Analysis, Insights and Forecast - by Type
- 9. Middle East and Africa Neuroprosthetics Industry Analysis, Insights and Forecast, 2019-2031
- 9.1. Market Analysis, Insights and Forecast - by Type
- 9.1.1. Output Neural Prosthetics
- 9.1.2. Input Neural Prosthetics
- 9.2. Market Analysis, Insights and Forecast - by Technique
- 9.2.1. Spinal Cord Stimulation
- 9.2.2. Deep Brain Stimulation
- 9.2.3. Vagus Nerve Stimulation
- 9.2.4. Other Techniques
- 9.3. Market Analysis, Insights and Forecast - by Application
- 9.3.1. Parkinson's Disease
- 9.3.2. Alzheimer's Disease
- 9.3.3. Epilepsy
- 9.3.4. Auditory Processing Disorders
- 9.3.5. Ophthalmic Disorders
- 9.3.6. Other Applications
- 9.1. Market Analysis, Insights and Forecast - by Type
- 10. South America Neuroprosthetics Industry Analysis, Insights and Forecast, 2019-2031
- 10.1. Market Analysis, Insights and Forecast - by Type
- 10.1.1. Output Neural Prosthetics
- 10.1.2. Input Neural Prosthetics
- 10.2. Market Analysis, Insights and Forecast - by Technique
- 10.2.1. Spinal Cord Stimulation
- 10.2.2. Deep Brain Stimulation
- 10.2.3. Vagus Nerve Stimulation
- 10.2.4. Other Techniques
- 10.3. Market Analysis, Insights and Forecast - by Application
- 10.3.1. Parkinson's Disease
- 10.3.2. Alzheimer's Disease
- 10.3.3. Epilepsy
- 10.3.4. Auditory Processing Disorders
- 10.3.5. Ophthalmic Disorders
- 10.3.6. Other Applications
- 10.1. Market Analysis, Insights and Forecast - by Type
- 11. North Americ Neuroprosthetics Industry Analysis, Insights and Forecast, 2019-2031
- 11.1. Market Analysis, Insights and Forecast - By Country/Sub-region
- 11.1.1 United States
- 11.1.2 Canada
- 11.1.3 Mexico
- 12. South America Neuroprosthetics Industry Analysis, Insights and Forecast, 2019-2031
- 12.1. Market Analysis, Insights and Forecast - By Country/Sub-region
- 12.1.1 Brazil
- 12.1.2 Mexico
- 12.1.3 Rest of South America
- 13. Europe Neuroprosthetics Industry Analysis, Insights and Forecast, 2019-2031
- 13.1. Market Analysis, Insights and Forecast - By Country/Sub-region
- 13.1.1 Germany
- 13.1.2 United Kingdom
- 13.1.3 France
- 13.1.4 Italy
- 13.1.5 Spain
- 13.1.6 Rest of Europe
- 14. Asia Pacific Neuroprosthetics Industry Analysis, Insights and Forecast, 2019-2031
- 14.1. Market Analysis, Insights and Forecast - By Country/Sub-region
- 14.1.1 China
- 14.1.2 Japan
- 14.1.3 India
- 14.1.4 South Korea
- 14.1.5 Taiwan
- 14.1.6 Australia
- 14.1.7 Rest of Asia-Pacific
- 15. MEA Neuroprosthetics Industry Analysis, Insights and Forecast, 2019-2031
- 15.1. Market Analysis, Insights and Forecast - By Country/Sub-region
- 15.1.1 Middle East
- 15.1.2 Africa
- 16. Competitive Analysis
- 16.1. Global Market Share Analysis 2024
- 16.2. Company Profiles
- 16.2.1 MED-EL Medical Electronics
- 16.2.1.1. Overview
- 16.2.1.2. Products
- 16.2.1.3. SWOT Analysis
- 16.2.1.4. Recent Developments
- 16.2.1.5. Financials (Based on Availability)
- 16.2.2 Cyberonics Inc
- 16.2.2.1. Overview
- 16.2.2.2. Products
- 16.2.2.3. SWOT Analysis
- 16.2.2.4. Recent Developments
- 16.2.2.5. Financials (Based on Availability)
- 16.2.3 Abbott Laboratories
- 16.2.3.1. Overview
- 16.2.3.2. Products
- 16.2.3.3. SWOT Analysis
- 16.2.3.4. Recent Developments
- 16.2.3.5. Financials (Based on Availability)
- 16.2.4 Medtronic PLC
- 16.2.4.1. Overview
- 16.2.4.2. Products
- 16.2.4.3. SWOT Analysis
- 16.2.4.4. Recent Developments
- 16.2.4.5. Financials (Based on Availability)
- 16.2.5 Sonova Holding AG
- 16.2.5.1. Overview
- 16.2.5.2. Products
- 16.2.5.3. SWOT Analysis
- 16.2.5.4. Recent Developments
- 16.2.5.5. Financials (Based on Availability)
- 16.2.6 LivaNova PLC
- 16.2.6.1. Overview
- 16.2.6.2. Products
- 16.2.6.3. SWOT Analysis
- 16.2.6.4. Recent Developments
- 16.2.6.5. Financials (Based on Availability)
- 16.2.7 Demant AS
- 16.2.7.1. Overview
- 16.2.7.2. Products
- 16.2.7.3. SWOT Analysis
- 16.2.7.4. Recent Developments
- 16.2.7.5. Financials (Based on Availability)
- 16.2.8 Boston Scientific Corporation
- 16.2.8.1. Overview
- 16.2.8.2. Products
- 16.2.8.3. SWOT Analysis
- 16.2.8.4. Recent Developments
- 16.2.8.5. Financials (Based on Availability)
- 16.2.9 Second Sight
- 16.2.9.1. Overview
- 16.2.9.2. Products
- 16.2.9.3. SWOT Analysis
- 16.2.9.4. Recent Developments
- 16.2.9.5. Financials (Based on Availability)
- 16.2.10 Cochlear Limited
- 16.2.10.1. Overview
- 16.2.10.2. Products
- 16.2.10.3. SWOT Analysis
- 16.2.10.4. Recent Developments
- 16.2.10.5. Financials (Based on Availability)
- 16.2.11 BrainGate
- 16.2.11.1. Overview
- 16.2.11.2. Products
- 16.2.11.3. SWOT Analysis
- 16.2.11.4. Recent Developments
- 16.2.11.5. Financials (Based on Availability)
- 16.2.1 MED-EL Medical Electronics
List of Figures
- Figure 1: Global Neuroprosthetics Industry Revenue Breakdown (Million, %) by Region 2024 & 2032
- Figure 2: Global Neuroprosthetics Industry Volume Breakdown (K Unit, %) by Region 2024 & 2032
- Figure 3: North Americ Neuroprosthetics Industry Revenue (Million), by Country 2024 & 2032
- Figure 4: North Americ Neuroprosthetics Industry Volume (K Unit), by Country 2024 & 2032
- Figure 5: North Americ Neuroprosthetics Industry Revenue Share (%), by Country 2024 & 2032
- Figure 6: North Americ Neuroprosthetics Industry Volume Share (%), by Country 2024 & 2032
- Figure 7: South America Neuroprosthetics Industry Revenue (Million), by Country 2024 & 2032
- Figure 8: South America Neuroprosthetics Industry Volume (K Unit), by Country 2024 & 2032
- Figure 9: South America Neuroprosthetics Industry Revenue Share (%), by Country 2024 & 2032
- Figure 10: South America Neuroprosthetics Industry Volume Share (%), by Country 2024 & 2032
- Figure 11: Europe Neuroprosthetics Industry Revenue (Million), by Country 2024 & 2032
- Figure 12: Europe Neuroprosthetics Industry Volume (K Unit), by Country 2024 & 2032
- Figure 13: Europe Neuroprosthetics Industry Revenue Share (%), by Country 2024 & 2032
- Figure 14: Europe Neuroprosthetics Industry Volume Share (%), by Country 2024 & 2032
- Figure 15: Asia Pacific Neuroprosthetics Industry Revenue (Million), by Country 2024 & 2032
- Figure 16: Asia Pacific Neuroprosthetics Industry Volume (K Unit), by Country 2024 & 2032
- Figure 17: Asia Pacific Neuroprosthetics Industry Revenue Share (%), by Country 2024 & 2032
- Figure 18: Asia Pacific Neuroprosthetics Industry Volume Share (%), by Country 2024 & 2032
- Figure 19: MEA Neuroprosthetics Industry Revenue (Million), by Country 2024 & 2032
- Figure 20: MEA Neuroprosthetics Industry Volume (K Unit), by Country 2024 & 2032
- Figure 21: MEA Neuroprosthetics Industry Revenue Share (%), by Country 2024 & 2032
- Figure 22: MEA Neuroprosthetics Industry Volume Share (%), by Country 2024 & 2032
- Figure 23: North America Neuroprosthetics Industry Revenue (Million), by Type 2024 & 2032
- Figure 24: North America Neuroprosthetics Industry Volume (K Unit), by Type 2024 & 2032
- Figure 25: North America Neuroprosthetics Industry Revenue Share (%), by Type 2024 & 2032
- Figure 26: North America Neuroprosthetics Industry Volume Share (%), by Type 2024 & 2032
- Figure 27: North America Neuroprosthetics Industry Revenue (Million), by Technique 2024 & 2032
- Figure 28: North America Neuroprosthetics Industry Volume (K Unit), by Technique 2024 & 2032
- Figure 29: North America Neuroprosthetics Industry Revenue Share (%), by Technique 2024 & 2032
- Figure 30: North America Neuroprosthetics Industry Volume Share (%), by Technique 2024 & 2032
- Figure 31: North America Neuroprosthetics Industry Revenue (Million), by Application 2024 & 2032
- Figure 32: North America Neuroprosthetics Industry Volume (K Unit), by Application 2024 & 2032
- Figure 33: North America Neuroprosthetics Industry Revenue Share (%), by Application 2024 & 2032
- Figure 34: North America Neuroprosthetics Industry Volume Share (%), by Application 2024 & 2032
- Figure 35: North America Neuroprosthetics Industry Revenue (Million), by Country 2024 & 2032
- Figure 36: North America Neuroprosthetics Industry Volume (K Unit), by Country 2024 & 2032
- Figure 37: North America Neuroprosthetics Industry Revenue Share (%), by Country 2024 & 2032
- Figure 38: North America Neuroprosthetics Industry Volume Share (%), by Country 2024 & 2032
- Figure 39: Europe Neuroprosthetics Industry Revenue (Million), by Type 2024 & 2032
- Figure 40: Europe Neuroprosthetics Industry Volume (K Unit), by Type 2024 & 2032
- Figure 41: Europe Neuroprosthetics Industry Revenue Share (%), by Type 2024 & 2032
- Figure 42: Europe Neuroprosthetics Industry Volume Share (%), by Type 2024 & 2032
- Figure 43: Europe Neuroprosthetics Industry Revenue (Million), by Technique 2024 & 2032
- Figure 44: Europe Neuroprosthetics Industry Volume (K Unit), by Technique 2024 & 2032
- Figure 45: Europe Neuroprosthetics Industry Revenue Share (%), by Technique 2024 & 2032
- Figure 46: Europe Neuroprosthetics Industry Volume Share (%), by Technique 2024 & 2032
- Figure 47: Europe Neuroprosthetics Industry Revenue (Million), by Application 2024 & 2032
- Figure 48: Europe Neuroprosthetics Industry Volume (K Unit), by Application 2024 & 2032
- Figure 49: Europe Neuroprosthetics Industry Revenue Share (%), by Application 2024 & 2032
- Figure 50: Europe Neuroprosthetics Industry Volume Share (%), by Application 2024 & 2032
- Figure 51: Europe Neuroprosthetics Industry Revenue (Million), by Country 2024 & 2032
- Figure 52: Europe Neuroprosthetics Industry Volume (K Unit), by Country 2024 & 2032
- Figure 53: Europe Neuroprosthetics Industry Revenue Share (%), by Country 2024 & 2032
- Figure 54: Europe Neuroprosthetics Industry Volume Share (%), by Country 2024 & 2032
- Figure 55: Asia Pacific Neuroprosthetics Industry Revenue (Million), by Type 2024 & 2032
- Figure 56: Asia Pacific Neuroprosthetics Industry Volume (K Unit), by Type 2024 & 2032
- Figure 57: Asia Pacific Neuroprosthetics Industry Revenue Share (%), by Type 2024 & 2032
- Figure 58: Asia Pacific Neuroprosthetics Industry Volume Share (%), by Type 2024 & 2032
- Figure 59: Asia Pacific Neuroprosthetics Industry Revenue (Million), by Technique 2024 & 2032
- Figure 60: Asia Pacific Neuroprosthetics Industry Volume (K Unit), by Technique 2024 & 2032
- Figure 61: Asia Pacific Neuroprosthetics Industry Revenue Share (%), by Technique 2024 & 2032
- Figure 62: Asia Pacific Neuroprosthetics Industry Volume Share (%), by Technique 2024 & 2032
- Figure 63: Asia Pacific Neuroprosthetics Industry Revenue (Million), by Application 2024 & 2032
- Figure 64: Asia Pacific Neuroprosthetics Industry Volume (K Unit), by Application 2024 & 2032
- Figure 65: Asia Pacific Neuroprosthetics Industry Revenue Share (%), by Application 2024 & 2032
- Figure 66: Asia Pacific Neuroprosthetics Industry Volume Share (%), by Application 2024 & 2032
- Figure 67: Asia Pacific Neuroprosthetics Industry Revenue (Million), by Country 2024 & 2032
- Figure 68: Asia Pacific Neuroprosthetics Industry Volume (K Unit), by Country 2024 & 2032
- Figure 69: Asia Pacific Neuroprosthetics Industry Revenue Share (%), by Country 2024 & 2032
- Figure 70: Asia Pacific Neuroprosthetics Industry Volume Share (%), by Country 2024 & 2032
- Figure 71: Middle East and Africa Neuroprosthetics Industry Revenue (Million), by Type 2024 & 2032
- Figure 72: Middle East and Africa Neuroprosthetics Industry Volume (K Unit), by Type 2024 & 2032
- Figure 73: Middle East and Africa Neuroprosthetics Industry Revenue Share (%), by Type 2024 & 2032
- Figure 74: Middle East and Africa Neuroprosthetics Industry Volume Share (%), by Type 2024 & 2032
- Figure 75: Middle East and Africa Neuroprosthetics Industry Revenue (Million), by Technique 2024 & 2032
- Figure 76: Middle East and Africa Neuroprosthetics Industry Volume (K Unit), by Technique 2024 & 2032
- Figure 77: Middle East and Africa Neuroprosthetics Industry Revenue Share (%), by Technique 2024 & 2032
- Figure 78: Middle East and Africa Neuroprosthetics Industry Volume Share (%), by Technique 2024 & 2032
- Figure 79: Middle East and Africa Neuroprosthetics Industry Revenue (Million), by Application 2024 & 2032
- Figure 80: Middle East and Africa Neuroprosthetics Industry Volume (K Unit), by Application 2024 & 2032
- Figure 81: Middle East and Africa Neuroprosthetics Industry Revenue Share (%), by Application 2024 & 2032
- Figure 82: Middle East and Africa Neuroprosthetics Industry Volume Share (%), by Application 2024 & 2032
- Figure 83: Middle East and Africa Neuroprosthetics Industry Revenue (Million), by Country 2024 & 2032
- Figure 84: Middle East and Africa Neuroprosthetics Industry Volume (K Unit), by Country 2024 & 2032
- Figure 85: Middle East and Africa Neuroprosthetics Industry Revenue Share (%), by Country 2024 & 2032
- Figure 86: Middle East and Africa Neuroprosthetics Industry Volume Share (%), by Country 2024 & 2032
- Figure 87: South America Neuroprosthetics Industry Revenue (Million), by Type 2024 & 2032
- Figure 88: South America Neuroprosthetics Industry Volume (K Unit), by Type 2024 & 2032
- Figure 89: South America Neuroprosthetics Industry Revenue Share (%), by Type 2024 & 2032
- Figure 90: South America Neuroprosthetics Industry Volume Share (%), by Type 2024 & 2032
- Figure 91: South America Neuroprosthetics Industry Revenue (Million), by Technique 2024 & 2032
- Figure 92: South America Neuroprosthetics Industry Volume (K Unit), by Technique 2024 & 2032
- Figure 93: South America Neuroprosthetics Industry Revenue Share (%), by Technique 2024 & 2032
- Figure 94: South America Neuroprosthetics Industry Volume Share (%), by Technique 2024 & 2032
- Figure 95: South America Neuroprosthetics Industry Revenue (Million), by Application 2024 & 2032
- Figure 96: South America Neuroprosthetics Industry Volume (K Unit), by Application 2024 & 2032
- Figure 97: South America Neuroprosthetics Industry Revenue Share (%), by Application 2024 & 2032
- Figure 98: South America Neuroprosthetics Industry Volume Share (%), by Application 2024 & 2032
- Figure 99: South America Neuroprosthetics Industry Revenue (Million), by Country 2024 & 2032
- Figure 100: South America Neuroprosthetics Industry Volume (K Unit), by Country 2024 & 2032
- Figure 101: South America Neuroprosthetics Industry Revenue Share (%), by Country 2024 & 2032
- Figure 102: South America Neuroprosthetics Industry Volume Share (%), by Country 2024 & 2032
List of Tables
- Table 1: Global Neuroprosthetics Industry Revenue Million Forecast, by Region 2019 & 2032
- Table 2: Global Neuroprosthetics Industry Volume K Unit Forecast, by Region 2019 & 2032
- Table 3: Global Neuroprosthetics Industry Revenue Million Forecast, by Type 2019 & 2032
- Table 4: Global Neuroprosthetics Industry Volume K Unit Forecast, by Type 2019 & 2032
- Table 5: Global Neuroprosthetics Industry Revenue Million Forecast, by Technique 2019 & 2032
- Table 6: Global Neuroprosthetics Industry Volume K Unit Forecast, by Technique 2019 & 2032
- Table 7: Global Neuroprosthetics Industry Revenue Million Forecast, by Application 2019 & 2032
- Table 8: Global Neuroprosthetics Industry Volume K Unit Forecast, by Application 2019 & 2032
- Table 9: Global Neuroprosthetics Industry Revenue Million Forecast, by Region 2019 & 2032
- Table 10: Global Neuroprosthetics Industry Volume K Unit Forecast, by Region 2019 & 2032
- Table 11: Global Neuroprosthetics Industry Revenue Million Forecast, by Country 2019 & 2032
- Table 12: Global Neuroprosthetics Industry Volume K Unit Forecast, by Country 2019 & 2032
- Table 13: United States Neuroprosthetics Industry Revenue (Million) Forecast, by Application 2019 & 2032
- Table 14: United States Neuroprosthetics Industry Volume (K Unit) Forecast, by Application 2019 & 2032
- Table 15: Canada Neuroprosthetics Industry Revenue (Million) Forecast, by Application 2019 & 2032
- Table 16: Canada Neuroprosthetics Industry Volume (K Unit) Forecast, by Application 2019 & 2032
- Table 17: Mexico Neuroprosthetics Industry Revenue (Million) Forecast, by Application 2019 & 2032
- Table 18: Mexico Neuroprosthetics Industry Volume (K Unit) Forecast, by Application 2019 & 2032
- Table 19: Global Neuroprosthetics Industry Revenue Million Forecast, by Country 2019 & 2032
- Table 20: Global Neuroprosthetics Industry Volume K Unit Forecast, by Country 2019 & 2032
- Table 21: Brazil Neuroprosthetics Industry Revenue (Million) Forecast, by Application 2019 & 2032
- Table 22: Brazil Neuroprosthetics Industry Volume (K Unit) Forecast, by Application 2019 & 2032
- Table 23: Mexico Neuroprosthetics Industry Revenue (Million) Forecast, by Application 2019 & 2032
- Table 24: Mexico Neuroprosthetics Industry Volume (K Unit) Forecast, by Application 2019 & 2032
- Table 25: Rest of South America Neuroprosthetics Industry Revenue (Million) Forecast, by Application 2019 & 2032
- Table 26: Rest of South America Neuroprosthetics Industry Volume (K Unit) Forecast, by Application 2019 & 2032
- Table 27: Global Neuroprosthetics Industry Revenue Million Forecast, by Country 2019 & 2032
- Table 28: Global Neuroprosthetics Industry Volume K Unit Forecast, by Country 2019 & 2032
- Table 29: Germany Neuroprosthetics Industry Revenue (Million) Forecast, by Application 2019 & 2032
- Table 30: Germany Neuroprosthetics Industry Volume (K Unit) Forecast, by Application 2019 & 2032
- Table 31: United Kingdom Neuroprosthetics Industry Revenue (Million) Forecast, by Application 2019 & 2032
- Table 32: United Kingdom Neuroprosthetics Industry Volume (K Unit) Forecast, by Application 2019 & 2032
- Table 33: France Neuroprosthetics Industry Revenue (Million) Forecast, by Application 2019 & 2032
- Table 34: France Neuroprosthetics Industry Volume (K Unit) Forecast, by Application 2019 & 2032
- Table 35: Italy Neuroprosthetics Industry Revenue (Million) Forecast, by Application 2019 & 2032
- Table 36: Italy Neuroprosthetics Industry Volume (K Unit) Forecast, by Application 2019 & 2032
- Table 37: Spain Neuroprosthetics Industry Revenue (Million) Forecast, by Application 2019 & 2032
- Table 38: Spain Neuroprosthetics Industry Volume (K Unit) Forecast, by Application 2019 & 2032
- Table 39: Rest of Europe Neuroprosthetics Industry Revenue (Million) Forecast, by Application 2019 & 2032
- Table 40: Rest of Europe Neuroprosthetics Industry Volume (K Unit) Forecast, by Application 2019 & 2032
- Table 41: Global Neuroprosthetics Industry Revenue Million Forecast, by Country 2019 & 2032
- Table 42: Global Neuroprosthetics Industry Volume K Unit Forecast, by Country 2019 & 2032
- Table 43: China Neuroprosthetics Industry Revenue (Million) Forecast, by Application 2019 & 2032
- Table 44: China Neuroprosthetics Industry Volume (K Unit) Forecast, by Application 2019 & 2032
- Table 45: Japan Neuroprosthetics Industry Revenue (Million) Forecast, by Application 2019 & 2032
- Table 46: Japan Neuroprosthetics Industry Volume (K Unit) Forecast, by Application 2019 & 2032
- Table 47: India Neuroprosthetics Industry Revenue (Million) Forecast, by Application 2019 & 2032
- Table 48: India Neuroprosthetics Industry Volume (K Unit) Forecast, by Application 2019 & 2032
- Table 49: South Korea Neuroprosthetics Industry Revenue (Million) Forecast, by Application 2019 & 2032
- Table 50: South Korea Neuroprosthetics Industry Volume (K Unit) Forecast, by Application 2019 & 2032
- Table 51: Taiwan Neuroprosthetics Industry Revenue (Million) Forecast, by Application 2019 & 2032
- Table 52: Taiwan Neuroprosthetics Industry Volume (K Unit) Forecast, by Application 2019 & 2032
- Table 53: Australia Neuroprosthetics Industry Revenue (Million) Forecast, by Application 2019 & 2032
- Table 54: Australia Neuroprosthetics Industry Volume (K Unit) Forecast, by Application 2019 & 2032
- Table 55: Rest of Asia-Pacific Neuroprosthetics Industry Revenue (Million) Forecast, by Application 2019 & 2032
- Table 56: Rest of Asia-Pacific Neuroprosthetics Industry Volume (K Unit) Forecast, by Application 2019 & 2032
- Table 57: Global Neuroprosthetics Industry Revenue Million Forecast, by Country 2019 & 2032
- Table 58: Global Neuroprosthetics Industry Volume K Unit Forecast, by Country 2019 & 2032
- Table 59: Middle East Neuroprosthetics Industry Revenue (Million) Forecast, by Application 2019 & 2032
- Table 60: Middle East Neuroprosthetics Industry Volume (K Unit) Forecast, by Application 2019 & 2032
- Table 61: Africa Neuroprosthetics Industry Revenue (Million) Forecast, by Application 2019 & 2032
- Table 62: Africa Neuroprosthetics Industry Volume (K Unit) Forecast, by Application 2019 & 2032
- Table 63: Global Neuroprosthetics Industry Revenue Million Forecast, by Type 2019 & 2032
- Table 64: Global Neuroprosthetics Industry Volume K Unit Forecast, by Type 2019 & 2032
- Table 65: Global Neuroprosthetics Industry Revenue Million Forecast, by Technique 2019 & 2032
- Table 66: Global Neuroprosthetics Industry Volume K Unit Forecast, by Technique 2019 & 2032
- Table 67: Global Neuroprosthetics Industry Revenue Million Forecast, by Application 2019 & 2032
- Table 68: Global Neuroprosthetics Industry Volume K Unit Forecast, by Application 2019 & 2032
- Table 69: Global Neuroprosthetics Industry Revenue Million Forecast, by Country 2019 & 2032
- Table 70: Global Neuroprosthetics Industry Volume K Unit Forecast, by Country 2019 & 2032
- Table 71: United States Neuroprosthetics Industry Revenue (Million) Forecast, by Application 2019 & 2032
- Table 72: United States Neuroprosthetics Industry Volume (K Unit) Forecast, by Application 2019 & 2032
- Table 73: Canada Neuroprosthetics Industry Revenue (Million) Forecast, by Application 2019 & 2032
- Table 74: Canada Neuroprosthetics Industry Volume (K Unit) Forecast, by Application 2019 & 2032
- Table 75: Mexico Neuroprosthetics Industry Revenue (Million) Forecast, by Application 2019 & 2032
- Table 76: Mexico Neuroprosthetics Industry Volume (K Unit) Forecast, by Application 2019 & 2032
- Table 77: Global Neuroprosthetics Industry Revenue Million Forecast, by Type 2019 & 2032
- Table 78: Global Neuroprosthetics Industry Volume K Unit Forecast, by Type 2019 & 2032
- Table 79: Global Neuroprosthetics Industry Revenue Million Forecast, by Technique 2019 & 2032
- Table 80: Global Neuroprosthetics Industry Volume K Unit Forecast, by Technique 2019 & 2032
- Table 81: Global Neuroprosthetics Industry Revenue Million Forecast, by Application 2019 & 2032
- Table 82: Global Neuroprosthetics Industry Volume K Unit Forecast, by Application 2019 & 2032
- Table 83: Global Neuroprosthetics Industry Revenue Million Forecast, by Country 2019 & 2032
- Table 84: Global Neuroprosthetics Industry Volume K Unit Forecast, by Country 2019 & 2032
- Table 85: Germany Neuroprosthetics Industry Revenue (Million) Forecast, by Application 2019 & 2032
- Table 86: Germany Neuroprosthetics Industry Volume (K Unit) Forecast, by Application 2019 & 2032
- Table 87: United Kingdom Neuroprosthetics Industry Revenue (Million) Forecast, by Application 2019 & 2032
- Table 88: United Kingdom Neuroprosthetics Industry Volume (K Unit) Forecast, by Application 2019 & 2032
- Table 89: France Neuroprosthetics Industry Revenue (Million) Forecast, by Application 2019 & 2032
- Table 90: France Neuroprosthetics Industry Volume (K Unit) Forecast, by Application 2019 & 2032
- Table 91: Italy Neuroprosthetics Industry Revenue (Million) Forecast, by Application 2019 & 2032
- Table 92: Italy Neuroprosthetics Industry Volume (K Unit) Forecast, by Application 2019 & 2032
- Table 93: Spain Neuroprosthetics Industry Revenue (Million) Forecast, by Application 2019 & 2032
- Table 94: Spain Neuroprosthetics Industry Volume (K Unit) Forecast, by Application 2019 & 2032
- Table 95: Rest of Europe Neuroprosthetics Industry Revenue (Million) Forecast, by Application 2019 & 2032
- Table 96: Rest of Europe Neuroprosthetics Industry Volume (K Unit) Forecast, by Application 2019 & 2032
- Table 97: Global Neuroprosthetics Industry Revenue Million Forecast, by Type 2019 & 2032
- Table 98: Global Neuroprosthetics Industry Volume K Unit Forecast, by Type 2019 & 2032
- Table 99: Global Neuroprosthetics Industry Revenue Million Forecast, by Technique 2019 & 2032
- Table 100: Global Neuroprosthetics Industry Volume K Unit Forecast, by Technique 2019 & 2032
- Table 101: Global Neuroprosthetics Industry Revenue Million Forecast, by Application 2019 & 2032
- Table 102: Global Neuroprosthetics Industry Volume K Unit Forecast, by Application 2019 & 2032
- Table 103: Global Neuroprosthetics Industry Revenue Million Forecast, by Country 2019 & 2032
- Table 104: Global Neuroprosthetics Industry Volume K Unit Forecast, by Country 2019 & 2032
- Table 105: China Neuroprosthetics Industry Revenue (Million) Forecast, by Application 2019 & 2032
- Table 106: China Neuroprosthetics Industry Volume (K Unit) Forecast, by Application 2019 & 2032
- Table 107: Japan Neuroprosthetics Industry Revenue (Million) Forecast, by Application 2019 & 2032
- Table 108: Japan Neuroprosthetics Industry Volume (K Unit) Forecast, by Application 2019 & 2032
- Table 109: India Neuroprosthetics Industry Revenue (Million) Forecast, by Application 2019 & 2032
- Table 110: India Neuroprosthetics Industry Volume (K Unit) Forecast, by Application 2019 & 2032
- Table 111: Australia Neuroprosthetics Industry Revenue (Million) Forecast, by Application 2019 & 2032
- Table 112: Australia Neuroprosthetics Industry Volume (K Unit) Forecast, by Application 2019 & 2032
- Table 113: South Korea Neuroprosthetics Industry Revenue (Million) Forecast, by Application 2019 & 2032
- Table 114: South Korea Neuroprosthetics Industry Volume (K Unit) Forecast, by Application 2019 & 2032
- Table 115: Rest of Asia Pacific Neuroprosthetics Industry Revenue (Million) Forecast, by Application 2019 & 2032
- Table 116: Rest of Asia Pacific Neuroprosthetics Industry Volume (K Unit) Forecast, by Application 2019 & 2032
- Table 117: Global Neuroprosthetics Industry Revenue Million Forecast, by Type 2019 & 2032
- Table 118: Global Neuroprosthetics Industry Volume K Unit Forecast, by Type 2019 & 2032
- Table 119: Global Neuroprosthetics Industry Revenue Million Forecast, by Technique 2019 & 2032
- Table 120: Global Neuroprosthetics Industry Volume K Unit Forecast, by Technique 2019 & 2032
- Table 121: Global Neuroprosthetics Industry Revenue Million Forecast, by Application 2019 & 2032
- Table 122: Global Neuroprosthetics Industry Volume K Unit Forecast, by Application 2019 & 2032
- Table 123: Global Neuroprosthetics Industry Revenue Million Forecast, by Country 2019 & 2032
- Table 124: Global Neuroprosthetics Industry Volume K Unit Forecast, by Country 2019 & 2032
- Table 125: GCC Neuroprosthetics Industry Revenue (Million) Forecast, by Application 2019 & 2032
- Table 126: GCC Neuroprosthetics Industry Volume (K Unit) Forecast, by Application 2019 & 2032
- Table 127: South Africa Neuroprosthetics Industry Revenue (Million) Forecast, by Application 2019 & 2032
- Table 128: South Africa Neuroprosthetics Industry Volume (K Unit) Forecast, by Application 2019 & 2032
- Table 129: Rest of Middle East and Africa Neuroprosthetics Industry Revenue (Million) Forecast, by Application 2019 & 2032
- Table 130: Rest of Middle East and Africa Neuroprosthetics Industry Volume (K Unit) Forecast, by Application 2019 & 2032
- Table 131: Global Neuroprosthetics Industry Revenue Million Forecast, by Type 2019 & 2032
- Table 132: Global Neuroprosthetics Industry Volume K Unit Forecast, by Type 2019 & 2032
- Table 133: Global Neuroprosthetics Industry Revenue Million Forecast, by Technique 2019 & 2032
- Table 134: Global Neuroprosthetics Industry Volume K Unit Forecast, by Technique 2019 & 2032
- Table 135: Global Neuroprosthetics Industry Revenue Million Forecast, by Application 2019 & 2032
- Table 136: Global Neuroprosthetics Industry Volume K Unit Forecast, by Application 2019 & 2032
- Table 137: Global Neuroprosthetics Industry Revenue Million Forecast, by Country 2019 & 2032
- Table 138: Global Neuroprosthetics Industry Volume K Unit Forecast, by Country 2019 & 2032
- Table 139: Brazil Neuroprosthetics Industry Revenue (Million) Forecast, by Application 2019 & 2032
- Table 140: Brazil Neuroprosthetics Industry Volume (K Unit) Forecast, by Application 2019 & 2032
- Table 141: Argentina Neuroprosthetics Industry Revenue (Million) Forecast, by Application 2019 & 2032
- Table 142: Argentina Neuroprosthetics Industry Volume (K Unit) Forecast, by Application 2019 & 2032
- Table 143: Rest of South America Neuroprosthetics Industry Revenue (Million) Forecast, by Application 2019 & 2032
- Table 144: Rest of South America Neuroprosthetics Industry Volume (K Unit) Forecast, by Application 2019 & 2032
Frequently Asked Questions
1. What is the projected Compound Annual Growth Rate (CAGR) of the Neuroprosthetics Industry?
The projected CAGR is approximately 11.83%.
2. Which companies are prominent players in the Neuroprosthetics Industry?
Key companies in the market include MED-EL Medical Electronics, Cyberonics Inc, Abbott Laboratories, Medtronic PLC, Sonova Holding AG, LivaNova PLC, Demant AS, Boston Scientific Corporation, Second Sight, Cochlear Limited, BrainGate.
3. What are the main segments of the Neuroprosthetics Industry?
The market segments include Type, Technique, Application.
4. Can you provide details about the market size?
The market size is estimated to be USD 12.01 Million as of 2022.
5. What are some drivers contributing to market growth?
Increasing Number of Patients Suffering from Neurological Disorders and Nerve Injury; Growing Burden of Hearing Loss and Related Defects.
6. What are the notable trends driving market growth?
The Input Neural Prosthetics Segment is Expected to Show a Significant Growth Over the Forecast Period.
7. Are there any restraints impacting market growth?
Availability of Alternative Treatment Options; High Cost of Neuroprosthetics.
8. Can you provide examples of recent developments in the market?
In December 2022, the Government of Saskatchewan through the Ministry of Health and the Saskatchewan Health Authority (SHA), implemented the expanded Cochlear Implant Program to help those who need their external sound processor replaced. Under the new program, individuals will co-pay USD 840 per implant with the Ministry of Health covering the remainder of the cost, which is often USD 8,000 to USD 12,000.
9. What pricing options are available for accessing the report?
Pricing options include single-user, multi-user, and enterprise licenses priced at USD 4750, USD 5250, and USD 8750 respectively.
10. Is the market size provided in terms of value or volume?
The market size is provided in terms of value, measured in Million and volume, measured in K Unit.
11. Are there any specific market keywords associated with the report?
Yes, the market keyword associated with the report is "Neuroprosthetics Industry," which aids in identifying and referencing the specific market segment covered.
12. How do I determine which pricing option suits my needs best?
The pricing options vary based on user requirements and access needs. Individual users may opt for single-user licenses, while businesses requiring broader access may choose multi-user or enterprise licenses for cost-effective access to the report.
13. Are there any additional resources or data provided in the Neuroprosthetics Industry report?
While the report offers comprehensive insights, it's advisable to review the specific contents or supplementary materials provided to ascertain if additional resources or data are available.
14. How can I stay updated on further developments or reports in the Neuroprosthetics Industry?
To stay informed about further developments, trends, and reports in the Neuroprosthetics Industry, consider subscribing to industry newsletters, following relevant companies and organizations, or regularly checking reputable industry news sources and publications.
Methodology
Step 1 - Identification of Relevant Samples Size from Population Database


Step 2 - Approaches for Defining Global Market Size (Value, Volume* & Price*)

Note*: In applicable scenarios
Step 3 - Data Sources
Primary Research
- Web Analytics
- Survey Reports
- Research Institute
- Latest Research Reports
- Opinion Leaders
Secondary Research
- Annual Reports
- White Paper
- Latest Press Release
- Industry Association
- Paid Database
- Investor Presentations

Step 4 - Data Triangulation
Involves using different sources of information in order to increase the validity of a study
These sources are likely to be stakeholders in a program - participants, other researchers, program staff, other community members, and so on.
Then we put all data in single framework & apply various statistical tools to find out the dynamic on the market.
During the analysis stage, feedback from the stakeholder groups would be compared to determine areas of agreement as well as areas of divergence
