

Key Insights
The Next-Generation Sequencing (NGS) services market is experiencing robust growth, projected to reach \$10.47 billion in 2025 and exhibiting a Compound Annual Growth Rate (CAGR) of 13.43% from 2025 to 2033. This expansion is fueled by several key drivers. The increasing prevalence of chronic diseases necessitates advanced diagnostic tools, driving demand for NGS in personalized medicine and drug discovery. Furthermore, the falling cost of sequencing and the rising adoption of genetic screening for early disease detection contribute significantly to market growth. Advancements in sequencing technologies, such as improved accuracy and throughput, are also expanding the applications of NGS across various sectors, including agriculture and animal research. The market is segmented by application (drug discovery, genetic screening, diagnostics, agriculture, etc.), sequencing type (whole genome, targeted resequencing, etc.), product type (instruments, reagents, services), and end-user (hospitals, academics, pharmaceutical companies). The strong presence of established players like Illumina, Thermo Fisher Scientific, and Qiagen, alongside emerging companies, ensures a competitive and innovative landscape. Geographic segmentation reveals significant market opportunities in North America, driven by high healthcare expenditure and technological advancements. However, the Asia-Pacific region is projected to witness the fastest growth due to increasing awareness of genetic diseases and expanding healthcare infrastructure. Regulatory hurdles and data privacy concerns, while posing some restraints, are expected to be mitigated by ongoing technological advancements and regulatory clarifications.
The substantial growth trajectory of the NGS services market is expected to continue throughout the forecast period (2025-2033). Factors like the increasing integration of NGS into routine clinical workflows, ongoing research leading to novel applications, and the expanding utilization in areas beyond human health will further propel market expansion. The competitive landscape is marked by continuous innovation in sequencing technologies, focusing on higher throughput, faster turnaround times, and reduced costs. This drives both market growth and increased accessibility to NGS technologies, making them available to a broader range of researchers and healthcare providers globally. The market's future growth will depend on continued technological advancements, strategic partnerships, and a proactive approach to addressing regulatory and ethical considerations.

Next-Generation Sequencing Services Market: A Comprehensive Report (2019-2033)
This comprehensive report provides an in-depth analysis of the Next-Generation Sequencing (NGS) Services market, encompassing market dynamics, industry trends, key segments, and leading players. Covering the period from 2019 to 2033, with 2025 as the base year, this report offers valuable insights for stakeholders across the NGS ecosystem. The market is projected to reach xx Million by 2033, exhibiting a CAGR of xx% during the forecast period (2025-2033).
Next-Generation Sequencing Services Market Market Concentration & Dynamics
The Next-Generation Sequencing Services market is characterized by a moderately concentrated landscape, with a few major players holding significant market share. Illumina, Thermo Fisher Scientific, and Qiagen are among the dominant players, leveraging their strong technology portfolios and global reach. However, the market also exhibits a dynamic competitive environment with several smaller companies and specialized service providers vying for market share. Innovation is a key driver, with companies continuously investing in R&D to improve sequencing technologies, reduce costs, and expand applications. Regulatory frameworks, particularly those related to clinical diagnostics, play a significant role in shaping market growth and adoption. Substitute technologies are limited, but advancements in other genomic analysis techniques could present future challenges. Consolidation through mergers and acquisitions (M&A) is another key trend, with several significant deals witnessed in recent years, including:
M&A Activity: The number of M&A deals in the NGS services sector has increased steadily over the past five years, averaging xx deals per year. These deals are driven by a need to expand technological capabilities, enhance service offerings, and gain access to new markets.
Market Share: Illumina holds the largest market share (xx%), followed by Thermo Fisher Scientific (xx%) and Qiagen (xx%). The remaining market share is distributed among a number of smaller companies.
End-User Trends: The increasing demand for personalized medicine, rapid advancements in genomic research, and growing investments in healthcare infrastructure are driving the adoption of NGS services across various end-user segments.
Next-Generation Sequencing Services Market Industry Insights & Trends
The global Next-Generation Sequencing Services market is experiencing significant growth, driven by several factors. The increasing prevalence of chronic diseases, rising demand for personalized medicine, and continuous technological advancements are major contributors. The market size was valued at xx Million in 2024 and is projected to reach xx Million by 2033, growing at a CAGR of xx% during the forecast period. Technological disruptions, such as the development of more efficient and cost-effective sequencing platforms, are accelerating market expansion. Evolving consumer behaviors, with increased awareness of genetic testing and personalized healthcare, further fuel market growth. Decreasing sequencing costs and increasing accessibility are also key contributors to the expanding market. The market is further segmented by application, type of sequencing, and end-user, each exhibiting unique growth trajectories.

Key Markets & Segments Leading Next-Generation Sequencing Services Market
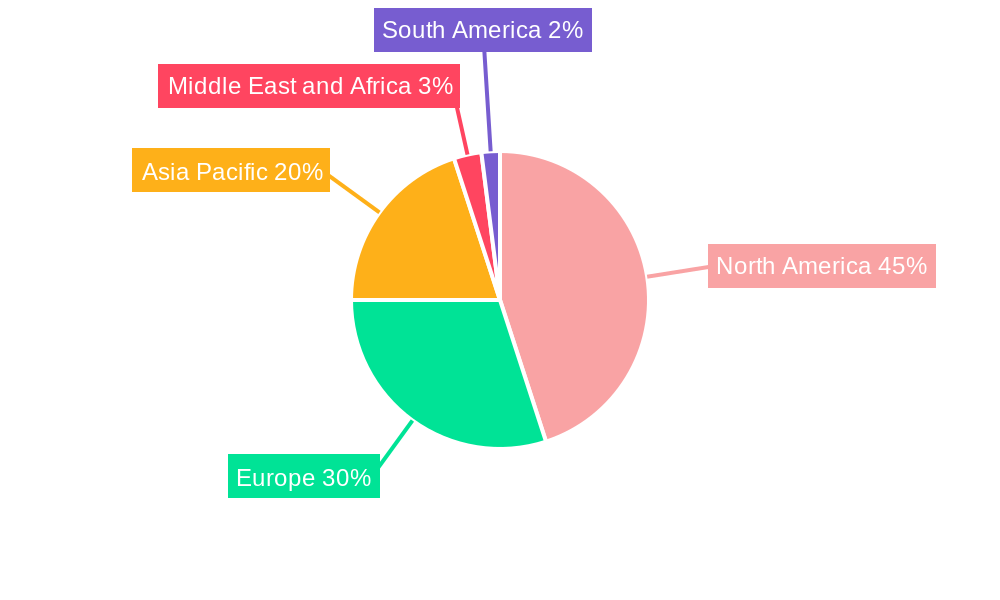
The North American region currently dominates the NGS services market, owing to robust healthcare infrastructure, significant investments in R&D, and the early adoption of advanced technologies. However, the Asia-Pacific region is exhibiting high growth potential due to increasing healthcare expenditure and rising awareness of genetic testing.
Key Growth Drivers:
- Economic Growth: Increased healthcare spending and investment in research and development fuels market growth.
- Technological Advancements: Continuous innovation in sequencing technologies leads to higher throughput, lower costs, and expanded applications.
- Government Initiatives: Regulatory support and funding for genomic research propel market expansion.
- Infrastructure Development: Enhanced healthcare infrastructure improves access to NGS services.
Dominant Segments:
- Application: Drug discovery and personalized medicine currently holds the largest segment share due to increasing demand for targeted therapies and personalized treatment plans.
- Type of Sequencing: Whole genome sequencing is the most widely adopted type of sequencing, followed by whole exome sequencing and targeted resequencing.
- Product Type: The services segment is experiencing significant growth due to the increasing outsourcing of NGS services.
- End-User: Pharmaceutical and biotechnology companies are major users of NGS services, followed by hospitals and healthcare institutions.
Next-Generation Sequencing Services Market Product Developments
Recent product innovations include faster, higher-throughput sequencing platforms (e.g., Illumina's NovaSeq X Series), and automated, integrated NGS systems (e.g., Thermo Fisher Scientific's Ion Torrent Genexus Dx). These advancements reduce sequencing time and cost, enhance data quality, and improve accessibility, driving wider adoption across various applications including clinical diagnostics, drug discovery, and agricultural research. These improvements provide competitive advantages by offering faster turnaround times, increased accuracy, and reduced operational costs.
Challenges in the Next-Generation Sequencing Services Market Market
Significant challenges include stringent regulatory approvals for clinical applications, fluctuations in raw material supply chains potentially affecting reagent costs and availability, and intense competition among established players and emerging companies. These factors influence pricing strategies, market access, and overall profitability. The high cost of NGS services and the need for specialized expertise can also limit market penetration.
Forces Driving Next-Generation Sequencing Services Market Growth
Technological advancements, such as the development of more accurate, faster, and cost-effective sequencing technologies, are a primary growth driver. Increased government funding for genomics research and the growing prevalence of chronic diseases further stimulate market growth. Favorable regulatory environments and increasing adoption of NGS in various applications also contribute to the market's expansion. For example, the partnership between QIAGEN and Helix highlights the potential for expanded NGS applications in companion diagnostics.
Long-Term Growth Catalysts in Next-Generation Sequencing Services Market
Long-term growth will be driven by continuous innovation in sequencing technologies, strategic partnerships fostering technological advancements and market expansion, and the growing integration of NGS into routine clinical workflows. Expansion into new markets, such as those in developing countries with rising healthcare expenditure, and the development of novel applications in areas like agriculture and environmental monitoring, are further catalysts for growth.
Emerging Opportunities in Next-Generation Sequencing Services Market
Emerging opportunities lie in the development of more affordable and accessible NGS technologies, particularly for point-of-care diagnostics. The expansion of NGS applications in areas such as liquid biopsies, microbiome analysis, and single-cell sequencing presents significant growth potential. Furthermore, the integration of AI and machine learning in NGS data analysis will accelerate the translation of genomic information into actionable clinical insights.
Leading Players in the Next-Generation Sequencing Services Market Sector
- DNASTAR Inc
- Bio-Rad Laboratories Inc
- F Hoffmann-La Roche Ltd
- Eurofins Scientific
- Macrogen Inc
- Thermo Fisher Scientific Inc
- Qiagen
- PerkinElmer Inc
- Illumina Inc
- Pacific Biosciences of California Inc
- CD Genomics
- Agilent Technologies
Key Milestones in Next-Generation Sequencing Services Market Industry
- September 2022: Illumina Inc. launched the NovaSeq X Series, significantly increasing sequencing speed and throughput. This launch redefined the industry's capacity and lowered per-genome sequencing costs.
- March 2023: SOPHiA GENETICS partnered with Qiagen, integrating QIAseq reagent technology with the DDM platform, enhancing tumor analysis through NGS and strengthening both companies' market positions.
- January 2023: QIAGEN's strategic partnership with Helix advanced NGS companion diagnostics for hereditary diseases, expanding the clinical application of NGS technology.
- March 2022: Thermo Fisher Scientific launched the Ion Torrent Genexus Dx Integrated Sequencer, an automated NGS platform enabling faster results (within a day), improving efficiency and accessibility.
Strategic Outlook for Next-Generation Sequencing Services Market Market
The Next-Generation Sequencing Services market shows immense potential for continued growth, driven by technological advancements, expanding applications, and increasing demand across diverse sectors. Strategic opportunities include focusing on developing cost-effective solutions, expanding into emerging markets, and forging strategic partnerships to leverage complementary technologies and expertise. Companies focusing on innovation, data analytics, and clinical utility will be best positioned to capture market share in the years to come.
Next-Generation Sequencing Services Market Segmentation
-
1. Type of Sequencing
- 1.1. Whole Genome Sequencing
- 1.2. Targeted Resequencing
- 1.3. Whole Exome Sequencing
- 1.4. RNA Sequencing
- 1.5. CHIP Sequencing
- 1.6. De Novo Sequencing
- 1.7. Methyl Sequencing
-
2. Product Type
- 2.1. Instruments
- 2.2. Reagents and Consumables
- 2.3. Services
-
3. End-User
- 3.1. Hospitals and Healthcare Institutions
- 3.2. Academics
- 3.3. Pharmaceutical and Biotechnology Companies
-
4. Application
- 4.1. Drug Discovery and Personalized Medicine
- 4.2. Genetic Screening
- 4.3. Diagnostics
- 4.4. Agriculture and Animal Research
- 4.5. Other Applications
Next-Generation Sequencing Services Market Segmentation By Geography
-
1. North America
- 1.1. United States
- 1.2. Canada
- 1.3. Mexico
-
2. Europe
- 2.1. Germany
- 2.2. United Kingdom
- 2.3. France
- 2.4. Italy
- 2.5. Spain
- 2.6. Rest of Europe
-
3. Asia Pacific
- 3.1. China
- 3.2. Japan
- 3.3. India
- 3.4. Australia
- 3.5. South Korea
- 3.6. Rest of Asia Pacific
-
4. Middle East and Africa
- 4.1. GCC
- 4.2. South Africa
- 4.3. Rest of Middle East and Africa
-
5. South America
- 5.1. Brazil
- 5.2. Argentina
- 5.3. Rest of South America
Next-Generation Sequencing Services Market REPORT HIGHLIGHTS
| Aspects | Details |
|---|---|
| Study Period | 2019-2033 |
| Base Year | 2024 |
| Estimated Year | 2025 |
| Forecast Period | 2025-2033 |
| Historical Period | 2019-2024 |
| Growth Rate | CAGR of 13.43% from 2019-2033 |
| Segmentation |
|
Table of Contents
- 1. Introduction
- 1.1. Research Scope
- 1.2. Market Segmentation
- 1.3. Research Methodology
- 1.4. Definitions and Assumptions
- 2. Executive Summary
- 2.1. Introduction
- 3. Market Dynamics
- 3.1. Introduction
- 3.2. Market Drivers
- 3.2.1 Increasing Applications in Clinical Diagnosis and Speed
- 3.2.2 Cost
- 3.2.3 and Accuracy; Increasing Efficiency when Compared To Traditional Technologies Such As Microarrays and Rising Drug Discovery Applications
- 3.3. Market Restrains
- 3.3.1. Legal and Ethical Issues; Interpretation of Complex Data and Lack of Skilled Professionals
- 3.4. Market Trends
- 3.4.1. The Whole Genome Sequencing Segment is Expected to Grow at a Significant Rate Over the Forecast Period
- 4. Market Factor Analysis
- 4.1. Porters Five Forces
- 4.2. Supply/Value Chain
- 4.3. PESTEL analysis
- 4.4. Market Entropy
- 4.5. Patent/Trademark Analysis
- 5. Global Next-Generation Sequencing Services Market Analysis, Insights and Forecast, 2019-2031
- 5.1. Market Analysis, Insights and Forecast - by Type of Sequencing
- 5.1.1. Whole Genome Sequencing
- 5.1.2. Targeted Resequencing
- 5.1.3. Whole Exome Sequencing
- 5.1.4. RNA Sequencing
- 5.1.5. CHIP Sequencing
- 5.1.6. De Novo Sequencing
- 5.1.7. Methyl Sequencing
- 5.2. Market Analysis, Insights and Forecast - by Product Type
- 5.2.1. Instruments
- 5.2.2. Reagents and Consumables
- 5.2.3. Services
- 5.3. Market Analysis, Insights and Forecast - by End-User
- 5.3.1. Hospitals and Healthcare Institutions
- 5.3.2. Academics
- 5.3.3. Pharmaceutical and Biotechnology Companies
- 5.4. Market Analysis, Insights and Forecast - by Application
- 5.4.1. Drug Discovery and Personalized Medicine
- 5.4.2. Genetic Screening
- 5.4.3. Diagnostics
- 5.4.4. Agriculture and Animal Research
- 5.4.5. Other Applications
- 5.5. Market Analysis, Insights and Forecast - by Region
- 5.5.1. North America
- 5.5.2. Europe
- 5.5.3. Asia Pacific
- 5.5.4. Middle East and Africa
- 5.5.5. South America
- 5.1. Market Analysis, Insights and Forecast - by Type of Sequencing
- 6. North America Next-Generation Sequencing Services Market Analysis, Insights and Forecast, 2019-2031
- 6.1. Market Analysis, Insights and Forecast - by Type of Sequencing
- 6.1.1. Whole Genome Sequencing
- 6.1.2. Targeted Resequencing
- 6.1.3. Whole Exome Sequencing
- 6.1.4. RNA Sequencing
- 6.1.5. CHIP Sequencing
- 6.1.6. De Novo Sequencing
- 6.1.7. Methyl Sequencing
- 6.2. Market Analysis, Insights and Forecast - by Product Type
- 6.2.1. Instruments
- 6.2.2. Reagents and Consumables
- 6.2.3. Services
- 6.3. Market Analysis, Insights and Forecast - by End-User
- 6.3.1. Hospitals and Healthcare Institutions
- 6.3.2. Academics
- 6.3.3. Pharmaceutical and Biotechnology Companies
- 6.4. Market Analysis, Insights and Forecast - by Application
- 6.4.1. Drug Discovery and Personalized Medicine
- 6.4.2. Genetic Screening
- 6.4.3. Diagnostics
- 6.4.4. Agriculture and Animal Research
- 6.4.5. Other Applications
- 6.1. Market Analysis, Insights and Forecast - by Type of Sequencing
- 7. Europe Next-Generation Sequencing Services Market Analysis, Insights and Forecast, 2019-2031
- 7.1. Market Analysis, Insights and Forecast - by Type of Sequencing
- 7.1.1. Whole Genome Sequencing
- 7.1.2. Targeted Resequencing
- 7.1.3. Whole Exome Sequencing
- 7.1.4. RNA Sequencing
- 7.1.5. CHIP Sequencing
- 7.1.6. De Novo Sequencing
- 7.1.7. Methyl Sequencing
- 7.2. Market Analysis, Insights and Forecast - by Product Type
- 7.2.1. Instruments
- 7.2.2. Reagents and Consumables
- 7.2.3. Services
- 7.3. Market Analysis, Insights and Forecast - by End-User
- 7.3.1. Hospitals and Healthcare Institutions
- 7.3.2. Academics
- 7.3.3. Pharmaceutical and Biotechnology Companies
- 7.4. Market Analysis, Insights and Forecast - by Application
- 7.4.1. Drug Discovery and Personalized Medicine
- 7.4.2. Genetic Screening
- 7.4.3. Diagnostics
- 7.4.4. Agriculture and Animal Research
- 7.4.5. Other Applications
- 7.1. Market Analysis, Insights and Forecast - by Type of Sequencing
- 8. Asia Pacific Next-Generation Sequencing Services Market Analysis, Insights and Forecast, 2019-2031
- 8.1. Market Analysis, Insights and Forecast - by Type of Sequencing
- 8.1.1. Whole Genome Sequencing
- 8.1.2. Targeted Resequencing
- 8.1.3. Whole Exome Sequencing
- 8.1.4. RNA Sequencing
- 8.1.5. CHIP Sequencing
- 8.1.6. De Novo Sequencing
- 8.1.7. Methyl Sequencing
- 8.2. Market Analysis, Insights and Forecast - by Product Type
- 8.2.1. Instruments
- 8.2.2. Reagents and Consumables
- 8.2.3. Services
- 8.3. Market Analysis, Insights and Forecast - by End-User
- 8.3.1. Hospitals and Healthcare Institutions
- 8.3.2. Academics
- 8.3.3. Pharmaceutical and Biotechnology Companies
- 8.4. Market Analysis, Insights and Forecast - by Application
- 8.4.1. Drug Discovery and Personalized Medicine
- 8.4.2. Genetic Screening
- 8.4.3. Diagnostics
- 8.4.4. Agriculture and Animal Research
- 8.4.5. Other Applications
- 8.1. Market Analysis, Insights and Forecast - by Type of Sequencing
- 9. Middle East and Africa Next-Generation Sequencing Services Market Analysis, Insights and Forecast, 2019-2031
- 9.1. Market Analysis, Insights and Forecast - by Type of Sequencing
- 9.1.1. Whole Genome Sequencing
- 9.1.2. Targeted Resequencing
- 9.1.3. Whole Exome Sequencing
- 9.1.4. RNA Sequencing
- 9.1.5. CHIP Sequencing
- 9.1.6. De Novo Sequencing
- 9.1.7. Methyl Sequencing
- 9.2. Market Analysis, Insights and Forecast - by Product Type
- 9.2.1. Instruments
- 9.2.2. Reagents and Consumables
- 9.2.3. Services
- 9.3. Market Analysis, Insights and Forecast - by End-User
- 9.3.1. Hospitals and Healthcare Institutions
- 9.3.2. Academics
- 9.3.3. Pharmaceutical and Biotechnology Companies
- 9.4. Market Analysis, Insights and Forecast - by Application
- 9.4.1. Drug Discovery and Personalized Medicine
- 9.4.2. Genetic Screening
- 9.4.3. Diagnostics
- 9.4.4. Agriculture and Animal Research
- 9.4.5. Other Applications
- 9.1. Market Analysis, Insights and Forecast - by Type of Sequencing
- 10. South America Next-Generation Sequencing Services Market Analysis, Insights and Forecast, 2019-2031
- 10.1. Market Analysis, Insights and Forecast - by Type of Sequencing
- 10.1.1. Whole Genome Sequencing
- 10.1.2. Targeted Resequencing
- 10.1.3. Whole Exome Sequencing
- 10.1.4. RNA Sequencing
- 10.1.5. CHIP Sequencing
- 10.1.6. De Novo Sequencing
- 10.1.7. Methyl Sequencing
- 10.2. Market Analysis, Insights and Forecast - by Product Type
- 10.2.1. Instruments
- 10.2.2. Reagents and Consumables
- 10.2.3. Services
- 10.3. Market Analysis, Insights and Forecast - by End-User
- 10.3.1. Hospitals and Healthcare Institutions
- 10.3.2. Academics
- 10.3.3. Pharmaceutical and Biotechnology Companies
- 10.4. Market Analysis, Insights and Forecast - by Application
- 10.4.1. Drug Discovery and Personalized Medicine
- 10.4.2. Genetic Screening
- 10.4.3. Diagnostics
- 10.4.4. Agriculture and Animal Research
- 10.4.5. Other Applications
- 10.1. Market Analysis, Insights and Forecast - by Type of Sequencing
- 11. North America Next-Generation Sequencing Services Market Analysis, Insights and Forecast, 2019-2031
- 11.1. Market Analysis, Insights and Forecast - By Country/Sub-region
- 11.1.1 United States
- 11.1.2 Canada
- 11.1.3 Mexico
- 12. Europe Next-Generation Sequencing Services Market Analysis, Insights and Forecast, 2019-2031
- 12.1. Market Analysis, Insights and Forecast - By Country/Sub-region
- 12.1.1 Germany
- 12.1.2 United Kingdom
- 12.1.3 France
- 12.1.4 Italy
- 12.1.5 Spain
- 12.1.6 Rest of Europe
- 13. Asia Pacific Next-Generation Sequencing Services Market Analysis, Insights and Forecast, 2019-2031
- 13.1. Market Analysis, Insights and Forecast - By Country/Sub-region
- 13.1.1 China
- 13.1.2 Japan
- 13.1.3 India
- 13.1.4 Australia
- 13.1.5 South Korea
- 13.1.6 Rest of Asia Pacific
- 14. Middle East and Africa Next-Generation Sequencing Services Market Analysis, Insights and Forecast, 2019-2031
- 14.1. Market Analysis, Insights and Forecast - By Country/Sub-region
- 14.1.1 GCC
- 14.1.2 South Africa
- 14.1.3 Rest of Middle East and Africa
- 15. South America Next-Generation Sequencing Services Market Analysis, Insights and Forecast, 2019-2031
- 15.1. Market Analysis, Insights and Forecast - By Country/Sub-region
- 15.1.1 Brazil
- 15.1.2 Argentina
- 15.1.3 Rest of South America
- 16. Competitive Analysis
- 16.1. Global Market Share Analysis 2024
- 16.2. Company Profiles
- 16.2.1 DNASTAR Inc
- 16.2.1.1. Overview
- 16.2.1.2. Products
- 16.2.1.3. SWOT Analysis
- 16.2.1.4. Recent Developments
- 16.2.1.5. Financials (Based on Availability)
- 16.2.2 Bio-Rad Laboratories Inc
- 16.2.2.1. Overview
- 16.2.2.2. Products
- 16.2.2.3. SWOT Analysis
- 16.2.2.4. Recent Developments
- 16.2.2.5. Financials (Based on Availability)
- 16.2.3 F Hoffmann-La Roche Ltd
- 16.2.3.1. Overview
- 16.2.3.2. Products
- 16.2.3.3. SWOT Analysis
- 16.2.3.4. Recent Developments
- 16.2.3.5. Financials (Based on Availability)
- 16.2.4 Eurofins Scientific
- 16.2.4.1. Overview
- 16.2.4.2. Products
- 16.2.4.3. SWOT Analysis
- 16.2.4.4. Recent Developments
- 16.2.4.5. Financials (Based on Availability)
- 16.2.5 Macrogen Inc
- 16.2.5.1. Overview
- 16.2.5.2. Products
- 16.2.5.3. SWOT Analysis
- 16.2.5.4. Recent Developments
- 16.2.5.5. Financials (Based on Availability)
- 16.2.6 Thermo Fisher Scientific Inc
- 16.2.6.1. Overview
- 16.2.6.2. Products
- 16.2.6.3. SWOT Analysis
- 16.2.6.4. Recent Developments
- 16.2.6.5. Financials (Based on Availability)
- 16.2.7 Qiagen
- 16.2.7.1. Overview
- 16.2.7.2. Products
- 16.2.7.3. SWOT Analysis
- 16.2.7.4. Recent Developments
- 16.2.7.5. Financials (Based on Availability)
- 16.2.8 PerkinElmer Inc
- 16.2.8.1. Overview
- 16.2.8.2. Products
- 16.2.8.3. SWOT Analysis
- 16.2.8.4. Recent Developments
- 16.2.8.5. Financials (Based on Availability)
- 16.2.9 Illumina Inc
- 16.2.9.1. Overview
- 16.2.9.2. Products
- 16.2.9.3. SWOT Analysis
- 16.2.9.4. Recent Developments
- 16.2.9.5. Financials (Based on Availability)
- 16.2.10 Pacific Biosciences of California Inc
- 16.2.10.1. Overview
- 16.2.10.2. Products
- 16.2.10.3. SWOT Analysis
- 16.2.10.4. Recent Developments
- 16.2.10.5. Financials (Based on Availability)
- 16.2.11 CD Genomics
- 16.2.11.1. Overview
- 16.2.11.2. Products
- 16.2.11.3. SWOT Analysis
- 16.2.11.4. Recent Developments
- 16.2.11.5. Financials (Based on Availability)
- 16.2.12 Agilent Technologies
- 16.2.12.1. Overview
- 16.2.12.2. Products
- 16.2.12.3. SWOT Analysis
- 16.2.12.4. Recent Developments
- 16.2.12.5. Financials (Based on Availability)
- 16.2.1 DNASTAR Inc
List of Figures
- Figure 1: Global Next-Generation Sequencing Services Market Revenue Breakdown (Million, %) by Region 2024 & 2032
- Figure 2: Global Next-Generation Sequencing Services Market Volume Breakdown (K Units, %) by Region 2024 & 2032
- Figure 3: North America Next-Generation Sequencing Services Market Revenue (Million), by Country 2024 & 2032
- Figure 4: North America Next-Generation Sequencing Services Market Volume (K Units), by Country 2024 & 2032
- Figure 5: North America Next-Generation Sequencing Services Market Revenue Share (%), by Country 2024 & 2032
- Figure 6: North America Next-Generation Sequencing Services Market Volume Share (%), by Country 2024 & 2032
- Figure 7: Europe Next-Generation Sequencing Services Market Revenue (Million), by Country 2024 & 2032
- Figure 8: Europe Next-Generation Sequencing Services Market Volume (K Units), by Country 2024 & 2032
- Figure 9: Europe Next-Generation Sequencing Services Market Revenue Share (%), by Country 2024 & 2032
- Figure 10: Europe Next-Generation Sequencing Services Market Volume Share (%), by Country 2024 & 2032
- Figure 11: Asia Pacific Next-Generation Sequencing Services Market Revenue (Million), by Country 2024 & 2032
- Figure 12: Asia Pacific Next-Generation Sequencing Services Market Volume (K Units), by Country 2024 & 2032
- Figure 13: Asia Pacific Next-Generation Sequencing Services Market Revenue Share (%), by Country 2024 & 2032
- Figure 14: Asia Pacific Next-Generation Sequencing Services Market Volume Share (%), by Country 2024 & 2032
- Figure 15: Middle East and Africa Next-Generation Sequencing Services Market Revenue (Million), by Country 2024 & 2032
- Figure 16: Middle East and Africa Next-Generation Sequencing Services Market Volume (K Units), by Country 2024 & 2032
- Figure 17: Middle East and Africa Next-Generation Sequencing Services Market Revenue Share (%), by Country 2024 & 2032
- Figure 18: Middle East and Africa Next-Generation Sequencing Services Market Volume Share (%), by Country 2024 & 2032
- Figure 19: South America Next-Generation Sequencing Services Market Revenue (Million), by Country 2024 & 2032
- Figure 20: South America Next-Generation Sequencing Services Market Volume (K Units), by Country 2024 & 2032
- Figure 21: South America Next-Generation Sequencing Services Market Revenue Share (%), by Country 2024 & 2032
- Figure 22: South America Next-Generation Sequencing Services Market Volume Share (%), by Country 2024 & 2032
- Figure 23: North America Next-Generation Sequencing Services Market Revenue (Million), by Type of Sequencing 2024 & 2032
- Figure 24: North America Next-Generation Sequencing Services Market Volume (K Units), by Type of Sequencing 2024 & 2032
- Figure 25: North America Next-Generation Sequencing Services Market Revenue Share (%), by Type of Sequencing 2024 & 2032
- Figure 26: North America Next-Generation Sequencing Services Market Volume Share (%), by Type of Sequencing 2024 & 2032
- Figure 27: North America Next-Generation Sequencing Services Market Revenue (Million), by Product Type 2024 & 2032
- Figure 28: North America Next-Generation Sequencing Services Market Volume (K Units), by Product Type 2024 & 2032
- Figure 29: North America Next-Generation Sequencing Services Market Revenue Share (%), by Product Type 2024 & 2032
- Figure 30: North America Next-Generation Sequencing Services Market Volume Share (%), by Product Type 2024 & 2032
- Figure 31: North America Next-Generation Sequencing Services Market Revenue (Million), by End-User 2024 & 2032
- Figure 32: North America Next-Generation Sequencing Services Market Volume (K Units), by End-User 2024 & 2032
- Figure 33: North America Next-Generation Sequencing Services Market Revenue Share (%), by End-User 2024 & 2032
- Figure 34: North America Next-Generation Sequencing Services Market Volume Share (%), by End-User 2024 & 2032
- Figure 35: North America Next-Generation Sequencing Services Market Revenue (Million), by Application 2024 & 2032
- Figure 36: North America Next-Generation Sequencing Services Market Volume (K Units), by Application 2024 & 2032
- Figure 37: North America Next-Generation Sequencing Services Market Revenue Share (%), by Application 2024 & 2032
- Figure 38: North America Next-Generation Sequencing Services Market Volume Share (%), by Application 2024 & 2032
- Figure 39: North America Next-Generation Sequencing Services Market Revenue (Million), by Country 2024 & 2032
- Figure 40: North America Next-Generation Sequencing Services Market Volume (K Units), by Country 2024 & 2032
- Figure 41: North America Next-Generation Sequencing Services Market Revenue Share (%), by Country 2024 & 2032
- Figure 42: North America Next-Generation Sequencing Services Market Volume Share (%), by Country 2024 & 2032
- Figure 43: Europe Next-Generation Sequencing Services Market Revenue (Million), by Type of Sequencing 2024 & 2032
- Figure 44: Europe Next-Generation Sequencing Services Market Volume (K Units), by Type of Sequencing 2024 & 2032
- Figure 45: Europe Next-Generation Sequencing Services Market Revenue Share (%), by Type of Sequencing 2024 & 2032
- Figure 46: Europe Next-Generation Sequencing Services Market Volume Share (%), by Type of Sequencing 2024 & 2032
- Figure 47: Europe Next-Generation Sequencing Services Market Revenue (Million), by Product Type 2024 & 2032
- Figure 48: Europe Next-Generation Sequencing Services Market Volume (K Units), by Product Type 2024 & 2032
- Figure 49: Europe Next-Generation Sequencing Services Market Revenue Share (%), by Product Type 2024 & 2032
- Figure 50: Europe Next-Generation Sequencing Services Market Volume Share (%), by Product Type 2024 & 2032
- Figure 51: Europe Next-Generation Sequencing Services Market Revenue (Million), by End-User 2024 & 2032
- Figure 52: Europe Next-Generation Sequencing Services Market Volume (K Units), by End-User 2024 & 2032
- Figure 53: Europe Next-Generation Sequencing Services Market Revenue Share (%), by End-User 2024 & 2032
- Figure 54: Europe Next-Generation Sequencing Services Market Volume Share (%), by End-User 2024 & 2032
- Figure 55: Europe Next-Generation Sequencing Services Market Revenue (Million), by Application 2024 & 2032
- Figure 56: Europe Next-Generation Sequencing Services Market Volume (K Units), by Application 2024 & 2032
- Figure 57: Europe Next-Generation Sequencing Services Market Revenue Share (%), by Application 2024 & 2032
- Figure 58: Europe Next-Generation Sequencing Services Market Volume Share (%), by Application 2024 & 2032
- Figure 59: Europe Next-Generation Sequencing Services Market Revenue (Million), by Country 2024 & 2032
- Figure 60: Europe Next-Generation Sequencing Services Market Volume (K Units), by Country 2024 & 2032
- Figure 61: Europe Next-Generation Sequencing Services Market Revenue Share (%), by Country 2024 & 2032
- Figure 62: Europe Next-Generation Sequencing Services Market Volume Share (%), by Country 2024 & 2032
- Figure 63: Asia Pacific Next-Generation Sequencing Services Market Revenue (Million), by Type of Sequencing 2024 & 2032
- Figure 64: Asia Pacific Next-Generation Sequencing Services Market Volume (K Units), by Type of Sequencing 2024 & 2032
- Figure 65: Asia Pacific Next-Generation Sequencing Services Market Revenue Share (%), by Type of Sequencing 2024 & 2032
- Figure 66: Asia Pacific Next-Generation Sequencing Services Market Volume Share (%), by Type of Sequencing 2024 & 2032
- Figure 67: Asia Pacific Next-Generation Sequencing Services Market Revenue (Million), by Product Type 2024 & 2032
- Figure 68: Asia Pacific Next-Generation Sequencing Services Market Volume (K Units), by Product Type 2024 & 2032
- Figure 69: Asia Pacific Next-Generation Sequencing Services Market Revenue Share (%), by Product Type 2024 & 2032
- Figure 70: Asia Pacific Next-Generation Sequencing Services Market Volume Share (%), by Product Type 2024 & 2032
- Figure 71: Asia Pacific Next-Generation Sequencing Services Market Revenue (Million), by End-User 2024 & 2032
- Figure 72: Asia Pacific Next-Generation Sequencing Services Market Volume (K Units), by End-User 2024 & 2032
- Figure 73: Asia Pacific Next-Generation Sequencing Services Market Revenue Share (%), by End-User 2024 & 2032
- Figure 74: Asia Pacific Next-Generation Sequencing Services Market Volume Share (%), by End-User 2024 & 2032
- Figure 75: Asia Pacific Next-Generation Sequencing Services Market Revenue (Million), by Application 2024 & 2032
- Figure 76: Asia Pacific Next-Generation Sequencing Services Market Volume (K Units), by Application 2024 & 2032
- Figure 77: Asia Pacific Next-Generation Sequencing Services Market Revenue Share (%), by Application 2024 & 2032
- Figure 78: Asia Pacific Next-Generation Sequencing Services Market Volume Share (%), by Application 2024 & 2032
- Figure 79: Asia Pacific Next-Generation Sequencing Services Market Revenue (Million), by Country 2024 & 2032
- Figure 80: Asia Pacific Next-Generation Sequencing Services Market Volume (K Units), by Country 2024 & 2032
- Figure 81: Asia Pacific Next-Generation Sequencing Services Market Revenue Share (%), by Country 2024 & 2032
- Figure 82: Asia Pacific Next-Generation Sequencing Services Market Volume Share (%), by Country 2024 & 2032
- Figure 83: Middle East and Africa Next-Generation Sequencing Services Market Revenue (Million), by Type of Sequencing 2024 & 2032
- Figure 84: Middle East and Africa Next-Generation Sequencing Services Market Volume (K Units), by Type of Sequencing 2024 & 2032
- Figure 85: Middle East and Africa Next-Generation Sequencing Services Market Revenue Share (%), by Type of Sequencing 2024 & 2032
- Figure 86: Middle East and Africa Next-Generation Sequencing Services Market Volume Share (%), by Type of Sequencing 2024 & 2032
- Figure 87: Middle East and Africa Next-Generation Sequencing Services Market Revenue (Million), by Product Type 2024 & 2032
- Figure 88: Middle East and Africa Next-Generation Sequencing Services Market Volume (K Units), by Product Type 2024 & 2032
- Figure 89: Middle East and Africa Next-Generation Sequencing Services Market Revenue Share (%), by Product Type 2024 & 2032
- Figure 90: Middle East and Africa Next-Generation Sequencing Services Market Volume Share (%), by Product Type 2024 & 2032
- Figure 91: Middle East and Africa Next-Generation Sequencing Services Market Revenue (Million), by End-User 2024 & 2032
- Figure 92: Middle East and Africa Next-Generation Sequencing Services Market Volume (K Units), by End-User 2024 & 2032
- Figure 93: Middle East and Africa Next-Generation Sequencing Services Market Revenue Share (%), by End-User 2024 & 2032
- Figure 94: Middle East and Africa Next-Generation Sequencing Services Market Volume Share (%), by End-User 2024 & 2032
- Figure 95: Middle East and Africa Next-Generation Sequencing Services Market Revenue (Million), by Application 2024 & 2032
- Figure 96: Middle East and Africa Next-Generation Sequencing Services Market Volume (K Units), by Application 2024 & 2032
- Figure 97: Middle East and Africa Next-Generation Sequencing Services Market Revenue Share (%), by Application 2024 & 2032
- Figure 98: Middle East and Africa Next-Generation Sequencing Services Market Volume Share (%), by Application 2024 & 2032
- Figure 99: Middle East and Africa Next-Generation Sequencing Services Market Revenue (Million), by Country 2024 & 2032
- Figure 100: Middle East and Africa Next-Generation Sequencing Services Market Volume (K Units), by Country 2024 & 2032
- Figure 101: Middle East and Africa Next-Generation Sequencing Services Market Revenue Share (%), by Country 2024 & 2032
- Figure 102: Middle East and Africa Next-Generation Sequencing Services Market Volume Share (%), by Country 2024 & 2032
- Figure 103: South America Next-Generation Sequencing Services Market Revenue (Million), by Type of Sequencing 2024 & 2032
- Figure 104: South America Next-Generation Sequencing Services Market Volume (K Units), by Type of Sequencing 2024 & 2032
- Figure 105: South America Next-Generation Sequencing Services Market Revenue Share (%), by Type of Sequencing 2024 & 2032
- Figure 106: South America Next-Generation Sequencing Services Market Volume Share (%), by Type of Sequencing 2024 & 2032
- Figure 107: South America Next-Generation Sequencing Services Market Revenue (Million), by Product Type 2024 & 2032
- Figure 108: South America Next-Generation Sequencing Services Market Volume (K Units), by Product Type 2024 & 2032
- Figure 109: South America Next-Generation Sequencing Services Market Revenue Share (%), by Product Type 2024 & 2032
- Figure 110: South America Next-Generation Sequencing Services Market Volume Share (%), by Product Type 2024 & 2032
- Figure 111: South America Next-Generation Sequencing Services Market Revenue (Million), by End-User 2024 & 2032
- Figure 112: South America Next-Generation Sequencing Services Market Volume (K Units), by End-User 2024 & 2032
- Figure 113: South America Next-Generation Sequencing Services Market Revenue Share (%), by End-User 2024 & 2032
- Figure 114: South America Next-Generation Sequencing Services Market Volume Share (%), by End-User 2024 & 2032
- Figure 115: South America Next-Generation Sequencing Services Market Revenue (Million), by Application 2024 & 2032
- Figure 116: South America Next-Generation Sequencing Services Market Volume (K Units), by Application 2024 & 2032
- Figure 117: South America Next-Generation Sequencing Services Market Revenue Share (%), by Application 2024 & 2032
- Figure 118: South America Next-Generation Sequencing Services Market Volume Share (%), by Application 2024 & 2032
- Figure 119: South America Next-Generation Sequencing Services Market Revenue (Million), by Country 2024 & 2032
- Figure 120: South America Next-Generation Sequencing Services Market Volume (K Units), by Country 2024 & 2032
- Figure 121: South America Next-Generation Sequencing Services Market Revenue Share (%), by Country 2024 & 2032
- Figure 122: South America Next-Generation Sequencing Services Market Volume Share (%), by Country 2024 & 2032
List of Tables
- Table 1: Global Next-Generation Sequencing Services Market Revenue Million Forecast, by Region 2019 & 2032
- Table 2: Global Next-Generation Sequencing Services Market Volume K Units Forecast, by Region 2019 & 2032
- Table 3: Global Next-Generation Sequencing Services Market Revenue Million Forecast, by Type of Sequencing 2019 & 2032
- Table 4: Global Next-Generation Sequencing Services Market Volume K Units Forecast, by Type of Sequencing 2019 & 2032
- Table 5: Global Next-Generation Sequencing Services Market Revenue Million Forecast, by Product Type 2019 & 2032
- Table 6: Global Next-Generation Sequencing Services Market Volume K Units Forecast, by Product Type 2019 & 2032
- Table 7: Global Next-Generation Sequencing Services Market Revenue Million Forecast, by End-User 2019 & 2032
- Table 8: Global Next-Generation Sequencing Services Market Volume K Units Forecast, by End-User 2019 & 2032
- Table 9: Global Next-Generation Sequencing Services Market Revenue Million Forecast, by Application 2019 & 2032
- Table 10: Global Next-Generation Sequencing Services Market Volume K Units Forecast, by Application 2019 & 2032
- Table 11: Global Next-Generation Sequencing Services Market Revenue Million Forecast, by Region 2019 & 2032
- Table 12: Global Next-Generation Sequencing Services Market Volume K Units Forecast, by Region 2019 & 2032
- Table 13: Global Next-Generation Sequencing Services Market Revenue Million Forecast, by Country 2019 & 2032
- Table 14: Global Next-Generation Sequencing Services Market Volume K Units Forecast, by Country 2019 & 2032
- Table 15: United States Next-Generation Sequencing Services Market Revenue (Million) Forecast, by Application 2019 & 2032
- Table 16: United States Next-Generation Sequencing Services Market Volume (K Units) Forecast, by Application 2019 & 2032
- Table 17: Canada Next-Generation Sequencing Services Market Revenue (Million) Forecast, by Application 2019 & 2032
- Table 18: Canada Next-Generation Sequencing Services Market Volume (K Units) Forecast, by Application 2019 & 2032
- Table 19: Mexico Next-Generation Sequencing Services Market Revenue (Million) Forecast, by Application 2019 & 2032
- Table 20: Mexico Next-Generation Sequencing Services Market Volume (K Units) Forecast, by Application 2019 & 2032
- Table 21: Global Next-Generation Sequencing Services Market Revenue Million Forecast, by Country 2019 & 2032
- Table 22: Global Next-Generation Sequencing Services Market Volume K Units Forecast, by Country 2019 & 2032
- Table 23: Germany Next-Generation Sequencing Services Market Revenue (Million) Forecast, by Application 2019 & 2032
- Table 24: Germany Next-Generation Sequencing Services Market Volume (K Units) Forecast, by Application 2019 & 2032
- Table 25: United Kingdom Next-Generation Sequencing Services Market Revenue (Million) Forecast, by Application 2019 & 2032
- Table 26: United Kingdom Next-Generation Sequencing Services Market Volume (K Units) Forecast, by Application 2019 & 2032
- Table 27: France Next-Generation Sequencing Services Market Revenue (Million) Forecast, by Application 2019 & 2032
- Table 28: France Next-Generation Sequencing Services Market Volume (K Units) Forecast, by Application 2019 & 2032
- Table 29: Italy Next-Generation Sequencing Services Market Revenue (Million) Forecast, by Application 2019 & 2032
- Table 30: Italy Next-Generation Sequencing Services Market Volume (K Units) Forecast, by Application 2019 & 2032
- Table 31: Spain Next-Generation Sequencing Services Market Revenue (Million) Forecast, by Application 2019 & 2032
- Table 32: Spain Next-Generation Sequencing Services Market Volume (K Units) Forecast, by Application 2019 & 2032
- Table 33: Rest of Europe Next-Generation Sequencing Services Market Revenue (Million) Forecast, by Application 2019 & 2032
- Table 34: Rest of Europe Next-Generation Sequencing Services Market Volume (K Units) Forecast, by Application 2019 & 2032
- Table 35: Global Next-Generation Sequencing Services Market Revenue Million Forecast, by Country 2019 & 2032
- Table 36: Global Next-Generation Sequencing Services Market Volume K Units Forecast, by Country 2019 & 2032
- Table 37: China Next-Generation Sequencing Services Market Revenue (Million) Forecast, by Application 2019 & 2032
- Table 38: China Next-Generation Sequencing Services Market Volume (K Units) Forecast, by Application 2019 & 2032
- Table 39: Japan Next-Generation Sequencing Services Market Revenue (Million) Forecast, by Application 2019 & 2032
- Table 40: Japan Next-Generation Sequencing Services Market Volume (K Units) Forecast, by Application 2019 & 2032
- Table 41: India Next-Generation Sequencing Services Market Revenue (Million) Forecast, by Application 2019 & 2032
- Table 42: India Next-Generation Sequencing Services Market Volume (K Units) Forecast, by Application 2019 & 2032
- Table 43: Australia Next-Generation Sequencing Services Market Revenue (Million) Forecast, by Application 2019 & 2032
- Table 44: Australia Next-Generation Sequencing Services Market Volume (K Units) Forecast, by Application 2019 & 2032
- Table 45: South Korea Next-Generation Sequencing Services Market Revenue (Million) Forecast, by Application 2019 & 2032
- Table 46: South Korea Next-Generation Sequencing Services Market Volume (K Units) Forecast, by Application 2019 & 2032
- Table 47: Rest of Asia Pacific Next-Generation Sequencing Services Market Revenue (Million) Forecast, by Application 2019 & 2032
- Table 48: Rest of Asia Pacific Next-Generation Sequencing Services Market Volume (K Units) Forecast, by Application 2019 & 2032
- Table 49: Global Next-Generation Sequencing Services Market Revenue Million Forecast, by Country 2019 & 2032
- Table 50: Global Next-Generation Sequencing Services Market Volume K Units Forecast, by Country 2019 & 2032
- Table 51: GCC Next-Generation Sequencing Services Market Revenue (Million) Forecast, by Application 2019 & 2032
- Table 52: GCC Next-Generation Sequencing Services Market Volume (K Units) Forecast, by Application 2019 & 2032
- Table 53: South Africa Next-Generation Sequencing Services Market Revenue (Million) Forecast, by Application 2019 & 2032
- Table 54: South Africa Next-Generation Sequencing Services Market Volume (K Units) Forecast, by Application 2019 & 2032
- Table 55: Rest of Middle East and Africa Next-Generation Sequencing Services Market Revenue (Million) Forecast, by Application 2019 & 2032
- Table 56: Rest of Middle East and Africa Next-Generation Sequencing Services Market Volume (K Units) Forecast, by Application 2019 & 2032
- Table 57: Global Next-Generation Sequencing Services Market Revenue Million Forecast, by Country 2019 & 2032
- Table 58: Global Next-Generation Sequencing Services Market Volume K Units Forecast, by Country 2019 & 2032
- Table 59: Brazil Next-Generation Sequencing Services Market Revenue (Million) Forecast, by Application 2019 & 2032
- Table 60: Brazil Next-Generation Sequencing Services Market Volume (K Units) Forecast, by Application 2019 & 2032
- Table 61: Argentina Next-Generation Sequencing Services Market Revenue (Million) Forecast, by Application 2019 & 2032
- Table 62: Argentina Next-Generation Sequencing Services Market Volume (K Units) Forecast, by Application 2019 & 2032
- Table 63: Rest of South America Next-Generation Sequencing Services Market Revenue (Million) Forecast, by Application 2019 & 2032
- Table 64: Rest of South America Next-Generation Sequencing Services Market Volume (K Units) Forecast, by Application 2019 & 2032
- Table 65: Global Next-Generation Sequencing Services Market Revenue Million Forecast, by Type of Sequencing 2019 & 2032
- Table 66: Global Next-Generation Sequencing Services Market Volume K Units Forecast, by Type of Sequencing 2019 & 2032
- Table 67: Global Next-Generation Sequencing Services Market Revenue Million Forecast, by Product Type 2019 & 2032
- Table 68: Global Next-Generation Sequencing Services Market Volume K Units Forecast, by Product Type 2019 & 2032
- Table 69: Global Next-Generation Sequencing Services Market Revenue Million Forecast, by End-User 2019 & 2032
- Table 70: Global Next-Generation Sequencing Services Market Volume K Units Forecast, by End-User 2019 & 2032
- Table 71: Global Next-Generation Sequencing Services Market Revenue Million Forecast, by Application 2019 & 2032
- Table 72: Global Next-Generation Sequencing Services Market Volume K Units Forecast, by Application 2019 & 2032
- Table 73: Global Next-Generation Sequencing Services Market Revenue Million Forecast, by Country 2019 & 2032
- Table 74: Global Next-Generation Sequencing Services Market Volume K Units Forecast, by Country 2019 & 2032
- Table 75: United States Next-Generation Sequencing Services Market Revenue (Million) Forecast, by Application 2019 & 2032
- Table 76: United States Next-Generation Sequencing Services Market Volume (K Units) Forecast, by Application 2019 & 2032
- Table 77: Canada Next-Generation Sequencing Services Market Revenue (Million) Forecast, by Application 2019 & 2032
- Table 78: Canada Next-Generation Sequencing Services Market Volume (K Units) Forecast, by Application 2019 & 2032
- Table 79: Mexico Next-Generation Sequencing Services Market Revenue (Million) Forecast, by Application 2019 & 2032
- Table 80: Mexico Next-Generation Sequencing Services Market Volume (K Units) Forecast, by Application 2019 & 2032
- Table 81: Global Next-Generation Sequencing Services Market Revenue Million Forecast, by Type of Sequencing 2019 & 2032
- Table 82: Global Next-Generation Sequencing Services Market Volume K Units Forecast, by Type of Sequencing 2019 & 2032
- Table 83: Global Next-Generation Sequencing Services Market Revenue Million Forecast, by Product Type 2019 & 2032
- Table 84: Global Next-Generation Sequencing Services Market Volume K Units Forecast, by Product Type 2019 & 2032
- Table 85: Global Next-Generation Sequencing Services Market Revenue Million Forecast, by End-User 2019 & 2032
- Table 86: Global Next-Generation Sequencing Services Market Volume K Units Forecast, by End-User 2019 & 2032
- Table 87: Global Next-Generation Sequencing Services Market Revenue Million Forecast, by Application 2019 & 2032
- Table 88: Global Next-Generation Sequencing Services Market Volume K Units Forecast, by Application 2019 & 2032
- Table 89: Global Next-Generation Sequencing Services Market Revenue Million Forecast, by Country 2019 & 2032
- Table 90: Global Next-Generation Sequencing Services Market Volume K Units Forecast, by Country 2019 & 2032
- Table 91: Germany Next-Generation Sequencing Services Market Revenue (Million) Forecast, by Application 2019 & 2032
- Table 92: Germany Next-Generation Sequencing Services Market Volume (K Units) Forecast, by Application 2019 & 2032
- Table 93: United Kingdom Next-Generation Sequencing Services Market Revenue (Million) Forecast, by Application 2019 & 2032
- Table 94: United Kingdom Next-Generation Sequencing Services Market Volume (K Units) Forecast, by Application 2019 & 2032
- Table 95: France Next-Generation Sequencing Services Market Revenue (Million) Forecast, by Application 2019 & 2032
- Table 96: France Next-Generation Sequencing Services Market Volume (K Units) Forecast, by Application 2019 & 2032
- Table 97: Italy Next-Generation Sequencing Services Market Revenue (Million) Forecast, by Application 2019 & 2032
- Table 98: Italy Next-Generation Sequencing Services Market Volume (K Units) Forecast, by Application 2019 & 2032
- Table 99: Spain Next-Generation Sequencing Services Market Revenue (Million) Forecast, by Application 2019 & 2032
- Table 100: Spain Next-Generation Sequencing Services Market Volume (K Units) Forecast, by Application 2019 & 2032
- Table 101: Rest of Europe Next-Generation Sequencing Services Market Revenue (Million) Forecast, by Application 2019 & 2032
- Table 102: Rest of Europe Next-Generation Sequencing Services Market Volume (K Units) Forecast, by Application 2019 & 2032
- Table 103: Global Next-Generation Sequencing Services Market Revenue Million Forecast, by Type of Sequencing 2019 & 2032
- Table 104: Global Next-Generation Sequencing Services Market Volume K Units Forecast, by Type of Sequencing 2019 & 2032
- Table 105: Global Next-Generation Sequencing Services Market Revenue Million Forecast, by Product Type 2019 & 2032
- Table 106: Global Next-Generation Sequencing Services Market Volume K Units Forecast, by Product Type 2019 & 2032
- Table 107: Global Next-Generation Sequencing Services Market Revenue Million Forecast, by End-User 2019 & 2032
- Table 108: Global Next-Generation Sequencing Services Market Volume K Units Forecast, by End-User 2019 & 2032
- Table 109: Global Next-Generation Sequencing Services Market Revenue Million Forecast, by Application 2019 & 2032
- Table 110: Global Next-Generation Sequencing Services Market Volume K Units Forecast, by Application 2019 & 2032
- Table 111: Global Next-Generation Sequencing Services Market Revenue Million Forecast, by Country 2019 & 2032
- Table 112: Global Next-Generation Sequencing Services Market Volume K Units Forecast, by Country 2019 & 2032
- Table 113: China Next-Generation Sequencing Services Market Revenue (Million) Forecast, by Application 2019 & 2032
- Table 114: China Next-Generation Sequencing Services Market Volume (K Units) Forecast, by Application 2019 & 2032
- Table 115: Japan Next-Generation Sequencing Services Market Revenue (Million) Forecast, by Application 2019 & 2032
- Table 116: Japan Next-Generation Sequencing Services Market Volume (K Units) Forecast, by Application 2019 & 2032
- Table 117: India Next-Generation Sequencing Services Market Revenue (Million) Forecast, by Application 2019 & 2032
- Table 118: India Next-Generation Sequencing Services Market Volume (K Units) Forecast, by Application 2019 & 2032
- Table 119: Australia Next-Generation Sequencing Services Market Revenue (Million) Forecast, by Application 2019 & 2032
- Table 120: Australia Next-Generation Sequencing Services Market Volume (K Units) Forecast, by Application 2019 & 2032
- Table 121: South Korea Next-Generation Sequencing Services Market Revenue (Million) Forecast, by Application 2019 & 2032
- Table 122: South Korea Next-Generation Sequencing Services Market Volume (K Units) Forecast, by Application 2019 & 2032
- Table 123: Rest of Asia Pacific Next-Generation Sequencing Services Market Revenue (Million) Forecast, by Application 2019 & 2032
- Table 124: Rest of Asia Pacific Next-Generation Sequencing Services Market Volume (K Units) Forecast, by Application 2019 & 2032
- Table 125: Global Next-Generation Sequencing Services Market Revenue Million Forecast, by Type of Sequencing 2019 & 2032
- Table 126: Global Next-Generation Sequencing Services Market Volume K Units Forecast, by Type of Sequencing 2019 & 2032
- Table 127: Global Next-Generation Sequencing Services Market Revenue Million Forecast, by Product Type 2019 & 2032
- Table 128: Global Next-Generation Sequencing Services Market Volume K Units Forecast, by Product Type 2019 & 2032
- Table 129: Global Next-Generation Sequencing Services Market Revenue Million Forecast, by End-User 2019 & 2032
- Table 130: Global Next-Generation Sequencing Services Market Volume K Units Forecast, by End-User 2019 & 2032
- Table 131: Global Next-Generation Sequencing Services Market Revenue Million Forecast, by Application 2019 & 2032
- Table 132: Global Next-Generation Sequencing Services Market Volume K Units Forecast, by Application 2019 & 2032
- Table 133: Global Next-Generation Sequencing Services Market Revenue Million Forecast, by Country 2019 & 2032
- Table 134: Global Next-Generation Sequencing Services Market Volume K Units Forecast, by Country 2019 & 2032
- Table 135: GCC Next-Generation Sequencing Services Market Revenue (Million) Forecast, by Application 2019 & 2032
- Table 136: GCC Next-Generation Sequencing Services Market Volume (K Units) Forecast, by Application 2019 & 2032
- Table 137: South Africa Next-Generation Sequencing Services Market Revenue (Million) Forecast, by Application 2019 & 2032
- Table 138: South Africa Next-Generation Sequencing Services Market Volume (K Units) Forecast, by Application 2019 & 2032
- Table 139: Rest of Middle East and Africa Next-Generation Sequencing Services Market Revenue (Million) Forecast, by Application 2019 & 2032
- Table 140: Rest of Middle East and Africa Next-Generation Sequencing Services Market Volume (K Units) Forecast, by Application 2019 & 2032
- Table 141: Global Next-Generation Sequencing Services Market Revenue Million Forecast, by Type of Sequencing 2019 & 2032
- Table 142: Global Next-Generation Sequencing Services Market Volume K Units Forecast, by Type of Sequencing 2019 & 2032
- Table 143: Global Next-Generation Sequencing Services Market Revenue Million Forecast, by Product Type 2019 & 2032
- Table 144: Global Next-Generation Sequencing Services Market Volume K Units Forecast, by Product Type 2019 & 2032
- Table 145: Global Next-Generation Sequencing Services Market Revenue Million Forecast, by End-User 2019 & 2032
- Table 146: Global Next-Generation Sequencing Services Market Volume K Units Forecast, by End-User 2019 & 2032
- Table 147: Global Next-Generation Sequencing Services Market Revenue Million Forecast, by Application 2019 & 2032
- Table 148: Global Next-Generation Sequencing Services Market Volume K Units Forecast, by Application 2019 & 2032
- Table 149: Global Next-Generation Sequencing Services Market Revenue Million Forecast, by Country 2019 & 2032
- Table 150: Global Next-Generation Sequencing Services Market Volume K Units Forecast, by Country 2019 & 2032
- Table 151: Brazil Next-Generation Sequencing Services Market Revenue (Million) Forecast, by Application 2019 & 2032
- Table 152: Brazil Next-Generation Sequencing Services Market Volume (K Units) Forecast, by Application 2019 & 2032
- Table 153: Argentina Next-Generation Sequencing Services Market Revenue (Million) Forecast, by Application 2019 & 2032
- Table 154: Argentina Next-Generation Sequencing Services Market Volume (K Units) Forecast, by Application 2019 & 2032
- Table 155: Rest of South America Next-Generation Sequencing Services Market Revenue (Million) Forecast, by Application 2019 & 2032
- Table 156: Rest of South America Next-Generation Sequencing Services Market Volume (K Units) Forecast, by Application 2019 & 2032
Frequently Asked Questions
1. What is the projected Compound Annual Growth Rate (CAGR) of the Next-Generation Sequencing Services Market?
The projected CAGR is approximately 13.43%.
2. Which companies are prominent players in the Next-Generation Sequencing Services Market?
Key companies in the market include DNASTAR Inc, Bio-Rad Laboratories Inc, F Hoffmann-La Roche Ltd, Eurofins Scientific, Macrogen Inc, Thermo Fisher Scientific Inc, Qiagen, PerkinElmer Inc, Illumina Inc, Pacific Biosciences of California Inc, CD Genomics, Agilent Technologies.
3. What are the main segments of the Next-Generation Sequencing Services Market?
The market segments include Type of Sequencing, Product Type, End-User, Application.
4. Can you provide details about the market size?
The market size is estimated to be USD 10.47 Million as of 2022.
5. What are some drivers contributing to market growth?
Increasing Applications in Clinical Diagnosis and Speed. Cost. and Accuracy; Increasing Efficiency when Compared To Traditional Technologies Such As Microarrays and Rising Drug Discovery Applications.
6. What are the notable trends driving market growth?
The Whole Genome Sequencing Segment is Expected to Grow at a Significant Rate Over the Forecast Period.
7. Are there any restraints impacting market growth?
Legal and Ethical Issues; Interpretation of Complex Data and Lack of Skilled Professionals.
8. Can you provide examples of recent developments in the market?
January 2023: QIAGEN announced a strategic partnership with California-based population genomics leader Helix to advance next-generation sequencing companion diagnostics in hereditary diseases.
9. What pricing options are available for accessing the report?
Pricing options include single-user, multi-user, and enterprise licenses priced at USD 4750, USD 5250, and USD 8750 respectively.
10. Is the market size provided in terms of value or volume?
The market size is provided in terms of value, measured in Million and volume, measured in K Units.
11. Are there any specific market keywords associated with the report?
Yes, the market keyword associated with the report is "Next-Generation Sequencing Services Market," which aids in identifying and referencing the specific market segment covered.
12. How do I determine which pricing option suits my needs best?
The pricing options vary based on user requirements and access needs. Individual users may opt for single-user licenses, while businesses requiring broader access may choose multi-user or enterprise licenses for cost-effective access to the report.
13. Are there any additional resources or data provided in the Next-Generation Sequencing Services Market report?
While the report offers comprehensive insights, it's advisable to review the specific contents or supplementary materials provided to ascertain if additional resources or data are available.
14. How can I stay updated on further developments or reports in the Next-Generation Sequencing Services Market?
To stay informed about further developments, trends, and reports in the Next-Generation Sequencing Services Market, consider subscribing to industry newsletters, following relevant companies and organizations, or regularly checking reputable industry news sources and publications.
Methodology
Step 1 - Identification of Relevant Samples Size from Population Database


Step 2 - Approaches for Defining Global Market Size (Value, Volume* & Price*)

Note*: In applicable scenarios
Step 3 - Data Sources
Primary Research
- Web Analytics
- Survey Reports
- Research Institute
- Latest Research Reports
- Opinion Leaders
Secondary Research
- Annual Reports
- White Paper
- Latest Press Release
- Industry Association
- Paid Database
- Investor Presentations

Step 4 - Data Triangulation
Involves using different sources of information in order to increase the validity of a study
These sources are likely to be stakeholders in a program - participants, other researchers, program staff, other community members, and so on.
Then we put all data in single framework & apply various statistical tools to find out the dynamic on the market.
During the analysis stage, feedback from the stakeholder groups would be compared to determine areas of agreement as well as areas of divergence
