

Key Insights
The Non-Destructive Testing (NDT) market within the oil and gas industry is experiencing robust growth, driven by stringent safety regulations, the increasing complexity of offshore operations, and the need for proactive maintenance to prevent costly equipment failures. A compound annual growth rate (CAGR) of 6.52% from 2019 to 2024 indicates a significant expansion, and this trend is projected to continue through 2033. The market's segmentation reveals a healthy demand across various types of NDT services and equipment, with ultrasonic and radiography techniques maintaining dominant positions due to their reliability and versatility in detecting flaws in pipelines, pressure vessels, and other critical infrastructure. Upstream operations, particularly exploration and production, are major consumers of NDT services, reflecting the critical need for safety and efficiency in these high-risk environments. Growth is further stimulated by technological advancements, including the development of more sophisticated and portable NDT equipment, improved data analysis capabilities, and the integration of automation and artificial intelligence to enhance inspection efficiency and accuracy.
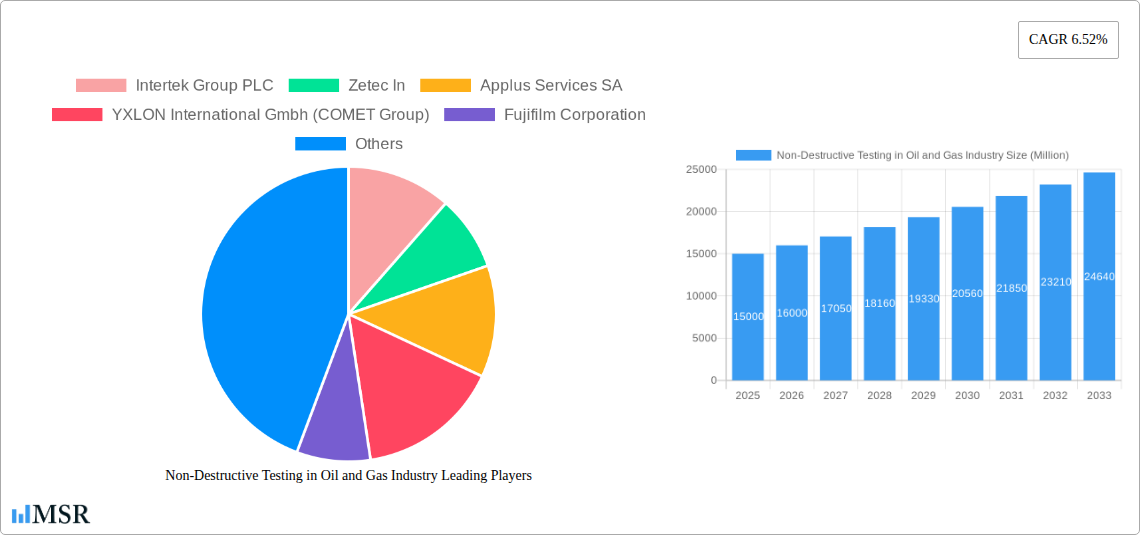
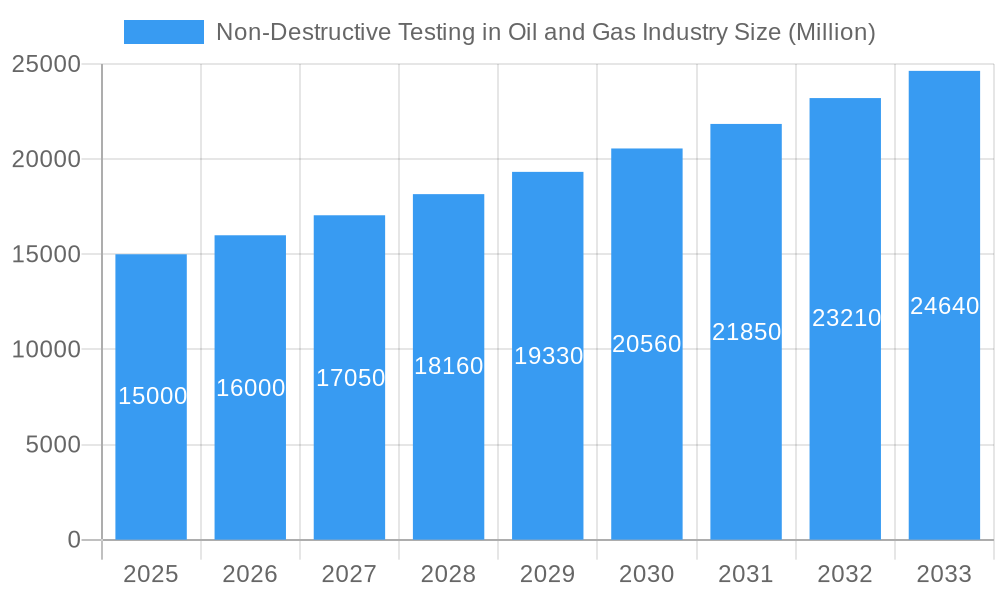
Non-Destructive Testing in Oil and Gas Industry Market Size (In Billion)
However, challenges remain. The market faces restraints such as fluctuating oil and gas prices, which directly impact investment in maintenance and inspection activities. Additionally, the highly skilled workforce required for advanced NDT techniques can create a bottleneck. Competition among established players and emerging technologies also influences market dynamics. Despite these challenges, the long-term outlook for the NDT market in the oil and gas sector remains positive, fueled by continuous operational demands and a commitment to safety and regulatory compliance. The geographic distribution of the market is expected to see a shift, with regions like Asia-Pacific witnessing accelerated growth driven by robust infrastructure development and increasing energy demands. North America and Europe will continue to be significant markets, although their growth rate may be slightly moderated compared to emerging economies.
Non-Destructive Testing in Oil and Gas Industry Company Market Share
Non-Destructive Testing (NDT) in the Oil & Gas Industry: A Comprehensive Market Report (2019-2033)
This comprehensive report provides an in-depth analysis of the Non-Destructive Testing (NDT) market within the oil and gas industry, covering the period 2019-2033. Valued at $XX Million in 2025, the market is poised for significant growth, driven by technological advancements and increasing demand for safety and efficiency. This report offers actionable insights for industry stakeholders, including key players like Intertek Group PLC, Zetec Inc., Applus Services SA, and more. We analyze market dynamics, key segments, leading players, and future growth opportunities, providing a crucial resource for strategic decision-making.
Non-Destructive Testing in Oil and Gas Industry Market Concentration & Dynamics
The NDT market in the oil and gas sector exhibits a moderately concentrated landscape, with a few major players holding significant market share. The top 10 companies account for approximately xx% of the global market, reflecting the substantial capital investment and specialized expertise required. Market concentration is influenced by factors such as mergers and acquisitions (M&A) activity, technological innovation, and regulatory compliance. Over the historical period (2019-2024), we observed approximately xx M&A deals, mainly focused on expanding service offerings and geographical reach. Innovation ecosystems are thriving, with continuous advancements in NDT techniques and equipment driving market growth. Stringent safety regulations enforced globally significantly impact market dynamics, pushing for the adoption of advanced and reliable NDT solutions. Substitute products, while limited, exert some pressure, particularly from emerging technologies. End-user trends show a clear shift towards digitalization and automation in NDT processes, while the prevalence of large-scale projects fuels demand.
- Market Share: Top 10 companies hold approximately xx%.
- M&A Activity (2019-2024): Approximately xx deals.
- Key Drivers: Stringent safety regulations, technological advancements, growing demand for efficient operations.
- Challenges: Competition, regulatory hurdles, technological complexity.
Non-Destructive Testing in Oil and Gas Industry Industry Insights & Trends
The global NDT market in the oil and gas sector is experiencing robust growth, with a Compound Annual Growth Rate (CAGR) of xx% projected from 2025 to 2033. This growth is primarily driven by the increasing demand for enhanced safety measures, the need for improved asset integrity management, and the expansion of exploration and production activities globally. Technological disruptions, particularly the integration of advanced technologies like AI and machine learning, are revolutionizing NDT processes, leading to improved accuracy, speed, and efficiency. The market is witnessing a paradigm shift towards automated and data-driven NDT solutions. This trend is further amplified by the rising adoption of digitalization and remote inspection technologies. Furthermore, evolving consumer behaviors towards sustainable practices and reduced environmental impact are shaping the demand for environmentally friendly NDT methods. The market size is projected to reach $XX Million by 2033, showcasing the significant investment opportunities present in this sector.
Key Markets & Segments Leading Non-Destructive Testing in Oil and Gas Industry
The Upstream segment currently dominates the NDT market in the oil and gas industry, accounting for approximately xx% of the total market share in 2025. However, the Midstream and Downstream segments are also experiencing significant growth, driven by the increasing focus on pipeline integrity and refinery safety. Geographically, North America and Europe are leading markets, with the Asia-Pacific region exhibiting the fastest growth potential. Ultrasonic testing and radiography remain the most widely adopted techniques, driven by their established reliability and versatility.
By Type:
- Equipment: High demand driven by advancements in technology and the need for sophisticated NDT tools.
- Services: Growing outsourcing trend due to the specialized expertise required for NDT.
- Upstream: Dominates the market due to the extensive use of NDT in exploration and production activities.
- Midstream: Growing demand driven by the increased focus on pipeline integrity management.
- Downstream: Growing demand driven by the need for rigorous safety measures in refineries.
By Technique:
- Ultrasonic Testing: Remains the most widely used technique due to its versatility and effectiveness.
- Radiography: Widely employed for detecting internal flaws and assessing material thickness.
- Visual Inspection: A fundamental technique, often complemented by more advanced methods.
- Liquid Penetrant Testing: Used for detecting surface-breaking defects in various materials.
- Others (Magnetic Particle & Eddy Current): Specialized techniques employed for detecting specific types of defects.
Key Market Drivers:
- Economic Growth: Increased investments in oil and gas exploration and production.
- Infrastructure Development: Expansion of pipelines and refineries across the globe.
- Stringent Safety Regulations: Increased enforcement of safety standards and regulations.
Non-Destructive Testing in Oil and Gas Industry Product Developments
Recent product innovations have significantly enhanced the capabilities of NDT in the oil and gas industry. Advanced sensor technologies, AI-powered image analysis software, and portable and handheld devices have increased efficiency and accuracy. The introduction of 3D imaging techniques allows for more detailed analysis of subsurface defects, leading to better decision-making and reduced maintenance costs. These advancements provide companies with a competitive edge by enabling faster, more accurate inspections, and reducing downtime.
Challenges in the Non-Destructive Testing in Oil and Gas Industry Market
The NDT market faces several challenges, including stringent regulatory compliance requirements that impact costs and time-to-market. Supply chain disruptions can lead to equipment shortages and increased costs. Intense competition among established players and emerging companies also puts downward pressure on pricing. These factors, combined with the need for skilled personnel, pose challenges to market expansion. The total impact of these challenges is estimated to result in a xx% reduction in market growth in the short term.
Forces Driving Non-Destructive Testing in Oil and Gas Industry Growth
Growth is driven by several factors, including increasing demand for enhanced safety and asset integrity management due to stringent industry regulations and increasing public awareness of environmental concerns. Technological advancements such as AI-powered analysis and automation are improving efficiency and accuracy. The growing emphasis on predictive maintenance reduces operational downtime and enhances productivity, further driving adoption.
Long-Term Growth Catalysts in the Non-Destructive Testing in Oil and Gas Industry Market
Long-term growth will be fueled by continued innovation in NDT technologies, including the development of more efficient and cost-effective solutions. Strategic partnerships and collaborations among industry players will accelerate technology adoption and market penetration. Expanding into new markets and application areas, such as renewable energy infrastructure, presents further growth opportunities.
Emerging Opportunities in Non-Destructive Testing in Oil and Gas Industry
Emerging opportunities lie in the development and adoption of advanced NDT technologies, such as robotic inspection systems and drone-based inspections. These technologies improve accessibility to hard-to-reach areas and enhance efficiency. The integration of data analytics and the Internet of Things (IoT) allows for real-time monitoring and predictive maintenance, reducing operational costs and downtime.
Leading Players in the Non-Destructive Testing in Oil and Gas Industry Sector
- Intertek Group PLC
- Zetec Inc.
- Applus Services SA
- YXLON International GmbH (COMET Group)
- Fujifilm Corporation
- GE Measurement and Control (Baker Hughes)
- Karl Storz NDT GmbH
- Bureau Veritas SA
- Olympus Corporation
- Magnaflux Corp
- Magnetic Analysis Corporation
Key Milestones in Non-Destructive Testing in Oil and Gas Industry Industry
- September 2022: Waygate Technologies introduced the Ruby|plate 240 calibration phantom for industrial computed tomography (CT), enhancing calibration accuracy and efficiency.
- October 2022: Videray Technologies Inc. launched PX Ultra, a handheld backscatter X-ray imager, improving anomaly detection capabilities in various industrial settings.
Strategic Outlook for Non-Destructive Testing in Oil and Gas Industry Market
The future of the NDT market in the oil and gas industry is bright, driven by technological innovation and the increasing demand for improved safety and efficiency. Strategic opportunities exist for companies to invest in advanced technologies, expand service offerings, and leverage data analytics to enhance their competitive edge. Focus on sustainable practices and environmentally friendly NDT solutions will further drive market growth and attract investors committed to environmentally responsible solutions.
Non-Destructive Testing in Oil and Gas Industry Segmentation
-
1. Type
- 1.1. Equipment
- 1.2. Services
-
2. Type
- 2.1. Upstream
- 2.2. Midstream
- 2.3. Downstream
-
3. Technique
- 3.1. Ultrasonic
- 3.2. Radiography
- 3.3. Visual Inspection
- 3.4. Liquid Penetrant
- 3.5. Others (Magnetic Particle & Eddy Current)
Non-Destructive Testing in Oil and Gas Industry Segmentation By Geography
- 1. North America
- 2. Europe
- 3. Asia Pacific
- 4. Rest of the World
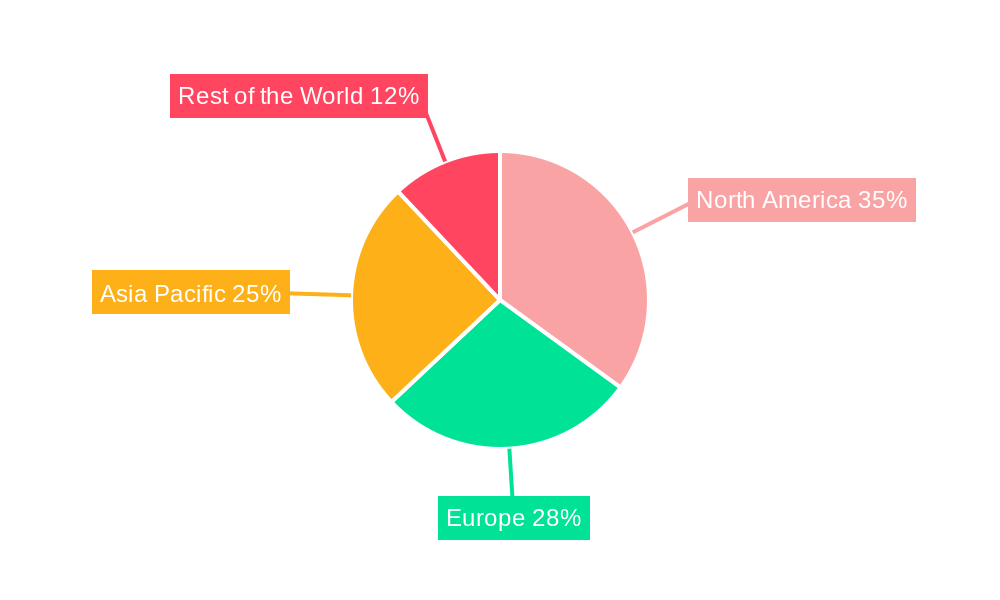
Non-Destructive Testing in Oil and Gas Industry Regional Market Share
Geographic Coverage of Non-Destructive Testing in Oil and Gas Industry
Non-Destructive Testing in Oil and Gas Industry REPORT HIGHLIGHTS
| Aspects | Details |
|---|---|
| Study Period | 2020-2034 |
| Base Year | 2025 |
| Estimated Year | 2026 |
| Forecast Period | 2026-2034 |
| Historical Period | 2020-2025 |
| Growth Rate | CAGR of 8.8% from 2020-2034 |
| Segmentation |
|
Table of Contents
- 1. Introduction
- 1.1. Research Scope
- 1.2. Market Segmentation
- 1.3. Research Objective
- 1.4. Definitions and Assumptions
- 2. Executive Summary
- 2.1. Market Snapshot
- 3. Market Dynamics
- 3.1. Market Drivers
- 3.2. Market Restrains
- 3.3. Market Trends
- 3.4. Market Opportunities
- 4. Market Factor Analysis
- 4.1. Porters Five Forces
- 4.1.1. Bargaining Power of Suppliers
- 4.1.2. Bargaining Power of Buyers
- 4.1.3. Threat of New Entrants
- 4.1.4. Threat of Substitutes
- 4.1.5. Competitive Rivalry
- 4.2. PESTEL analysis
- 4.3. BCG Analysis
- 4.3.1. Stars (High Growth, High Market Share)
- 4.3.2. Cash Cows (Low Growth, High Market Share)
- 4.3.3. Question Mark (High Growth, Low Market Share)
- 4.3.4. Dogs (Low Growth, Low Market Share)
- 4.4. Ansoff Matrix Analysis
- 4.5. Supply Chain Analysis
- 4.6. Regulatory Landscape
- 4.7. Current Market Potential and Opportunity Assessment (TAM–SAM–SOM Framework)
- 4.8. MSR Analyst Note
- 4.1. Porters Five Forces
- 5. Market Analysis, Insights and Forecast 2021-2033
- 5.1. Market Analysis, Insights and Forecast - by Type
- 5.1.1. Equipment
- 5.1.2. Services
- 5.2. Market Analysis, Insights and Forecast - by Type
- 5.2.1. Upstream
- 5.2.2. Midstream
- 5.2.3. Downstream
- 5.3. Market Analysis, Insights and Forecast - by Technique
- 5.3.1. Ultrasonic
- 5.3.2. Radiography
- 5.3.3. Visual Inspection
- 5.3.4. Liquid Penetrant
- 5.3.5. Others (Magnetic Particle & Eddy Current)
- 5.4. Market Analysis, Insights and Forecast - by Region
- 5.4.1. North America
- 5.4.2. Europe
- 5.4.3. Asia Pacific
- 5.4.4. Rest of the World
- 5.1. Market Analysis, Insights and Forecast - by Type
- 6. Global Non-Destructive Testing in Oil and Gas Industry Analysis, Insights and Forecast, 2021-2033
- 6.1. Market Analysis, Insights and Forecast - by Type
- 6.1.1. Equipment
- 6.1.2. Services
- 6.2. Market Analysis, Insights and Forecast - by Type
- 6.2.1. Upstream
- 6.2.2. Midstream
- 6.2.3. Downstream
- 6.3. Market Analysis, Insights and Forecast - by Technique
- 6.3.1. Ultrasonic
- 6.3.2. Radiography
- 6.3.3. Visual Inspection
- 6.3.4. Liquid Penetrant
- 6.3.5. Others (Magnetic Particle & Eddy Current)
- 6.1. Market Analysis, Insights and Forecast - by Type
- 7. North America Non-Destructive Testing in Oil and Gas Industry Analysis, Insights and Forecast, 2020-2032
- 7.1. Market Analysis, Insights and Forecast - by Type
- 7.1.1. Equipment
- 7.1.2. Services
- 7.2. Market Analysis, Insights and Forecast - by Type
- 7.2.1. Upstream
- 7.2.2. Midstream
- 7.2.3. Downstream
- 7.3. Market Analysis, Insights and Forecast - by Technique
- 7.3.1. Ultrasonic
- 7.3.2. Radiography
- 7.3.3. Visual Inspection
- 7.3.4. Liquid Penetrant
- 7.3.5. Others (Magnetic Particle & Eddy Current)
- 7.1. Market Analysis, Insights and Forecast - by Type
- 8. Europe Non-Destructive Testing in Oil and Gas Industry Analysis, Insights and Forecast, 2020-2032
- 8.1. Market Analysis, Insights and Forecast - by Type
- 8.1.1. Equipment
- 8.1.2. Services
- 8.2. Market Analysis, Insights and Forecast - by Type
- 8.2.1. Upstream
- 8.2.2. Midstream
- 8.2.3. Downstream
- 8.3. Market Analysis, Insights and Forecast - by Technique
- 8.3.1. Ultrasonic
- 8.3.2. Radiography
- 8.3.3. Visual Inspection
- 8.3.4. Liquid Penetrant
- 8.3.5. Others (Magnetic Particle & Eddy Current)
- 8.1. Market Analysis, Insights and Forecast - by Type
- 9. Asia Pacific Non-Destructive Testing in Oil and Gas Industry Analysis, Insights and Forecast, 2020-2032
- 9.1. Market Analysis, Insights and Forecast - by Type
- 9.1.1. Equipment
- 9.1.2. Services
- 9.2. Market Analysis, Insights and Forecast - by Type
- 9.2.1. Upstream
- 9.2.2. Midstream
- 9.2.3. Downstream
- 9.3. Market Analysis, Insights and Forecast - by Technique
- 9.3.1. Ultrasonic
- 9.3.2. Radiography
- 9.3.3. Visual Inspection
- 9.3.4. Liquid Penetrant
- 9.3.5. Others (Magnetic Particle & Eddy Current)
- 9.1. Market Analysis, Insights and Forecast - by Type
- 10. Rest of the World Non-Destructive Testing in Oil and Gas Industry Analysis, Insights and Forecast, 2020-2032
- 10.1. Market Analysis, Insights and Forecast - by Type
- 10.1.1. Equipment
- 10.1.2. Services
- 10.2. Market Analysis, Insights and Forecast - by Type
- 10.2.1. Upstream
- 10.2.2. Midstream
- 10.2.3. Downstream
- 10.3. Market Analysis, Insights and Forecast - by Technique
- 10.3.1. Ultrasonic
- 10.3.2. Radiography
- 10.3.3. Visual Inspection
- 10.3.4. Liquid Penetrant
- 10.3.5. Others (Magnetic Particle & Eddy Current)
- 10.1. Market Analysis, Insights and Forecast - by Type
- 11. Competitive Analysis
- 11.1. Company Profiles
- 11.1.1 Intertek Group PLC
- 11.1.1.1. Company Overview
- 11.1.1.2. Products
- 11.1.1.3. Company Financials
- 11.1.1.4. SWOT Analysis
- 11.1.2 Zetec In
- 11.1.2.1. Company Overview
- 11.1.2.2. Products
- 11.1.2.3. Company Financials
- 11.1.2.4. SWOT Analysis
- 11.1.3 Applus Services SA
- 11.1.3.1. Company Overview
- 11.1.3.2. Products
- 11.1.3.3. Company Financials
- 11.1.3.4. SWOT Analysis
- 11.1.4 YXLON International Gmbh (COMET Group)
- 11.1.4.1. Company Overview
- 11.1.4.2. Products
- 11.1.4.3. Company Financials
- 11.1.4.4. SWOT Analysis
- 11.1.5 Fujifilm Corporation
- 11.1.5.1. Company Overview
- 11.1.5.2. Products
- 11.1.5.3. Company Financials
- 11.1.5.4. SWOT Analysis
- 11.1.6 GE Measurement and Control (Baker Hughes)
- 11.1.6.1. Company Overview
- 11.1.6.2. Products
- 11.1.6.3. Company Financials
- 11.1.6.4. SWOT Analysis
- 11.1.7 Karl Storz Ndtec Gmbh
- 11.1.7.1. Company Overview
- 11.1.7.2. Products
- 11.1.7.3. Company Financials
- 11.1.7.4. SWOT Analysis
- 11.1.8 Bureau Veritas SA
- 11.1.8.1. Company Overview
- 11.1.8.2. Products
- 11.1.8.3. Company Financials
- 11.1.8.4. SWOT Analysis
- 11.1.9 Olympus Corporation
- 11.1.9.1. Company Overview
- 11.1.9.2. Products
- 11.1.9.3. Company Financials
- 11.1.9.4. SWOT Analysis
- 11.1.10 Magnaflux Corp
- 11.1.10.1. Company Overview
- 11.1.10.2. Products
- 11.1.10.3. Company Financials
- 11.1.10.4. SWOT Analysis
- 11.1.11 Magnetic Analysis Corporation
- 11.1.11.1. Company Overview
- 11.1.11.2. Products
- 11.1.11.3. Company Financials
- 11.1.11.4. SWOT Analysis
- 11.1.1 Intertek Group PLC
- 11.2. Market Entropy
- 11.2.1 Company's Key Areas Served
- 11.2.2 Recent Developments
- 11.3. Company Market Share Analysis 2025
- 11.3.1 Top 5 Companies Market Share Analysis
- 11.3.2 Top 3 Companies Market Share Analysis
- 11.4. List of Potential Customers
- 12. Research Methodology
List of Figures
- Figure 1: Global Non-Destructive Testing in Oil and Gas Industry Revenue Breakdown (billion, %) by Region 2025 & 2033
- Figure 2: North America Non-Destructive Testing in Oil and Gas Industry Revenue (billion), by Type 2025 & 2033
- Figure 3: North America Non-Destructive Testing in Oil and Gas Industry Revenue Share (%), by Type 2025 & 2033
- Figure 4: North America Non-Destructive Testing in Oil and Gas Industry Revenue (billion), by Type 2025 & 2033
- Figure 5: North America Non-Destructive Testing in Oil and Gas Industry Revenue Share (%), by Type 2025 & 2033
- Figure 6: North America Non-Destructive Testing in Oil and Gas Industry Revenue (billion), by Technique 2025 & 2033
- Figure 7: North America Non-Destructive Testing in Oil and Gas Industry Revenue Share (%), by Technique 2025 & 2033
- Figure 8: North America Non-Destructive Testing in Oil and Gas Industry Revenue (billion), by Country 2025 & 2033
- Figure 9: North America Non-Destructive Testing in Oil and Gas Industry Revenue Share (%), by Country 2025 & 2033
- Figure 10: Europe Non-Destructive Testing in Oil and Gas Industry Revenue (billion), by Type 2025 & 2033
- Figure 11: Europe Non-Destructive Testing in Oil and Gas Industry Revenue Share (%), by Type 2025 & 2033
- Figure 12: Europe Non-Destructive Testing in Oil and Gas Industry Revenue (billion), by Type 2025 & 2033
- Figure 13: Europe Non-Destructive Testing in Oil and Gas Industry Revenue Share (%), by Type 2025 & 2033
- Figure 14: Europe Non-Destructive Testing in Oil and Gas Industry Revenue (billion), by Technique 2025 & 2033
- Figure 15: Europe Non-Destructive Testing in Oil and Gas Industry Revenue Share (%), by Technique 2025 & 2033
- Figure 16: Europe Non-Destructive Testing in Oil and Gas Industry Revenue (billion), by Country 2025 & 2033
- Figure 17: Europe Non-Destructive Testing in Oil and Gas Industry Revenue Share (%), by Country 2025 & 2033
- Figure 18: Asia Pacific Non-Destructive Testing in Oil and Gas Industry Revenue (billion), by Type 2025 & 2033
- Figure 19: Asia Pacific Non-Destructive Testing in Oil and Gas Industry Revenue Share (%), by Type 2025 & 2033
- Figure 20: Asia Pacific Non-Destructive Testing in Oil and Gas Industry Revenue (billion), by Type 2025 & 2033
- Figure 21: Asia Pacific Non-Destructive Testing in Oil and Gas Industry Revenue Share (%), by Type 2025 & 2033
- Figure 22: Asia Pacific Non-Destructive Testing in Oil and Gas Industry Revenue (billion), by Technique 2025 & 2033
- Figure 23: Asia Pacific Non-Destructive Testing in Oil and Gas Industry Revenue Share (%), by Technique 2025 & 2033
- Figure 24: Asia Pacific Non-Destructive Testing in Oil and Gas Industry Revenue (billion), by Country 2025 & 2033
- Figure 25: Asia Pacific Non-Destructive Testing in Oil and Gas Industry Revenue Share (%), by Country 2025 & 2033
- Figure 26: Rest of the World Non-Destructive Testing in Oil and Gas Industry Revenue (billion), by Type 2025 & 2033
- Figure 27: Rest of the World Non-Destructive Testing in Oil and Gas Industry Revenue Share (%), by Type 2025 & 2033
- Figure 28: Rest of the World Non-Destructive Testing in Oil and Gas Industry Revenue (billion), by Type 2025 & 2033
- Figure 29: Rest of the World Non-Destructive Testing in Oil and Gas Industry Revenue Share (%), by Type 2025 & 2033
- Figure 30: Rest of the World Non-Destructive Testing in Oil and Gas Industry Revenue (billion), by Technique 2025 & 2033
- Figure 31: Rest of the World Non-Destructive Testing in Oil and Gas Industry Revenue Share (%), by Technique 2025 & 2033
- Figure 32: Rest of the World Non-Destructive Testing in Oil and Gas Industry Revenue (billion), by Country 2025 & 2033
- Figure 33: Rest of the World Non-Destructive Testing in Oil and Gas Industry Revenue Share (%), by Country 2025 & 2033
List of Tables
- Table 1: Global Non-Destructive Testing in Oil and Gas Industry Revenue billion Forecast, by Type 2020 & 2033
- Table 2: Global Non-Destructive Testing in Oil and Gas Industry Revenue billion Forecast, by Type 2020 & 2033
- Table 3: Global Non-Destructive Testing in Oil and Gas Industry Revenue billion Forecast, by Technique 2020 & 2033
- Table 4: Global Non-Destructive Testing in Oil and Gas Industry Revenue billion Forecast, by Region 2020 & 2033
- Table 5: Global Non-Destructive Testing in Oil and Gas Industry Revenue billion Forecast, by Type 2020 & 2033
- Table 6: Global Non-Destructive Testing in Oil and Gas Industry Revenue billion Forecast, by Type 2020 & 2033
- Table 7: Global Non-Destructive Testing in Oil and Gas Industry Revenue billion Forecast, by Technique 2020 & 2033
- Table 8: Global Non-Destructive Testing in Oil and Gas Industry Revenue billion Forecast, by Country 2020 & 2033
- Table 9: Global Non-Destructive Testing in Oil and Gas Industry Revenue billion Forecast, by Type 2020 & 2033
- Table 10: Global Non-Destructive Testing in Oil and Gas Industry Revenue billion Forecast, by Type 2020 & 2033
- Table 11: Global Non-Destructive Testing in Oil and Gas Industry Revenue billion Forecast, by Technique 2020 & 2033
- Table 12: Global Non-Destructive Testing in Oil and Gas Industry Revenue billion Forecast, by Country 2020 & 2033
- Table 13: Global Non-Destructive Testing in Oil and Gas Industry Revenue billion Forecast, by Type 2020 & 2033
- Table 14: Global Non-Destructive Testing in Oil and Gas Industry Revenue billion Forecast, by Type 2020 & 2033
- Table 15: Global Non-Destructive Testing in Oil and Gas Industry Revenue billion Forecast, by Technique 2020 & 2033
- Table 16: Global Non-Destructive Testing in Oil and Gas Industry Revenue billion Forecast, by Country 2020 & 2033
- Table 17: Global Non-Destructive Testing in Oil and Gas Industry Revenue billion Forecast, by Type 2020 & 2033
- Table 18: Global Non-Destructive Testing in Oil and Gas Industry Revenue billion Forecast, by Type 2020 & 2033
- Table 19: Global Non-Destructive Testing in Oil and Gas Industry Revenue billion Forecast, by Technique 2020 & 2033
- Table 20: Global Non-Destructive Testing in Oil and Gas Industry Revenue billion Forecast, by Country 2020 & 2033
Frequently Asked Questions
1. What is the projected Compound Annual Growth Rate (CAGR) of the Non-Destructive Testing in Oil and Gas Industry?
The projected CAGR is approximately 8.8%.
2. Which companies are prominent players in the Non-Destructive Testing in Oil and Gas Industry?
Key companies in the market include Intertek Group PLC, Zetec In, Applus Services SA, YXLON International Gmbh (COMET Group), Fujifilm Corporation, GE Measurement and Control (Baker Hughes), Karl Storz Ndtec Gmbh, Bureau Veritas SA, Olympus Corporation, Magnaflux Corp, Magnetic Analysis Corporation.
3. What are the main segments of the Non-Destructive Testing in Oil and Gas Industry?
The market segments include Type, Type, Technique.
4. Can you provide details about the market size?
The market size is estimated to be USD 4.06 billion as of 2022.
5. What are some drivers contributing to market growth?
Rising need to run refinery assets at full cap; Upstream sector expected to gain momentum in key markets.
6. What are the notable trends driving market growth?
The Rising Usage of Drones in the Market.
7. Are there any restraints impacting market growth?
; High Initial Cost During First Time Setup is Challenging the Market Growth.
8. Can you provide examples of recent developments in the market?
September 2022 : Waygate Technologies introduced the Ruby|plate 240 calibration phantom for industrial computed tomography (CT). Features high-resolution insights and captures extremely accurate and effective calibration bodies to determine the exact voxel size and allows operators to detect any deviation quickly and non-destructively in geometry.
9. What pricing options are available for accessing the report?
Pricing options include single-user, multi-user, and enterprise licenses priced at USD 4750, USD 5250, and USD 8750 respectively.
10. Is the market size provided in terms of value or volume?
The market size is provided in terms of value, measured in billion.
11. Are there any specific market keywords associated with the report?
Yes, the market keyword associated with the report is "Non-Destructive Testing in Oil and Gas Industry," which aids in identifying and referencing the specific market segment covered.
12. How do I determine which pricing option suits my needs best?
The pricing options vary based on user requirements and access needs. Individual users may opt for single-user licenses, while businesses requiring broader access may choose multi-user or enterprise licenses for cost-effective access to the report.
13. Are there any additional resources or data provided in the Non-Destructive Testing in Oil and Gas Industry report?
While the report offers comprehensive insights, it's advisable to review the specific contents or supplementary materials provided to ascertain if additional resources or data are available.
14. How can I stay updated on further developments or reports in the Non-Destructive Testing in Oil and Gas Industry?
To stay informed about further developments, trends, and reports in the Non-Destructive Testing in Oil and Gas Industry, consider subscribing to industry newsletters, following relevant companies and organizations, or regularly checking reputable industry news sources and publications.
Methodology
Step 1 - Identification of Relevant Samples Size from Population Database


Step 2 - Approaches for Defining Global Market Size (Value, Volume* & Price*)

Note*: In applicable scenarios
Step 3 - Data Sources
Primary Research
- Web Analytics
- Survey Reports
- Research Institute
- Latest Research Reports
- Opinion Leaders
Secondary Research
- Annual Reports
- White Paper
- Latest Press Release
- Industry Association
- Paid Database
- Investor Presentations

Step 4 - Data Triangulation
Involves using different sources of information in order to increase the validity of a study
These sources are likely to be stakeholders in a program - participants, other researchers, program staff, other community members, and so on.
Then we put all data in single framework & apply various statistical tools to find out the dynamic on the market.
During the analysis stage, feedback from the stakeholder groups would be compared to determine areas of agreement as well as areas of divergence