

Key Insights
The OLED (Organic Light-Emitting Diode) market is experiencing robust growth, projected to reach \$28.14 billion in 2025 and maintain a Compound Annual Growth Rate (CAGR) of 12.31% from 2025 to 2033. This expansion is driven by several key factors. The increasing demand for high-resolution, energy-efficient displays in smartphones, televisions, and automotive applications is a significant driver. Furthermore, advancements in OLED technology, leading to improved brightness, color accuracy, and longer lifespans, are fueling market adoption. The flexibility and thinness of OLED panels also open up new design possibilities, further contributing to market growth. Competition among major players like Samsung Display, LG Display, and BOE Technology is intensifying, leading to continuous innovation and price reductions, making OLED technology more accessible to a wider range of consumers and businesses. The development of flexible and foldable OLED displays is a particularly exciting trend, creating opportunities in wearable technology and novel display applications. While potential restraints such as the relatively high manufacturing costs compared to LCDs exist, the superior visual quality and technological advancements are overcoming these challenges, ensuring continued market expansion.
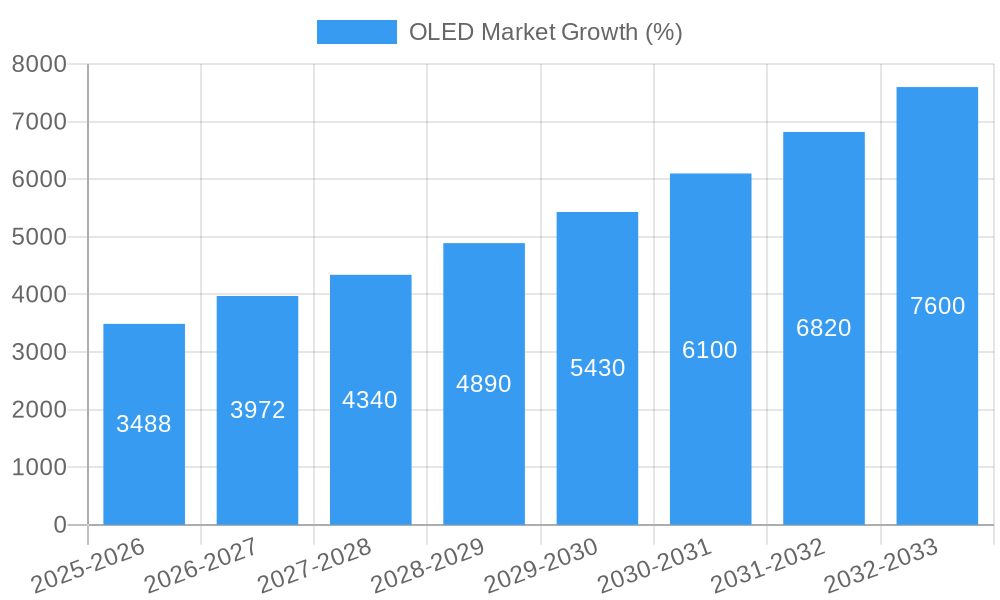
The projected market value in 2033 can be estimated based on the 2025 value and the provided CAGR. Using a compound interest calculation, the 2033 market value is projected to significantly surpass the 2025 value, reflecting the sustained growth trajectory. This prediction considers the ongoing technological innovation, increasing demand across diverse applications, and the competitive landscape that is fostering continuous improvement and affordability. The segments within the OLED market (e.g., by application type, panel size, or resolution) will likely experience varying growth rates, with high-resolution displays for premium devices and flexible displays for emerging applications exhibiting particularly strong performance. Regional variations will also exist, with regions like North America and Asia exhibiting higher adoption rates due to advanced technological infrastructure and strong consumer demand.

OLED Market Report: A Comprehensive Analysis 2019-2033
This comprehensive report provides a detailed analysis of the OLED market, offering invaluable insights for industry stakeholders, investors, and businesses seeking to understand the current market landscape and future growth potential. The study period spans from 2019-2033, with a base year of 2025 and a forecast period of 2025-2033. The report leverages extensive data from the historical period (2019-2024) to predict market trends with accuracy. The report's focus encompasses market size, CAGR, leading players, technological advancements, and emerging opportunities within the OLED display sector. Download now to gain a competitive edge!
OLED Market Market Concentration & Dynamics
This section delves into the competitive landscape of the OLED market, examining market concentration, innovation, regulatory influences, substitute technologies, end-user trends, and merger and acquisition (M&A) activities.
The OLED market exhibits a moderately concentrated structure, with a few major players holding significant market share. For example, Samsung Display Co Ltd and LG Display Co Ltd are estimated to hold xx% and xx% of the global market share in 2025 respectively. This concentration is influenced by high capital expenditure required for manufacturing advanced OLED displays. However, several smaller players are actively innovating, introducing niche technologies and products, thereby adding to market dynamism.
Key Factors Influencing Market Dynamics:
- Innovation Ecosystems: The OLED market thrives on continuous technological advancements. Companies are investing heavily in research and development (R&D) to improve display efficiency, resolution, and flexibility, leading to the emergence of products like foldable displays.
- Regulatory Frameworks: Government regulations concerning energy efficiency and environmental impact influence OLED technology adoption. Stringent standards are pushing manufacturers to develop more sustainable OLED production processes.
- Substitute Products: LCD technology remains a significant competitor, offering lower production costs in certain segments. However, OLED's superior image quality and flexibility are driving market preference.
- End-User Trends: Increasing demand for high-resolution displays in smartphones, televisions, and automotive applications is fueling OLED market growth.
- M&A Activities: The number of M&A deals in the OLED sector has shown an upward trend in recent years (xx deals in 2024), driven by the desire of major players to expand their market share and enhance technological capabilities.
OLED Market Industry Insights & Trends
The global OLED market is experiencing robust growth, driven by technological advancements and rising consumer demand. The market size is estimated to be xx Million in 2025, with a CAGR of xx% projected from 2025 to 2033. This growth is primarily fueled by the increasing penetration of OLED displays in smartphones and premium televisions, along with the burgeoning demand in automotive displays, wearables, and other emerging applications.
Technological disruptions are pivotal to the industry's dynamics. The introduction of flexible and foldable OLED displays is reshaping the landscape, offering new possibilities for device design and user experiences. Furthermore, advancements in material science are leading to improved efficiency, color gamut, and durability of OLED displays. Consumer behavior is evolving towards larger, higher-resolution, and more energy-efficient displays, all trends that directly benefit the OLED market. The increasing adoption of AI and IoT are also creating new applications for OLED technology, driving further demand.
Key Markets & Segments Leading OLED Market
The smartphone segment currently represents the largest application area for OLED displays, followed by the television market. However, the automotive and wearables sectors show tremendous growth potential.
Dominant Regions:
- Asia Pacific: This region holds the largest market share, driven by strong manufacturing capabilities, high smartphone penetration, and increasing consumer spending.
- North America: A significant market driven by consumer preferences for high-quality displays in consumer electronics.
- Europe: While smaller than Asia-Pacific and North America, Europe shows consistent growth, driven by advancements in the automotive and industrial sectors.
Growth Drivers by Region:
- Asia Pacific: Rapid economic growth, robust manufacturing infrastructure, and the high adoption rate of smartphones and consumer electronics are key drivers.
- North America: Strong consumer spending power, technological advancements, and the presence of major consumer electronics brands contribute to growth.
- Europe: Increasing adoption of OLED displays in high-end automobiles and the focus on energy-efficient technologies drive market expansion.
OLED Market Product Developments
Recent product innovations are centered around improving flexibility, efficiency, and resolution. Foldable displays are gaining prominence, offering unique design opportunities. Improvements in material science are contributing to increased brightness, wider color gamuts, and longer lifespans. The development of micro-LED technology presents a potential future competitor, but OLED technology continues to dominate in terms of current market share and ease of manufacturing. Furthermore, integration with AI and IoT enhances functionality and expands applications.
Challenges in the OLED Market Market
The OLED market faces several challenges, including high production costs compared to LCD displays, supply chain disruptions that impact component availability and manufacturing timelines, and intense competition from established players. Additionally, regulatory requirements for material sourcing and energy consumption may add to production costs. These factors may limit broader market penetration, especially in price-sensitive segments. Furthermore, the ongoing technological developments in competing display technologies pose an ongoing challenge.
Forces Driving OLED Market Growth
Several factors are driving the growth of the OLED market:
- Technological Advancements: Continuous innovation in display technology is improving efficiency, resolution, and cost-effectiveness, making OLED technology more attractive to consumers and manufacturers.
- Economic Growth: Increased disposable income in emerging economies fuels demand for premium electronic devices featuring OLED displays.
- Regulatory Support: Government policies promoting energy efficiency and environmental sustainability create incentives for the adoption of OLED technology.
Long-Term Growth Catalysts in OLED Market
Long-term growth in the OLED market is projected to be driven by continued innovations in material science resulting in lower production costs, increased lifespan, and enhanced performance. Strategic partnerships between display manufacturers and technology companies will unlock new application areas. Expanding into newer market segments like augmented reality (AR) and virtual reality (VR) headsets will provide significant growth opportunities.
Emerging Opportunities in OLED Market
Emerging opportunities include the expansion into new applications like flexible displays in wearables, automotive interiors, and large-format displays for commercial applications. The development of transparent OLED displays offers potential for innovative architectural designs and interactive displays. Growing demand for higher-resolution displays in gaming and professional monitoring further expands the market potential.
Leading Players in the OLED Market Sector
- Sony Corporation
- Pioneer Corporation
- LG Display Co Ltd
- Samsung Display Co Ltd
- Universal Display Corporation
- OLEDWorks LLC
- TDK Corporation
- OSRAM OLED GmbH
- Winstar Display Co Ltd
- Visionox Co Ltd
- Raystar Optronics Inc
- Ritek Corporation
- WiseChip Semiconductor Inc
- Hella GmbH & KGaA
- Yeolight Technology
- Acuity Brands Inc
- Kopin Corporation
- Pixelligent Technologies
- BOE Technology
- Tianma Microelectronics
- *List Not Exhaustive
Key Milestones in OLED Market Industry
- February 2024: Samsung Display unveiled robust foldable panels and introduced Flex Magic Pixel OLED technology, enhancing security measures through AI integration. The artwork 'Mr. OLEDboy' highlighted the future potential of OLED technology.
- January 2024: Apple announced the upcoming iPhone SE 4, expected to feature an OLED display from a Chinese manufacturer, signifying the expansion of OLED adoption in mid-range smartphones.
Strategic Outlook for OLED Market Market
The OLED market holds significant growth potential, driven by technological innovations, expanding applications, and increasing demand from various sectors. Strategic partnerships and investments in R&D will be crucial for manufacturers to maintain a competitive edge. Focusing on cost reduction and sustainability while exploring new markets will unlock further growth opportunities in the years to come. The continuous improvement in efficiency, resolution, and flexibility will solidify OLED's position as a leading display technology in the long term.
OLED Market Segmentation
-
1. Product Type
- 1.1. Display
- 1.2. Lighting
-
2. Technology
- 2.1. Passive Matrix OLED (PMOLED)
- 2.2. Active Matrix OLED (AMOLED)
-
3. Type
- 3.1. Flexible
- 3.2. Rigid
- 3.3. Transparent
-
4. Application
- 4.1. Mobile and Tablet
- 4.2. Television
- 4.3. Automotive Displays
- 4.4. Smartwatches & Wearables
- 4.5. Digital Signage/Large Format Display
- 4.6. PC Monitors and Laptops
- 4.7. Other Applications
OLED Market Segmentation By Geography
- 1. North America
- 2. Europe
- 3. Asia
- 4. Australia and New Zealand
- 5. Latin America
- 6. Middle East and Africa

OLED Market REPORT HIGHLIGHTS
| Aspects | Details |
|---|---|
| Study Period | 2019-2033 |
| Base Year | 2024 |
| Estimated Year | 2025 |
| Forecast Period | 2025-2033 |
| Historical Period | 2019-2024 |
| Growth Rate | CAGR of 12.31% from 2019-2033 |
| Segmentation |
|
Table of Contents
- 1. Introduction
- 1.1. Research Scope
- 1.2. Market Segmentation
- 1.3. Research Methodology
- 1.4. Definitions and Assumptions
- 2. Executive Summary
- 2.1. Introduction
- 3. Market Dynamics
- 3.1. Introduction
- 3.2. Market Drivers
- 3.2.1. Increasing Demand for Enhanced Display Quality in Wearable Devices and Smartphones; Rising Demand for Affordable and Energy-efficient OLED Lighting Solutions
- 3.3. Market Restrains
- 3.3.1. Increasing Demand for Enhanced Display Quality in Wearable Devices and Smartphones; Rising Demand for Affordable and Energy-efficient OLED Lighting Solutions
- 3.4. Market Trends
- 3.4.1. Mobile and Tablet Segment is Expected to Hold Significant Market Share
- 4. Market Factor Analysis
- 4.1. Porters Five Forces
- 4.2. Supply/Value Chain
- 4.3. PESTEL analysis
- 4.4. Market Entropy
- 4.5. Patent/Trademark Analysis
- 5. Global OLED Market Analysis, Insights and Forecast, 2019-2031
- 5.1. Market Analysis, Insights and Forecast - by Product Type
- 5.1.1. Display
- 5.1.2. Lighting
- 5.2. Market Analysis, Insights and Forecast - by Technology
- 5.2.1. Passive Matrix OLED (PMOLED)
- 5.2.2. Active Matrix OLED (AMOLED)
- 5.3. Market Analysis, Insights and Forecast - by Type
- 5.3.1. Flexible
- 5.3.2. Rigid
- 5.3.3. Transparent
- 5.4. Market Analysis, Insights and Forecast - by Application
- 5.4.1. Mobile and Tablet
- 5.4.2. Television
- 5.4.3. Automotive Displays
- 5.4.4. Smartwatches & Wearables
- 5.4.5. Digital Signage/Large Format Display
- 5.4.6. PC Monitors and Laptops
- 5.4.7. Other Applications
- 5.5. Market Analysis, Insights and Forecast - by Region
- 5.5.1. North America
- 5.5.2. Europe
- 5.5.3. Asia
- 5.5.4. Australia and New Zealand
- 5.5.5. Latin America
- 5.5.6. Middle East and Africa
- 5.1. Market Analysis, Insights and Forecast - by Product Type
- 6. North America OLED Market Analysis, Insights and Forecast, 2019-2031
- 6.1. Market Analysis, Insights and Forecast - by Product Type
- 6.1.1. Display
- 6.1.2. Lighting
- 6.2. Market Analysis, Insights and Forecast - by Technology
- 6.2.1. Passive Matrix OLED (PMOLED)
- 6.2.2. Active Matrix OLED (AMOLED)
- 6.3. Market Analysis, Insights and Forecast - by Type
- 6.3.1. Flexible
- 6.3.2. Rigid
- 6.3.3. Transparent
- 6.4. Market Analysis, Insights and Forecast - by Application
- 6.4.1. Mobile and Tablet
- 6.4.2. Television
- 6.4.3. Automotive Displays
- 6.4.4. Smartwatches & Wearables
- 6.4.5. Digital Signage/Large Format Display
- 6.4.6. PC Monitors and Laptops
- 6.4.7. Other Applications
- 6.1. Market Analysis, Insights and Forecast - by Product Type
- 7. Europe OLED Market Analysis, Insights and Forecast, 2019-2031
- 7.1. Market Analysis, Insights and Forecast - by Product Type
- 7.1.1. Display
- 7.1.2. Lighting
- 7.2. Market Analysis, Insights and Forecast - by Technology
- 7.2.1. Passive Matrix OLED (PMOLED)
- 7.2.2. Active Matrix OLED (AMOLED)
- 7.3. Market Analysis, Insights and Forecast - by Type
- 7.3.1. Flexible
- 7.3.2. Rigid
- 7.3.3. Transparent
- 7.4. Market Analysis, Insights and Forecast - by Application
- 7.4.1. Mobile and Tablet
- 7.4.2. Television
- 7.4.3. Automotive Displays
- 7.4.4. Smartwatches & Wearables
- 7.4.5. Digital Signage/Large Format Display
- 7.4.6. PC Monitors and Laptops
- 7.4.7. Other Applications
- 7.1. Market Analysis, Insights and Forecast - by Product Type
- 8. Asia OLED Market Analysis, Insights and Forecast, 2019-2031
- 8.1. Market Analysis, Insights and Forecast - by Product Type
- 8.1.1. Display
- 8.1.2. Lighting
- 8.2. Market Analysis, Insights and Forecast - by Technology
- 8.2.1. Passive Matrix OLED (PMOLED)
- 8.2.2. Active Matrix OLED (AMOLED)
- 8.3. Market Analysis, Insights and Forecast - by Type
- 8.3.1. Flexible
- 8.3.2. Rigid
- 8.3.3. Transparent
- 8.4. Market Analysis, Insights and Forecast - by Application
- 8.4.1. Mobile and Tablet
- 8.4.2. Television
- 8.4.3. Automotive Displays
- 8.4.4. Smartwatches & Wearables
- 8.4.5. Digital Signage/Large Format Display
- 8.4.6. PC Monitors and Laptops
- 8.4.7. Other Applications
- 8.1. Market Analysis, Insights and Forecast - by Product Type
- 9. Australia and New Zealand OLED Market Analysis, Insights and Forecast, 2019-2031
- 9.1. Market Analysis, Insights and Forecast - by Product Type
- 9.1.1. Display
- 9.1.2. Lighting
- 9.2. Market Analysis, Insights and Forecast - by Technology
- 9.2.1. Passive Matrix OLED (PMOLED)
- 9.2.2. Active Matrix OLED (AMOLED)
- 9.3. Market Analysis, Insights and Forecast - by Type
- 9.3.1. Flexible
- 9.3.2. Rigid
- 9.3.3. Transparent
- 9.4. Market Analysis, Insights and Forecast - by Application
- 9.4.1. Mobile and Tablet
- 9.4.2. Television
- 9.4.3. Automotive Displays
- 9.4.4. Smartwatches & Wearables
- 9.4.5. Digital Signage/Large Format Display
- 9.4.6. PC Monitors and Laptops
- 9.4.7. Other Applications
- 9.1. Market Analysis, Insights and Forecast - by Product Type
- 10. Latin America OLED Market Analysis, Insights and Forecast, 2019-2031
- 10.1. Market Analysis, Insights and Forecast - by Product Type
- 10.1.1. Display
- 10.1.2. Lighting
- 10.2. Market Analysis, Insights and Forecast - by Technology
- 10.2.1. Passive Matrix OLED (PMOLED)
- 10.2.2. Active Matrix OLED (AMOLED)
- 10.3. Market Analysis, Insights and Forecast - by Type
- 10.3.1. Flexible
- 10.3.2. Rigid
- 10.3.3. Transparent
- 10.4. Market Analysis, Insights and Forecast - by Application
- 10.4.1. Mobile and Tablet
- 10.4.2. Television
- 10.4.3. Automotive Displays
- 10.4.4. Smartwatches & Wearables
- 10.4.5. Digital Signage/Large Format Display
- 10.4.6. PC Monitors and Laptops
- 10.4.7. Other Applications
- 10.1. Market Analysis, Insights and Forecast - by Product Type
- 11. Middle East and Africa OLED Market Analysis, Insights and Forecast, 2019-2031
- 11.1. Market Analysis, Insights and Forecast - by Product Type
- 11.1.1. Display
- 11.1.2. Lighting
- 11.2. Market Analysis, Insights and Forecast - by Technology
- 11.2.1. Passive Matrix OLED (PMOLED)
- 11.2.2. Active Matrix OLED (AMOLED)
- 11.3. Market Analysis, Insights and Forecast - by Type
- 11.3.1. Flexible
- 11.3.2. Rigid
- 11.3.3. Transparent
- 11.4. Market Analysis, Insights and Forecast - by Application
- 11.4.1. Mobile and Tablet
- 11.4.2. Television
- 11.4.3. Automotive Displays
- 11.4.4. Smartwatches & Wearables
- 11.4.5. Digital Signage/Large Format Display
- 11.4.6. PC Monitors and Laptops
- 11.4.7. Other Applications
- 11.1. Market Analysis, Insights and Forecast - by Product Type
- 12. Competitive Analysis
- 12.1. Global Market Share Analysis 2024
- 12.2. Company Profiles
- 12.2.1 Sony Corporation
- 12.2.1.1. Overview
- 12.2.1.2. Products
- 12.2.1.3. SWOT Analysis
- 12.2.1.4. Recent Developments
- 12.2.1.5. Financials (Based on Availability)
- 12.2.2 Pioneer Corporation
- 12.2.2.1. Overview
- 12.2.2.2. Products
- 12.2.2.3. SWOT Analysis
- 12.2.2.4. Recent Developments
- 12.2.2.5. Financials (Based on Availability)
- 12.2.3 LG Display Co Ltd
- 12.2.3.1. Overview
- 12.2.3.2. Products
- 12.2.3.3. SWOT Analysis
- 12.2.3.4. Recent Developments
- 12.2.3.5. Financials (Based on Availability)
- 12.2.4 Samsung Display Co Ltd
- 12.2.4.1. Overview
- 12.2.4.2. Products
- 12.2.4.3. SWOT Analysis
- 12.2.4.4. Recent Developments
- 12.2.4.5. Financials (Based on Availability)
- 12.2.5 Universal Display Corporation
- 12.2.5.1. Overview
- 12.2.5.2. Products
- 12.2.5.3. SWOT Analysis
- 12.2.5.4. Recent Developments
- 12.2.5.5. Financials (Based on Availability)
- 12.2.6 OLEDWorks LLC
- 12.2.6.1. Overview
- 12.2.6.2. Products
- 12.2.6.3. SWOT Analysis
- 12.2.6.4. Recent Developments
- 12.2.6.5. Financials (Based on Availability)
- 12.2.7 TDK Corporation
- 12.2.7.1. Overview
- 12.2.7.2. Products
- 12.2.7.3. SWOT Analysis
- 12.2.7.4. Recent Developments
- 12.2.7.5. Financials (Based on Availability)
- 12.2.8 OSRAM OLED GmbH
- 12.2.8.1. Overview
- 12.2.8.2. Products
- 12.2.8.3. SWOT Analysis
- 12.2.8.4. Recent Developments
- 12.2.8.5. Financials (Based on Availability)
- 12.2.9 Winstar Display Co Ltd
- 12.2.9.1. Overview
- 12.2.9.2. Products
- 12.2.9.3. SWOT Analysis
- 12.2.9.4. Recent Developments
- 12.2.9.5. Financials (Based on Availability)
- 12.2.10 Visionox Co Ltd
- 12.2.10.1. Overview
- 12.2.10.2. Products
- 12.2.10.3. SWOT Analysis
- 12.2.10.4. Recent Developments
- 12.2.10.5. Financials (Based on Availability)
- 12.2.11 Raystar Optronics Inc
- 12.2.11.1. Overview
- 12.2.11.2. Products
- 12.2.11.3. SWOT Analysis
- 12.2.11.4. Recent Developments
- 12.2.11.5. Financials (Based on Availability)
- 12.2.12 Ritek Corporation
- 12.2.12.1. Overview
- 12.2.12.2. Products
- 12.2.12.3. SWOT Analysis
- 12.2.12.4. Recent Developments
- 12.2.12.5. Financials (Based on Availability)
- 12.2.13 WiseChip Semiconductor Inc
- 12.2.13.1. Overview
- 12.2.13.2. Products
- 12.2.13.3. SWOT Analysis
- 12.2.13.4. Recent Developments
- 12.2.13.5. Financials (Based on Availability)
- 12.2.14 Hella GmbH & KGaA
- 12.2.14.1. Overview
- 12.2.14.2. Products
- 12.2.14.3. SWOT Analysis
- 12.2.14.4. Recent Developments
- 12.2.14.5. Financials (Based on Availability)
- 12.2.15 Yeolight Technology
- 12.2.15.1. Overview
- 12.2.15.2. Products
- 12.2.15.3. SWOT Analysis
- 12.2.15.4. Recent Developments
- 12.2.15.5. Financials (Based on Availability)
- 12.2.16 Acuity Brands Inc
- 12.2.16.1. Overview
- 12.2.16.2. Products
- 12.2.16.3. SWOT Analysis
- 12.2.16.4. Recent Developments
- 12.2.16.5. Financials (Based on Availability)
- 12.2.17 Kopin Corporation
- 12.2.17.1. Overview
- 12.2.17.2. Products
- 12.2.17.3. SWOT Analysis
- 12.2.17.4. Recent Developments
- 12.2.17.5. Financials (Based on Availability)
- 12.2.18 Pixelligent Technologies
- 12.2.18.1. Overview
- 12.2.18.2. Products
- 12.2.18.3. SWOT Analysis
- 12.2.18.4. Recent Developments
- 12.2.18.5. Financials (Based on Availability)
- 12.2.19 BOE Technology
- 12.2.19.1. Overview
- 12.2.19.2. Products
- 12.2.19.3. SWOT Analysis
- 12.2.19.4. Recent Developments
- 12.2.19.5. Financials (Based on Availability)
- 12.2.20 Tianma Microelectronics*List Not Exhaustive
- 12.2.20.1. Overview
- 12.2.20.2. Products
- 12.2.20.3. SWOT Analysis
- 12.2.20.4. Recent Developments
- 12.2.20.5. Financials (Based on Availability)
- 12.2.1 Sony Corporation
List of Figures
- Figure 1: Global OLED Market Revenue Breakdown (Million, %) by Region 2024 & 2032
- Figure 2: Global OLED Market Volume Breakdown (Billion, %) by Region 2024 & 2032
- Figure 3: North America OLED Market Revenue (Million), by Product Type 2024 & 2032
- Figure 4: North America OLED Market Volume (Billion), by Product Type 2024 & 2032
- Figure 5: North America OLED Market Revenue Share (%), by Product Type 2024 & 2032
- Figure 6: North America OLED Market Volume Share (%), by Product Type 2024 & 2032
- Figure 7: North America OLED Market Revenue (Million), by Technology 2024 & 2032
- Figure 8: North America OLED Market Volume (Billion), by Technology 2024 & 2032
- Figure 9: North America OLED Market Revenue Share (%), by Technology 2024 & 2032
- Figure 10: North America OLED Market Volume Share (%), by Technology 2024 & 2032
- Figure 11: North America OLED Market Revenue (Million), by Type 2024 & 2032
- Figure 12: North America OLED Market Volume (Billion), by Type 2024 & 2032
- Figure 13: North America OLED Market Revenue Share (%), by Type 2024 & 2032
- Figure 14: North America OLED Market Volume Share (%), by Type 2024 & 2032
- Figure 15: North America OLED Market Revenue (Million), by Application 2024 & 2032
- Figure 16: North America OLED Market Volume (Billion), by Application 2024 & 2032
- Figure 17: North America OLED Market Revenue Share (%), by Application 2024 & 2032
- Figure 18: North America OLED Market Volume Share (%), by Application 2024 & 2032
- Figure 19: North America OLED Market Revenue (Million), by Country 2024 & 2032
- Figure 20: North America OLED Market Volume (Billion), by Country 2024 & 2032
- Figure 21: North America OLED Market Revenue Share (%), by Country 2024 & 2032
- Figure 22: North America OLED Market Volume Share (%), by Country 2024 & 2032
- Figure 23: Europe OLED Market Revenue (Million), by Product Type 2024 & 2032
- Figure 24: Europe OLED Market Volume (Billion), by Product Type 2024 & 2032
- Figure 25: Europe OLED Market Revenue Share (%), by Product Type 2024 & 2032
- Figure 26: Europe OLED Market Volume Share (%), by Product Type 2024 & 2032
- Figure 27: Europe OLED Market Revenue (Million), by Technology 2024 & 2032
- Figure 28: Europe OLED Market Volume (Billion), by Technology 2024 & 2032
- Figure 29: Europe OLED Market Revenue Share (%), by Technology 2024 & 2032
- Figure 30: Europe OLED Market Volume Share (%), by Technology 2024 & 2032
- Figure 31: Europe OLED Market Revenue (Million), by Type 2024 & 2032
- Figure 32: Europe OLED Market Volume (Billion), by Type 2024 & 2032
- Figure 33: Europe OLED Market Revenue Share (%), by Type 2024 & 2032
- Figure 34: Europe OLED Market Volume Share (%), by Type 2024 & 2032
- Figure 35: Europe OLED Market Revenue (Million), by Application 2024 & 2032
- Figure 36: Europe OLED Market Volume (Billion), by Application 2024 & 2032
- Figure 37: Europe OLED Market Revenue Share (%), by Application 2024 & 2032
- Figure 38: Europe OLED Market Volume Share (%), by Application 2024 & 2032
- Figure 39: Europe OLED Market Revenue (Million), by Country 2024 & 2032
- Figure 40: Europe OLED Market Volume (Billion), by Country 2024 & 2032
- Figure 41: Europe OLED Market Revenue Share (%), by Country 2024 & 2032
- Figure 42: Europe OLED Market Volume Share (%), by Country 2024 & 2032
- Figure 43: Asia OLED Market Revenue (Million), by Product Type 2024 & 2032
- Figure 44: Asia OLED Market Volume (Billion), by Product Type 2024 & 2032
- Figure 45: Asia OLED Market Revenue Share (%), by Product Type 2024 & 2032
- Figure 46: Asia OLED Market Volume Share (%), by Product Type 2024 & 2032
- Figure 47: Asia OLED Market Revenue (Million), by Technology 2024 & 2032
- Figure 48: Asia OLED Market Volume (Billion), by Technology 2024 & 2032
- Figure 49: Asia OLED Market Revenue Share (%), by Technology 2024 & 2032
- Figure 50: Asia OLED Market Volume Share (%), by Technology 2024 & 2032
- Figure 51: Asia OLED Market Revenue (Million), by Type 2024 & 2032
- Figure 52: Asia OLED Market Volume (Billion), by Type 2024 & 2032
- Figure 53: Asia OLED Market Revenue Share (%), by Type 2024 & 2032
- Figure 54: Asia OLED Market Volume Share (%), by Type 2024 & 2032
- Figure 55: Asia OLED Market Revenue (Million), by Application 2024 & 2032
- Figure 56: Asia OLED Market Volume (Billion), by Application 2024 & 2032
- Figure 57: Asia OLED Market Revenue Share (%), by Application 2024 & 2032
- Figure 58: Asia OLED Market Volume Share (%), by Application 2024 & 2032
- Figure 59: Asia OLED Market Revenue (Million), by Country 2024 & 2032
- Figure 60: Asia OLED Market Volume (Billion), by Country 2024 & 2032
- Figure 61: Asia OLED Market Revenue Share (%), by Country 2024 & 2032
- Figure 62: Asia OLED Market Volume Share (%), by Country 2024 & 2032
- Figure 63: Australia and New Zealand OLED Market Revenue (Million), by Product Type 2024 & 2032
- Figure 64: Australia and New Zealand OLED Market Volume (Billion), by Product Type 2024 & 2032
- Figure 65: Australia and New Zealand OLED Market Revenue Share (%), by Product Type 2024 & 2032
- Figure 66: Australia and New Zealand OLED Market Volume Share (%), by Product Type 2024 & 2032
- Figure 67: Australia and New Zealand OLED Market Revenue (Million), by Technology 2024 & 2032
- Figure 68: Australia and New Zealand OLED Market Volume (Billion), by Technology 2024 & 2032
- Figure 69: Australia and New Zealand OLED Market Revenue Share (%), by Technology 2024 & 2032
- Figure 70: Australia and New Zealand OLED Market Volume Share (%), by Technology 2024 & 2032
- Figure 71: Australia and New Zealand OLED Market Revenue (Million), by Type 2024 & 2032
- Figure 72: Australia and New Zealand OLED Market Volume (Billion), by Type 2024 & 2032
- Figure 73: Australia and New Zealand OLED Market Revenue Share (%), by Type 2024 & 2032
- Figure 74: Australia and New Zealand OLED Market Volume Share (%), by Type 2024 & 2032
- Figure 75: Australia and New Zealand OLED Market Revenue (Million), by Application 2024 & 2032
- Figure 76: Australia and New Zealand OLED Market Volume (Billion), by Application 2024 & 2032
- Figure 77: Australia and New Zealand OLED Market Revenue Share (%), by Application 2024 & 2032
- Figure 78: Australia and New Zealand OLED Market Volume Share (%), by Application 2024 & 2032
- Figure 79: Australia and New Zealand OLED Market Revenue (Million), by Country 2024 & 2032
- Figure 80: Australia and New Zealand OLED Market Volume (Billion), by Country 2024 & 2032
- Figure 81: Australia and New Zealand OLED Market Revenue Share (%), by Country 2024 & 2032
- Figure 82: Australia and New Zealand OLED Market Volume Share (%), by Country 2024 & 2032
- Figure 83: Latin America OLED Market Revenue (Million), by Product Type 2024 & 2032
- Figure 84: Latin America OLED Market Volume (Billion), by Product Type 2024 & 2032
- Figure 85: Latin America OLED Market Revenue Share (%), by Product Type 2024 & 2032
- Figure 86: Latin America OLED Market Volume Share (%), by Product Type 2024 & 2032
- Figure 87: Latin America OLED Market Revenue (Million), by Technology 2024 & 2032
- Figure 88: Latin America OLED Market Volume (Billion), by Technology 2024 & 2032
- Figure 89: Latin America OLED Market Revenue Share (%), by Technology 2024 & 2032
- Figure 90: Latin America OLED Market Volume Share (%), by Technology 2024 & 2032
- Figure 91: Latin America OLED Market Revenue (Million), by Type 2024 & 2032
- Figure 92: Latin America OLED Market Volume (Billion), by Type 2024 & 2032
- Figure 93: Latin America OLED Market Revenue Share (%), by Type 2024 & 2032
- Figure 94: Latin America OLED Market Volume Share (%), by Type 2024 & 2032
- Figure 95: Latin America OLED Market Revenue (Million), by Application 2024 & 2032
- Figure 96: Latin America OLED Market Volume (Billion), by Application 2024 & 2032
- Figure 97: Latin America OLED Market Revenue Share (%), by Application 2024 & 2032
- Figure 98: Latin America OLED Market Volume Share (%), by Application 2024 & 2032
- Figure 99: Latin America OLED Market Revenue (Million), by Country 2024 & 2032
- Figure 100: Latin America OLED Market Volume (Billion), by Country 2024 & 2032
- Figure 101: Latin America OLED Market Revenue Share (%), by Country 2024 & 2032
- Figure 102: Latin America OLED Market Volume Share (%), by Country 2024 & 2032
- Figure 103: Middle East and Africa OLED Market Revenue (Million), by Product Type 2024 & 2032
- Figure 104: Middle East and Africa OLED Market Volume (Billion), by Product Type 2024 & 2032
- Figure 105: Middle East and Africa OLED Market Revenue Share (%), by Product Type 2024 & 2032
- Figure 106: Middle East and Africa OLED Market Volume Share (%), by Product Type 2024 & 2032
- Figure 107: Middle East and Africa OLED Market Revenue (Million), by Technology 2024 & 2032
- Figure 108: Middle East and Africa OLED Market Volume (Billion), by Technology 2024 & 2032
- Figure 109: Middle East and Africa OLED Market Revenue Share (%), by Technology 2024 & 2032
- Figure 110: Middle East and Africa OLED Market Volume Share (%), by Technology 2024 & 2032
- Figure 111: Middle East and Africa OLED Market Revenue (Million), by Type 2024 & 2032
- Figure 112: Middle East and Africa OLED Market Volume (Billion), by Type 2024 & 2032
- Figure 113: Middle East and Africa OLED Market Revenue Share (%), by Type 2024 & 2032
- Figure 114: Middle East and Africa OLED Market Volume Share (%), by Type 2024 & 2032
- Figure 115: Middle East and Africa OLED Market Revenue (Million), by Application 2024 & 2032
- Figure 116: Middle East and Africa OLED Market Volume (Billion), by Application 2024 & 2032
- Figure 117: Middle East and Africa OLED Market Revenue Share (%), by Application 2024 & 2032
- Figure 118: Middle East and Africa OLED Market Volume Share (%), by Application 2024 & 2032
- Figure 119: Middle East and Africa OLED Market Revenue (Million), by Country 2024 & 2032
- Figure 120: Middle East and Africa OLED Market Volume (Billion), by Country 2024 & 2032
- Figure 121: Middle East and Africa OLED Market Revenue Share (%), by Country 2024 & 2032
- Figure 122: Middle East and Africa OLED Market Volume Share (%), by Country 2024 & 2032
List of Tables
- Table 1: Global OLED Market Revenue Million Forecast, by Region 2019 & 2032
- Table 2: Global OLED Market Volume Billion Forecast, by Region 2019 & 2032
- Table 3: Global OLED Market Revenue Million Forecast, by Product Type 2019 & 2032
- Table 4: Global OLED Market Volume Billion Forecast, by Product Type 2019 & 2032
- Table 5: Global OLED Market Revenue Million Forecast, by Technology 2019 & 2032
- Table 6: Global OLED Market Volume Billion Forecast, by Technology 2019 & 2032
- Table 7: Global OLED Market Revenue Million Forecast, by Type 2019 & 2032
- Table 8: Global OLED Market Volume Billion Forecast, by Type 2019 & 2032
- Table 9: Global OLED Market Revenue Million Forecast, by Application 2019 & 2032
- Table 10: Global OLED Market Volume Billion Forecast, by Application 2019 & 2032
- Table 11: Global OLED Market Revenue Million Forecast, by Region 2019 & 2032
- Table 12: Global OLED Market Volume Billion Forecast, by Region 2019 & 2032
- Table 13: Global OLED Market Revenue Million Forecast, by Product Type 2019 & 2032
- Table 14: Global OLED Market Volume Billion Forecast, by Product Type 2019 & 2032
- Table 15: Global OLED Market Revenue Million Forecast, by Technology 2019 & 2032
- Table 16: Global OLED Market Volume Billion Forecast, by Technology 2019 & 2032
- Table 17: Global OLED Market Revenue Million Forecast, by Type 2019 & 2032
- Table 18: Global OLED Market Volume Billion Forecast, by Type 2019 & 2032
- Table 19: Global OLED Market Revenue Million Forecast, by Application 2019 & 2032
- Table 20: Global OLED Market Volume Billion Forecast, by Application 2019 & 2032
- Table 21: Global OLED Market Revenue Million Forecast, by Country 2019 & 2032
- Table 22: Global OLED Market Volume Billion Forecast, by Country 2019 & 2032
- Table 23: Global OLED Market Revenue Million Forecast, by Product Type 2019 & 2032
- Table 24: Global OLED Market Volume Billion Forecast, by Product Type 2019 & 2032
- Table 25: Global OLED Market Revenue Million Forecast, by Technology 2019 & 2032
- Table 26: Global OLED Market Volume Billion Forecast, by Technology 2019 & 2032
- Table 27: Global OLED Market Revenue Million Forecast, by Type 2019 & 2032
- Table 28: Global OLED Market Volume Billion Forecast, by Type 2019 & 2032
- Table 29: Global OLED Market Revenue Million Forecast, by Application 2019 & 2032
- Table 30: Global OLED Market Volume Billion Forecast, by Application 2019 & 2032
- Table 31: Global OLED Market Revenue Million Forecast, by Country 2019 & 2032
- Table 32: Global OLED Market Volume Billion Forecast, by Country 2019 & 2032
- Table 33: Global OLED Market Revenue Million Forecast, by Product Type 2019 & 2032
- Table 34: Global OLED Market Volume Billion Forecast, by Product Type 2019 & 2032
- Table 35: Global OLED Market Revenue Million Forecast, by Technology 2019 & 2032
- Table 36: Global OLED Market Volume Billion Forecast, by Technology 2019 & 2032
- Table 37: Global OLED Market Revenue Million Forecast, by Type 2019 & 2032
- Table 38: Global OLED Market Volume Billion Forecast, by Type 2019 & 2032
- Table 39: Global OLED Market Revenue Million Forecast, by Application 2019 & 2032
- Table 40: Global OLED Market Volume Billion Forecast, by Application 2019 & 2032
- Table 41: Global OLED Market Revenue Million Forecast, by Country 2019 & 2032
- Table 42: Global OLED Market Volume Billion Forecast, by Country 2019 & 2032
- Table 43: Global OLED Market Revenue Million Forecast, by Product Type 2019 & 2032
- Table 44: Global OLED Market Volume Billion Forecast, by Product Type 2019 & 2032
- Table 45: Global OLED Market Revenue Million Forecast, by Technology 2019 & 2032
- Table 46: Global OLED Market Volume Billion Forecast, by Technology 2019 & 2032
- Table 47: Global OLED Market Revenue Million Forecast, by Type 2019 & 2032
- Table 48: Global OLED Market Volume Billion Forecast, by Type 2019 & 2032
- Table 49: Global OLED Market Revenue Million Forecast, by Application 2019 & 2032
- Table 50: Global OLED Market Volume Billion Forecast, by Application 2019 & 2032
- Table 51: Global OLED Market Revenue Million Forecast, by Country 2019 & 2032
- Table 52: Global OLED Market Volume Billion Forecast, by Country 2019 & 2032
- Table 53: Global OLED Market Revenue Million Forecast, by Product Type 2019 & 2032
- Table 54: Global OLED Market Volume Billion Forecast, by Product Type 2019 & 2032
- Table 55: Global OLED Market Revenue Million Forecast, by Technology 2019 & 2032
- Table 56: Global OLED Market Volume Billion Forecast, by Technology 2019 & 2032
- Table 57: Global OLED Market Revenue Million Forecast, by Type 2019 & 2032
- Table 58: Global OLED Market Volume Billion Forecast, by Type 2019 & 2032
- Table 59: Global OLED Market Revenue Million Forecast, by Application 2019 & 2032
- Table 60: Global OLED Market Volume Billion Forecast, by Application 2019 & 2032
- Table 61: Global OLED Market Revenue Million Forecast, by Country 2019 & 2032
- Table 62: Global OLED Market Volume Billion Forecast, by Country 2019 & 2032
- Table 63: Global OLED Market Revenue Million Forecast, by Product Type 2019 & 2032
- Table 64: Global OLED Market Volume Billion Forecast, by Product Type 2019 & 2032
- Table 65: Global OLED Market Revenue Million Forecast, by Technology 2019 & 2032
- Table 66: Global OLED Market Volume Billion Forecast, by Technology 2019 & 2032
- Table 67: Global OLED Market Revenue Million Forecast, by Type 2019 & 2032
- Table 68: Global OLED Market Volume Billion Forecast, by Type 2019 & 2032
- Table 69: Global OLED Market Revenue Million Forecast, by Application 2019 & 2032
- Table 70: Global OLED Market Volume Billion Forecast, by Application 2019 & 2032
- Table 71: Global OLED Market Revenue Million Forecast, by Country 2019 & 2032
- Table 72: Global OLED Market Volume Billion Forecast, by Country 2019 & 2032
Frequently Asked Questions
1. What is the projected Compound Annual Growth Rate (CAGR) of the OLED Market?
The projected CAGR is approximately 12.31%.
2. Which companies are prominent players in the OLED Market?
Key companies in the market include Sony Corporation, Pioneer Corporation, LG Display Co Ltd, Samsung Display Co Ltd, Universal Display Corporation, OLEDWorks LLC, TDK Corporation, OSRAM OLED GmbH, Winstar Display Co Ltd, Visionox Co Ltd, Raystar Optronics Inc, Ritek Corporation, WiseChip Semiconductor Inc, Hella GmbH & KGaA, Yeolight Technology, Acuity Brands Inc, Kopin Corporation, Pixelligent Technologies, BOE Technology, Tianma Microelectronics*List Not Exhaustive.
3. What are the main segments of the OLED Market?
The market segments include Product Type, Technology, Type, Application.
4. Can you provide details about the market size?
The market size is estimated to be USD 28.14 Million as of 2022.
5. What are some drivers contributing to market growth?
Increasing Demand for Enhanced Display Quality in Wearable Devices and Smartphones; Rising Demand for Affordable and Energy-efficient OLED Lighting Solutions.
6. What are the notable trends driving market growth?
Mobile and Tablet Segment is Expected to Hold Significant Market Share.
7. Are there any restraints impacting market growth?
Increasing Demand for Enhanced Display Quality in Wearable Devices and Smartphones; Rising Demand for Affordable and Energy-efficient OLED Lighting Solutions.
8. Can you provide examples of recent developments in the market?
February 2024: Samsung Display presented robust foldable panels and introduced Flex Magic Pixel OLED technology, which collaborates with AI-enabled smart devices to enhance security measures. The artwork 'Mr. OLEDboy,' created by the esteemed London-based fashion illustrator Mr. Slowboy, imagines the future shaped by OLED technology.January 2024: Apple announced the introduction of a new midrange iPhone model. According to a report, the forthcoming iPhone SE 4, which represents the fourth generation of the 'Special Edition' iPhone, is anticipated to include an OLED display produced by a Chinese manufacturer.
9. What pricing options are available for accessing the report?
Pricing options include single-user, multi-user, and enterprise licenses priced at USD 4750, USD 5250, and USD 8750 respectively.
10. Is the market size provided in terms of value or volume?
The market size is provided in terms of value, measured in Million and volume, measured in Billion.
11. Are there any specific market keywords associated with the report?
Yes, the market keyword associated with the report is "OLED Market," which aids in identifying and referencing the specific market segment covered.
12. How do I determine which pricing option suits my needs best?
The pricing options vary based on user requirements and access needs. Individual users may opt for single-user licenses, while businesses requiring broader access may choose multi-user or enterprise licenses for cost-effective access to the report.
13. Are there any additional resources or data provided in the OLED Market report?
While the report offers comprehensive insights, it's advisable to review the specific contents or supplementary materials provided to ascertain if additional resources or data are available.
14. How can I stay updated on further developments or reports in the OLED Market?
To stay informed about further developments, trends, and reports in the OLED Market, consider subscribing to industry newsletters, following relevant companies and organizations, or regularly checking reputable industry news sources and publications.
Methodology
Step 1 - Identification of Relevant Samples Size from Population Database


Step 2 - Approaches for Defining Global Market Size (Value, Volume* & Price*)

Note*: In applicable scenarios
Step 3 - Data Sources
Primary Research
- Web Analytics
- Survey Reports
- Research Institute
- Latest Research Reports
- Opinion Leaders
Secondary Research
- Annual Reports
- White Paper
- Latest Press Release
- Industry Association
- Paid Database
- Investor Presentations

Step 4 - Data Triangulation
Involves using different sources of information in order to increase the validity of a study
These sources are likely to be stakeholders in a program - participants, other researchers, program staff, other community members, and so on.
Then we put all data in single framework & apply various statistical tools to find out the dynamic on the market.
During the analysis stage, feedback from the stakeholder groups would be compared to determine areas of agreement as well as areas of divergence
