

Key Insights
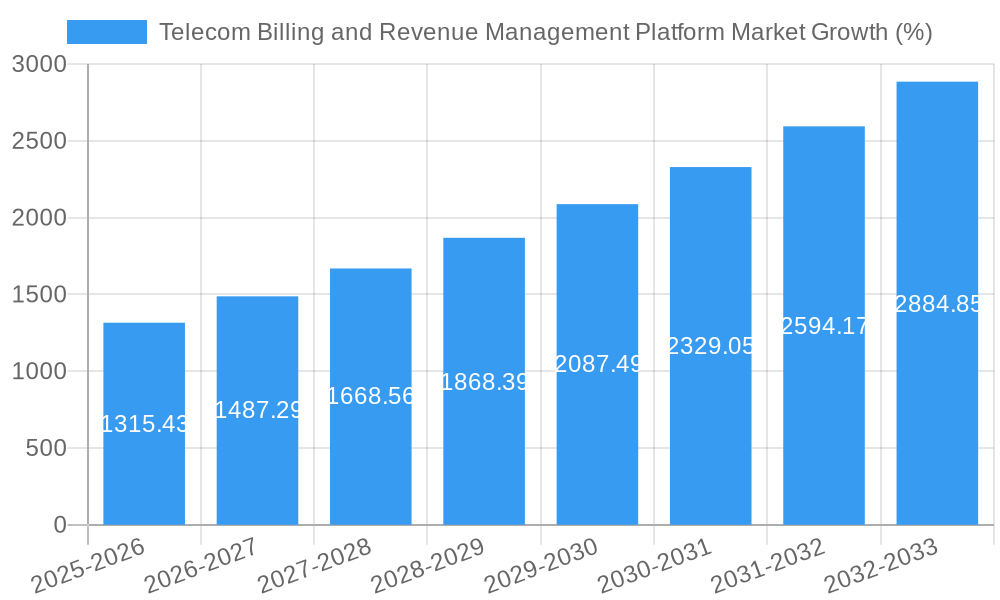
The Telecom Billing and Revenue Management Platform market is experiencing robust growth, projected to reach $14.21 billion in 2025 and maintain a Compound Annual Growth Rate (CAGR) of 9.43% from 2025 to 2033. This expansion is driven by several key factors. The increasing adoption of cloud-based solutions offers scalability and cost-effectiveness, attracting both mobile operators and internet service providers. Furthermore, the rising demand for advanced analytics and real-time billing capabilities empowers telecom companies to optimize revenue streams and enhance customer experiences. The market is segmented by deployment (on-premise and cloud), type (software and service), and operator (mobile operators and internet service providers), each segment contributing to the overall market dynamism. North America currently holds a significant market share, propelled by early adoption of advanced technologies and a strong digital infrastructure. However, the Asia-Pacific region is poised for rapid growth, fueled by increasing smartphone penetration and expanding internet access. Competition among established players like Ericsson, Nokia, and Huawei, alongside emerging innovative companies, is intensifying, leading to continuous product enhancements and competitive pricing. The market's future trajectory is positive, driven by technological advancements like 5G implementation and the growing adoption of IoT devices, necessitating robust billing and revenue management systems.
The competitive landscape is characterized by a mix of established players and emerging companies. Established players such as Ericsson, Nokia, and Huawei leverage their extensive experience and global reach to maintain market dominance. However, agile smaller players are innovating with specialized solutions, offering niche capabilities and competitive pricing. The market's future will likely see increased consolidation, partnerships, and strategic acquisitions as companies seek to broaden their capabilities and geographical reach. The adoption of artificial intelligence (AI) and machine learning (ML) is anticipated to significantly transform the market, improving operational efficiency, fraud detection, and revenue optimization. Continued investment in research and development focused on enhancing user experience and real-time data analytics will further shape the market's evolution.

Telecom Billing and Revenue Management Platform Market: A Comprehensive Report (2019-2033)
This in-depth report provides a comprehensive analysis of the Telecom Billing and Revenue Management Platform market, offering invaluable insights for stakeholders across the telecom industry. The study period covers 2019-2033, with a base year of 2025 and a forecast period spanning 2025-2033. The report leverages rigorous data analysis to provide actionable intelligence on market size (xx Million), CAGR (xx%), and key trends shaping this dynamic sector.
Telecom Billing and Revenue Management Platform Market Concentration & Dynamics
The Telecom Billing and Revenue Management Platform market exhibits a moderately concentrated landscape, with key players like Ericsson, Huawei Technologies, and NetCracker Technology Corporation holding significant market share. However, a diverse range of smaller companies and niche players contribute to a vibrant competitive ecosystem. Market share fluctuations are influenced by technological advancements, strategic partnerships, and mergers & acquisitions (M&A). The historical period (2019-2024) witnessed xx M&A deals, suggesting a strong drive towards consolidation. Regulatory frameworks, particularly concerning data privacy and security, significantly impact market dynamics. The increasing adoption of cloud-based solutions and the rise of 5G networks are driving innovation, while the emergence of alternative billing solutions presents competitive challenges. End-user trends, such as the demand for personalized services and flexible pricing plans, further influence market growth.
- Market Concentration: Moderately Concentrated
- M&A Activity (2019-2024): xx Deals
- Key Drivers: Technological advancements, strategic partnerships, regulatory changes
- Challenges: Competition from alternative solutions, data privacy regulations
Telecom Billing and Revenue Management Platform Market Industry Insights & Trends
The global Telecom Billing and Revenue Management Platform market is experiencing robust growth, driven by the increasing adoption of digital services, the proliferation of connected devices, and the growing demand for real-time billing solutions. The market size in 2025 is estimated at xx Million, with a projected CAGR of xx% during the forecast period (2025-2033). Technological disruptions, such as the shift towards cloud-based deployments and the integration of Artificial Intelligence (AI) and Machine Learning (ML) for enhanced fraud detection and customer analytics, are reshaping the industry landscape. Evolving consumer behaviors, marked by a preference for personalized and bundled services, necessitate flexible and agile billing solutions. The rising adoption of 5G technology is further accelerating market growth by demanding sophisticated billing systems capable of managing complex data usage patterns. The increasing focus on operational efficiency and cost reduction within telecom operators is also a key market driver.
Key Markets & Segments Leading Telecom Billing and Revenue Management Platform Market
The North American region currently dominates the Telecom Billing and Revenue Management Platform market, driven by robust economic growth, advanced digital infrastructure, and the early adoption of new technologies. However, the Asia-Pacific region is poised for significant growth, fueled by expanding mobile penetration and increasing investment in telecommunications infrastructure.
- By Deployment:
- Cloud: The cloud-based segment is experiencing the fastest growth, driven by scalability, cost-effectiveness, and enhanced agility.
- On-Premise: While on-premise deployments still hold a significant share, their growth is comparatively slower due to the limitations in scalability and flexibility.
- By Type:
- Software: The software segment is a major contributor, driven by the rising demand for customizable and integrated billing solutions.
- Service: The service segment is gaining traction, offering managed services for optimized billing operations.
- By Operator:
- Mobile Operator: Mobile operators form the largest segment due to the high volume of transactions and the complex nature of their billing requirements.
- Internet Service Provider: The Internet Service Provider segment is showing steady growth, driven by increasing broadband subscriptions and the need for advanced billing systems.
Telecom Billing and Revenue Management Platform Market Product Developments
Recent product innovations focus on enhancing automation, improving real-time capabilities, and integrating advanced analytics for better customer experience management and revenue optimization. This includes the development of AI-powered solutions for fraud detection, churn prediction, and personalized pricing strategies. These advancements provide significant competitive advantages, enabling telecom operators to optimize their operations and improve customer satisfaction.
Challenges in the Telecom Billing and Revenue Management Platform Market
The market faces challenges like stringent regulatory compliance requirements, particularly related to data privacy and security, which increase operational complexities and costs. Supply chain disruptions, especially concerning critical hardware components, can impact product availability and timelines. Intense competition among established players and the emergence of new entrants further pose challenges to market growth. These factors collectively impact overall market profitability and expansion.
Forces Driving Telecom Billing and Revenue Management Platform Market Growth
Technological advancements, including AI, ML, and cloud computing, are key growth catalysts. The increasing demand for personalized services and flexible pricing plans from consumers fuels market expansion. Government initiatives promoting digital transformation and investments in telecommunications infrastructure also drive market growth. Furthermore, the rising adoption of 5G technology creates substantial opportunities for sophisticated billing systems.
Long-Term Growth Catalysts in Telecom Billing and Revenue Management Platform Market
Long-term growth is fueled by continuous innovation in billing technologies, strategic partnerships between telecom operators and technology providers, and the expansion into new markets with rising mobile and internet penetration. The ongoing development of 5G and beyond will fuel demand for advanced billing and revenue management platforms capable of handling the increased complexity of these networks.
Emerging Opportunities in Telecom Billing and Revenue Management Platform Market
Emerging opportunities include the integration of blockchain technology for secure and transparent billing, the expansion into the Internet of Things (IoT) market, and the development of tailored solutions for specific vertical industries. The demand for advanced analytics and AI-powered solutions for customer insights and revenue optimization presents further growth avenues.
Leading Players in the Telecom Billing and Revenue Management Platform Market Sector
- Intracom Telecom SA
- Sterlite Technologies Limited
- SAP SE
- CSG Systems International Inc
- Oracle Corporation
- Comarch SA
- Enghouse Networks
- NetCracker Technology Corporation
- Nokia
- Huawei Technologies
- Optiva Inc
- Ericsson
Key Milestones in Telecom Billing and Revenue Management Platform Market Industry
- October 2022: Ericsson partnered with Jio to build India's first 5G stand-alone network, showcasing the demand for advanced billing solutions in next-generation networks.
- March 2023: Spectrum Enterprise partnered with Netcracker Technology, highlighting the growing adoption of Netcracker's revenue management solutions.
Strategic Outlook for Telecom Billing and Revenue Management Platform Market
The Telecom Billing and Revenue Management Platform market is poised for sustained growth, driven by technological advancements, increasing digitalization, and the rising demand for innovative billing solutions. Strategic partnerships, targeted product development, and expansion into emerging markets will be critical for companies to capitalize on the market's significant growth potential. The focus will remain on enhancing customer experience through personalized services and optimized billing processes.
Telecom Billing and Revenue Management Platform Market Segmentation
-
1. Deployment
- 1.1. On-premise
- 1.2. Cloud
-
2. Type
- 2.1. Software
- 2.2. Service
-
3. Operator
- 3.1. Mobile Operator
- 3.2. Internet Service Provider
Telecom Billing and Revenue Management Platform Market Segmentation By Geography
-
1. North America
- 1.1. US
- 1.2. Canada
-
2. Europe
- 2.1. Germany
- 2.2. UK
- 2.3. France
- 2.4. Rest of Europe
-
3. Asia Pacific
- 3.1. India
- 3.2. China
- 3.3. Japan
- 3.4. Rest of Asia Pacific
- 4. Latin America
- 5. Middle East and Africa

Telecom Billing and Revenue Management Platform Market REPORT HIGHLIGHTS
| Aspects | Details |
|---|---|
| Study Period | 2019-2033 |
| Base Year | 2024 |
| Estimated Year | 2025 |
| Forecast Period | 2025-2033 |
| Historical Period | 2019-2024 |
| Growth Rate | CAGR of 9.43% from 2019-2033 |
| Segmentation |
|
Table of Contents
- 1. Introduction
- 1.1. Research Scope
- 1.2. Market Segmentation
- 1.3. Research Methodology
- 1.4. Definitions and Assumptions
- 2. Executive Summary
- 2.1. Introduction
- 3. Market Dynamics
- 3.1. Introduction
- 3.2. Market Drivers
- 3.2.1. Growing Number of Cellular or Mobile Subscribers; Growing Complexities in Revenue Sharing Across the Telecom Ecosystem
- 3.3. Market Restrains
- 3.3.1. Presence of Stringent Telecom Regulations
- 3.4. Market Trends
- 3.4.1. Mobile Operators to Account Major Market Share
- 4. Market Factor Analysis
- 4.1. Porters Five Forces
- 4.2. Supply/Value Chain
- 4.3. PESTEL analysis
- 4.4. Market Entropy
- 4.5. Patent/Trademark Analysis
- 5. Global Telecom Billing and Revenue Management Platform Market Analysis, Insights and Forecast, 2019-2031
- 5.1. Market Analysis, Insights and Forecast - by Deployment
- 5.1.1. On-premise
- 5.1.2. Cloud
- 5.2. Market Analysis, Insights and Forecast - by Type
- 5.2.1. Software
- 5.2.2. Service
- 5.3. Market Analysis, Insights and Forecast - by Operator
- 5.3.1. Mobile Operator
- 5.3.2. Internet Service Provider
- 5.4. Market Analysis, Insights and Forecast - by Region
- 5.4.1. North America
- 5.4.2. Europe
- 5.4.3. Asia Pacific
- 5.4.4. Latin America
- 5.4.5. Middle East and Africa
- 5.1. Market Analysis, Insights and Forecast - by Deployment
- 6. North America Telecom Billing and Revenue Management Platform Market Analysis, Insights and Forecast, 2019-2031
- 6.1. Market Analysis, Insights and Forecast - by Deployment
- 6.1.1. On-premise
- 6.1.2. Cloud
- 6.2. Market Analysis, Insights and Forecast - by Type
- 6.2.1. Software
- 6.2.2. Service
- 6.3. Market Analysis, Insights and Forecast - by Operator
- 6.3.1. Mobile Operator
- 6.3.2. Internet Service Provider
- 6.1. Market Analysis, Insights and Forecast - by Deployment
- 7. Europe Telecom Billing and Revenue Management Platform Market Analysis, Insights and Forecast, 2019-2031
- 7.1. Market Analysis, Insights and Forecast - by Deployment
- 7.1.1. On-premise
- 7.1.2. Cloud
- 7.2. Market Analysis, Insights and Forecast - by Type
- 7.2.1. Software
- 7.2.2. Service
- 7.3. Market Analysis, Insights and Forecast - by Operator
- 7.3.1. Mobile Operator
- 7.3.2. Internet Service Provider
- 7.1. Market Analysis, Insights and Forecast - by Deployment
- 8. Asia Pacific Telecom Billing and Revenue Management Platform Market Analysis, Insights and Forecast, 2019-2031
- 8.1. Market Analysis, Insights and Forecast - by Deployment
- 8.1.1. On-premise
- 8.1.2. Cloud
- 8.2. Market Analysis, Insights and Forecast - by Type
- 8.2.1. Software
- 8.2.2. Service
- 8.3. Market Analysis, Insights and Forecast - by Operator
- 8.3.1. Mobile Operator
- 8.3.2. Internet Service Provider
- 8.1. Market Analysis, Insights and Forecast - by Deployment
- 9. Latin America Telecom Billing and Revenue Management Platform Market Analysis, Insights and Forecast, 2019-2031
- 9.1. Market Analysis, Insights and Forecast - by Deployment
- 9.1.1. On-premise
- 9.1.2. Cloud
- 9.2. Market Analysis, Insights and Forecast - by Type
- 9.2.1. Software
- 9.2.2. Service
- 9.3. Market Analysis, Insights and Forecast - by Operator
- 9.3.1. Mobile Operator
- 9.3.2. Internet Service Provider
- 9.1. Market Analysis, Insights and Forecast - by Deployment
- 10. Middle East and Africa Telecom Billing and Revenue Management Platform Market Analysis, Insights and Forecast, 2019-2031
- 10.1. Market Analysis, Insights and Forecast - by Deployment
- 10.1.1. On-premise
- 10.1.2. Cloud
- 10.2. Market Analysis, Insights and Forecast - by Type
- 10.2.1. Software
- 10.2.2. Service
- 10.3. Market Analysis, Insights and Forecast - by Operator
- 10.3.1. Mobile Operator
- 10.3.2. Internet Service Provider
- 10.1. Market Analysis, Insights and Forecast - by Deployment
- 11. North America Telecom Billing and Revenue Management Platform Market Analysis, Insights and Forecast, 2019-2031
- 11.1. Market Analysis, Insights and Forecast - By Country/Sub-region
- 11.1.1 US
- 11.1.2 Canada
- 12. Europe Telecom Billing and Revenue Management Platform Market Analysis, Insights and Forecast, 2019-2031
- 12.1. Market Analysis, Insights and Forecast - By Country/Sub-region
- 12.1.1 Germany
- 12.1.2 UK
- 12.1.3 France
- 12.1.4 Rest of Europe
- 13. Asia Pacific Telecom Billing and Revenue Management Platform Market Analysis, Insights and Forecast, 2019-2031
- 13.1. Market Analysis, Insights and Forecast - By Country/Sub-region
- 13.1.1 India
- 13.1.2 China
- 13.1.3 Japan
- 13.1.4 Rest of Asia Pacific
- 14. Latin America Telecom Billing and Revenue Management Platform Market Analysis, Insights and Forecast, 2019-2031
- 14.1. Market Analysis, Insights and Forecast - By Country/Sub-region
- 14.1.1.
- 15. Middle East and Africa Telecom Billing and Revenue Management Platform Market Analysis, Insights and Forecast, 2019-2031
- 15.1. Market Analysis, Insights and Forecast - By Country/Sub-region
- 15.1.1.
- 16. Competitive Analysis
- 16.1. Global Market Share Analysis 2024
- 16.2. Company Profiles
- 16.2.1 Intracom Telecom SA*List Not Exhaustive
- 16.2.1.1. Overview
- 16.2.1.2. Products
- 16.2.1.3. SWOT Analysis
- 16.2.1.4. Recent Developments
- 16.2.1.5. Financials (Based on Availability)
- 16.2.2 Sterlite Technologies Limited
- 16.2.2.1. Overview
- 16.2.2.2. Products
- 16.2.2.3. SWOT Analysis
- 16.2.2.4. Recent Developments
- 16.2.2.5. Financials (Based on Availability)
- 16.2.3 SAP Se
- 16.2.3.1. Overview
- 16.2.3.2. Products
- 16.2.3.3. SWOT Analysis
- 16.2.3.4. Recent Developments
- 16.2.3.5. Financials (Based on Availability)
- 16.2.4 CSG Systems International Inc
- 16.2.4.1. Overview
- 16.2.4.2. Products
- 16.2.4.3. SWOT Analysis
- 16.2.4.4. Recent Developments
- 16.2.4.5. Financials (Based on Availability)
- 16.2.5 Oracle Corporation
- 16.2.5.1. Overview
- 16.2.5.2. Products
- 16.2.5.3. SWOT Analysis
- 16.2.5.4. Recent Developments
- 16.2.5.5. Financials (Based on Availability)
- 16.2.6 Comarch SA
- 16.2.6.1. Overview
- 16.2.6.2. Products
- 16.2.6.3. SWOT Analysis
- 16.2.6.4. Recent Developments
- 16.2.6.5. Financials (Based on Availability)
- 16.2.7 Enghouse Networks
- 16.2.7.1. Overview
- 16.2.7.2. Products
- 16.2.7.3. SWOT Analysis
- 16.2.7.4. Recent Developments
- 16.2.7.5. Financials (Based on Availability)
- 16.2.8 NetCracker Technology Corporation
- 16.2.8.1. Overview
- 16.2.8.2. Products
- 16.2.8.3. SWOT Analysis
- 16.2.8.4. Recent Developments
- 16.2.8.5. Financials (Based on Availability)
- 16.2.9 Nokia
- 16.2.9.1. Overview
- 16.2.9.2. Products
- 16.2.9.3. SWOT Analysis
- 16.2.9.4. Recent Developments
- 16.2.9.5. Financials (Based on Availability)
- 16.2.10 Huawei Technologies
- 16.2.10.1. Overview
- 16.2.10.2. Products
- 16.2.10.3. SWOT Analysis
- 16.2.10.4. Recent Developments
- 16.2.10.5. Financials (Based on Availability)
- 16.2.11 Optiva Inc
- 16.2.11.1. Overview
- 16.2.11.2. Products
- 16.2.11.3. SWOT Analysis
- 16.2.11.4. Recent Developments
- 16.2.11.5. Financials (Based on Availability)
- 16.2.12 Ericsson
- 16.2.12.1. Overview
- 16.2.12.2. Products
- 16.2.12.3. SWOT Analysis
- 16.2.12.4. Recent Developments
- 16.2.12.5. Financials (Based on Availability)
- 16.2.1 Intracom Telecom SA*List Not Exhaustive
List of Figures
- Figure 1: Global Telecom Billing and Revenue Management Platform Market Revenue Breakdown (Million, %) by Region 2024 & 2032
- Figure 2: North America Telecom Billing and Revenue Management Platform Market Revenue (Million), by Country 2024 & 2032
- Figure 3: North America Telecom Billing and Revenue Management Platform Market Revenue Share (%), by Country 2024 & 2032
- Figure 4: Europe Telecom Billing and Revenue Management Platform Market Revenue (Million), by Country 2024 & 2032
- Figure 5: Europe Telecom Billing and Revenue Management Platform Market Revenue Share (%), by Country 2024 & 2032
- Figure 6: Asia Pacific Telecom Billing and Revenue Management Platform Market Revenue (Million), by Country 2024 & 2032
- Figure 7: Asia Pacific Telecom Billing and Revenue Management Platform Market Revenue Share (%), by Country 2024 & 2032
- Figure 8: Latin America Telecom Billing and Revenue Management Platform Market Revenue (Million), by Country 2024 & 2032
- Figure 9: Latin America Telecom Billing and Revenue Management Platform Market Revenue Share (%), by Country 2024 & 2032
- Figure 10: Middle East and Africa Telecom Billing and Revenue Management Platform Market Revenue (Million), by Country 2024 & 2032
- Figure 11: Middle East and Africa Telecom Billing and Revenue Management Platform Market Revenue Share (%), by Country 2024 & 2032
- Figure 12: North America Telecom Billing and Revenue Management Platform Market Revenue (Million), by Deployment 2024 & 2032
- Figure 13: North America Telecom Billing and Revenue Management Platform Market Revenue Share (%), by Deployment 2024 & 2032
- Figure 14: North America Telecom Billing and Revenue Management Platform Market Revenue (Million), by Type 2024 & 2032
- Figure 15: North America Telecom Billing and Revenue Management Platform Market Revenue Share (%), by Type 2024 & 2032
- Figure 16: North America Telecom Billing and Revenue Management Platform Market Revenue (Million), by Operator 2024 & 2032
- Figure 17: North America Telecom Billing and Revenue Management Platform Market Revenue Share (%), by Operator 2024 & 2032
- Figure 18: North America Telecom Billing and Revenue Management Platform Market Revenue (Million), by Country 2024 & 2032
- Figure 19: North America Telecom Billing and Revenue Management Platform Market Revenue Share (%), by Country 2024 & 2032
- Figure 20: Europe Telecom Billing and Revenue Management Platform Market Revenue (Million), by Deployment 2024 & 2032
- Figure 21: Europe Telecom Billing and Revenue Management Platform Market Revenue Share (%), by Deployment 2024 & 2032
- Figure 22: Europe Telecom Billing and Revenue Management Platform Market Revenue (Million), by Type 2024 & 2032
- Figure 23: Europe Telecom Billing and Revenue Management Platform Market Revenue Share (%), by Type 2024 & 2032
- Figure 24: Europe Telecom Billing and Revenue Management Platform Market Revenue (Million), by Operator 2024 & 2032
- Figure 25: Europe Telecom Billing and Revenue Management Platform Market Revenue Share (%), by Operator 2024 & 2032
- Figure 26: Europe Telecom Billing and Revenue Management Platform Market Revenue (Million), by Country 2024 & 2032
- Figure 27: Europe Telecom Billing and Revenue Management Platform Market Revenue Share (%), by Country 2024 & 2032
- Figure 28: Asia Pacific Telecom Billing and Revenue Management Platform Market Revenue (Million), by Deployment 2024 & 2032
- Figure 29: Asia Pacific Telecom Billing and Revenue Management Platform Market Revenue Share (%), by Deployment 2024 & 2032
- Figure 30: Asia Pacific Telecom Billing and Revenue Management Platform Market Revenue (Million), by Type 2024 & 2032
- Figure 31: Asia Pacific Telecom Billing and Revenue Management Platform Market Revenue Share (%), by Type 2024 & 2032
- Figure 32: Asia Pacific Telecom Billing and Revenue Management Platform Market Revenue (Million), by Operator 2024 & 2032
- Figure 33: Asia Pacific Telecom Billing and Revenue Management Platform Market Revenue Share (%), by Operator 2024 & 2032
- Figure 34: Asia Pacific Telecom Billing and Revenue Management Platform Market Revenue (Million), by Country 2024 & 2032
- Figure 35: Asia Pacific Telecom Billing and Revenue Management Platform Market Revenue Share (%), by Country 2024 & 2032
- Figure 36: Latin America Telecom Billing and Revenue Management Platform Market Revenue (Million), by Deployment 2024 & 2032
- Figure 37: Latin America Telecom Billing and Revenue Management Platform Market Revenue Share (%), by Deployment 2024 & 2032
- Figure 38: Latin America Telecom Billing and Revenue Management Platform Market Revenue (Million), by Type 2024 & 2032
- Figure 39: Latin America Telecom Billing and Revenue Management Platform Market Revenue Share (%), by Type 2024 & 2032
- Figure 40: Latin America Telecom Billing and Revenue Management Platform Market Revenue (Million), by Operator 2024 & 2032
- Figure 41: Latin America Telecom Billing and Revenue Management Platform Market Revenue Share (%), by Operator 2024 & 2032
- Figure 42: Latin America Telecom Billing and Revenue Management Platform Market Revenue (Million), by Country 2024 & 2032
- Figure 43: Latin America Telecom Billing and Revenue Management Platform Market Revenue Share (%), by Country 2024 & 2032
- Figure 44: Middle East and Africa Telecom Billing and Revenue Management Platform Market Revenue (Million), by Deployment 2024 & 2032
- Figure 45: Middle East and Africa Telecom Billing and Revenue Management Platform Market Revenue Share (%), by Deployment 2024 & 2032
- Figure 46: Middle East and Africa Telecom Billing and Revenue Management Platform Market Revenue (Million), by Type 2024 & 2032
- Figure 47: Middle East and Africa Telecom Billing and Revenue Management Platform Market Revenue Share (%), by Type 2024 & 2032
- Figure 48: Middle East and Africa Telecom Billing and Revenue Management Platform Market Revenue (Million), by Operator 2024 & 2032
- Figure 49: Middle East and Africa Telecom Billing and Revenue Management Platform Market Revenue Share (%), by Operator 2024 & 2032
- Figure 50: Middle East and Africa Telecom Billing and Revenue Management Platform Market Revenue (Million), by Country 2024 & 2032
- Figure 51: Middle East and Africa Telecom Billing and Revenue Management Platform Market Revenue Share (%), by Country 2024 & 2032
List of Tables
- Table 1: Global Telecom Billing and Revenue Management Platform Market Revenue Million Forecast, by Region 2019 & 2032
- Table 2: Global Telecom Billing and Revenue Management Platform Market Revenue Million Forecast, by Deployment 2019 & 2032
- Table 3: Global Telecom Billing and Revenue Management Platform Market Revenue Million Forecast, by Type 2019 & 2032
- Table 4: Global Telecom Billing and Revenue Management Platform Market Revenue Million Forecast, by Operator 2019 & 2032
- Table 5: Global Telecom Billing and Revenue Management Platform Market Revenue Million Forecast, by Region 2019 & 2032
- Table 6: Global Telecom Billing and Revenue Management Platform Market Revenue Million Forecast, by Country 2019 & 2032
- Table 7: US Telecom Billing and Revenue Management Platform Market Revenue (Million) Forecast, by Application 2019 & 2032
- Table 8: Canada Telecom Billing and Revenue Management Platform Market Revenue (Million) Forecast, by Application 2019 & 2032
- Table 9: Global Telecom Billing and Revenue Management Platform Market Revenue Million Forecast, by Country 2019 & 2032
- Table 10: Germany Telecom Billing and Revenue Management Platform Market Revenue (Million) Forecast, by Application 2019 & 2032
- Table 11: UK Telecom Billing and Revenue Management Platform Market Revenue (Million) Forecast, by Application 2019 & 2032
- Table 12: France Telecom Billing and Revenue Management Platform Market Revenue (Million) Forecast, by Application 2019 & 2032
- Table 13: Rest of Europe Telecom Billing and Revenue Management Platform Market Revenue (Million) Forecast, by Application 2019 & 2032
- Table 14: Global Telecom Billing and Revenue Management Platform Market Revenue Million Forecast, by Country 2019 & 2032
- Table 15: India Telecom Billing and Revenue Management Platform Market Revenue (Million) Forecast, by Application 2019 & 2032
- Table 16: China Telecom Billing and Revenue Management Platform Market Revenue (Million) Forecast, by Application 2019 & 2032
- Table 17: Japan Telecom Billing and Revenue Management Platform Market Revenue (Million) Forecast, by Application 2019 & 2032
- Table 18: Rest of Asia Pacific Telecom Billing and Revenue Management Platform Market Revenue (Million) Forecast, by Application 2019 & 2032
- Table 19: Global Telecom Billing and Revenue Management Platform Market Revenue Million Forecast, by Country 2019 & 2032
- Table 20: Telecom Billing and Revenue Management Platform Market Revenue (Million) Forecast, by Application 2019 & 2032
- Table 21: Global Telecom Billing and Revenue Management Platform Market Revenue Million Forecast, by Country 2019 & 2032
- Table 22: Telecom Billing and Revenue Management Platform Market Revenue (Million) Forecast, by Application 2019 & 2032
- Table 23: Global Telecom Billing and Revenue Management Platform Market Revenue Million Forecast, by Deployment 2019 & 2032
- Table 24: Global Telecom Billing and Revenue Management Platform Market Revenue Million Forecast, by Type 2019 & 2032
- Table 25: Global Telecom Billing and Revenue Management Platform Market Revenue Million Forecast, by Operator 2019 & 2032
- Table 26: Global Telecom Billing and Revenue Management Platform Market Revenue Million Forecast, by Country 2019 & 2032
- Table 27: US Telecom Billing and Revenue Management Platform Market Revenue (Million) Forecast, by Application 2019 & 2032
- Table 28: Canada Telecom Billing and Revenue Management Platform Market Revenue (Million) Forecast, by Application 2019 & 2032
- Table 29: Global Telecom Billing and Revenue Management Platform Market Revenue Million Forecast, by Deployment 2019 & 2032
- Table 30: Global Telecom Billing and Revenue Management Platform Market Revenue Million Forecast, by Type 2019 & 2032
- Table 31: Global Telecom Billing and Revenue Management Platform Market Revenue Million Forecast, by Operator 2019 & 2032
- Table 32: Global Telecom Billing and Revenue Management Platform Market Revenue Million Forecast, by Country 2019 & 2032
- Table 33: Germany Telecom Billing and Revenue Management Platform Market Revenue (Million) Forecast, by Application 2019 & 2032
- Table 34: UK Telecom Billing and Revenue Management Platform Market Revenue (Million) Forecast, by Application 2019 & 2032
- Table 35: France Telecom Billing and Revenue Management Platform Market Revenue (Million) Forecast, by Application 2019 & 2032
- Table 36: Rest of Europe Telecom Billing and Revenue Management Platform Market Revenue (Million) Forecast, by Application 2019 & 2032
- Table 37: Global Telecom Billing and Revenue Management Platform Market Revenue Million Forecast, by Deployment 2019 & 2032
- Table 38: Global Telecom Billing and Revenue Management Platform Market Revenue Million Forecast, by Type 2019 & 2032
- Table 39: Global Telecom Billing and Revenue Management Platform Market Revenue Million Forecast, by Operator 2019 & 2032
- Table 40: Global Telecom Billing and Revenue Management Platform Market Revenue Million Forecast, by Country 2019 & 2032
- Table 41: India Telecom Billing and Revenue Management Platform Market Revenue (Million) Forecast, by Application 2019 & 2032
- Table 42: China Telecom Billing and Revenue Management Platform Market Revenue (Million) Forecast, by Application 2019 & 2032
- Table 43: Japan Telecom Billing and Revenue Management Platform Market Revenue (Million) Forecast, by Application 2019 & 2032
- Table 44: Rest of Asia Pacific Telecom Billing and Revenue Management Platform Market Revenue (Million) Forecast, by Application 2019 & 2032
- Table 45: Global Telecom Billing and Revenue Management Platform Market Revenue Million Forecast, by Deployment 2019 & 2032
- Table 46: Global Telecom Billing and Revenue Management Platform Market Revenue Million Forecast, by Type 2019 & 2032
- Table 47: Global Telecom Billing and Revenue Management Platform Market Revenue Million Forecast, by Operator 2019 & 2032
- Table 48: Global Telecom Billing and Revenue Management Platform Market Revenue Million Forecast, by Country 2019 & 2032
- Table 49: Global Telecom Billing and Revenue Management Platform Market Revenue Million Forecast, by Deployment 2019 & 2032
- Table 50: Global Telecom Billing and Revenue Management Platform Market Revenue Million Forecast, by Type 2019 & 2032
- Table 51: Global Telecom Billing and Revenue Management Platform Market Revenue Million Forecast, by Operator 2019 & 2032
- Table 52: Global Telecom Billing and Revenue Management Platform Market Revenue Million Forecast, by Country 2019 & 2032
Frequently Asked Questions
1. What is the projected Compound Annual Growth Rate (CAGR) of the Telecom Billing and Revenue Management Platform Market?
The projected CAGR is approximately 9.43%.
2. Which companies are prominent players in the Telecom Billing and Revenue Management Platform Market?
Key companies in the market include Intracom Telecom SA*List Not Exhaustive, Sterlite Technologies Limited, SAP Se, CSG Systems International Inc, Oracle Corporation, Comarch SA, Enghouse Networks, NetCracker Technology Corporation, Nokia, Huawei Technologies, Optiva Inc, Ericsson.
3. What are the main segments of the Telecom Billing and Revenue Management Platform Market?
The market segments include Deployment, Type, Operator.
4. Can you provide details about the market size?
The market size is estimated to be USD 14.21 Million as of 2022.
5. What are some drivers contributing to market growth?
Growing Number of Cellular or Mobile Subscribers; Growing Complexities in Revenue Sharing Across the Telecom Ecosystem.
6. What are the notable trends driving market growth?
Mobile Operators to Account Major Market Share.
7. Are there any restraints impacting market growth?
Presence of Stringent Telecom Regulations.
8. Can you provide examples of recent developments in the market?
March 2023 - A national supplier of scalable fiber technology solutions, Spectrum Enterprise, a division of Charter Communications, and Netcracker Technology revealed an expanded partnership. Spectrum Enterprise selected Netcracker Revenue Management as its solution and will serve customers from a single billing platform.
9. What pricing options are available for accessing the report?
Pricing options include single-user, multi-user, and enterprise licenses priced at USD 4750, USD 5250, and USD 8750 respectively.
10. Is the market size provided in terms of value or volume?
The market size is provided in terms of value, measured in Million.
11. Are there any specific market keywords associated with the report?
Yes, the market keyword associated with the report is "Telecom Billing and Revenue Management Platform Market," which aids in identifying and referencing the specific market segment covered.
12. How do I determine which pricing option suits my needs best?
The pricing options vary based on user requirements and access needs. Individual users may opt for single-user licenses, while businesses requiring broader access may choose multi-user or enterprise licenses for cost-effective access to the report.
13. Are there any additional resources or data provided in the Telecom Billing and Revenue Management Platform Market report?
While the report offers comprehensive insights, it's advisable to review the specific contents or supplementary materials provided to ascertain if additional resources or data are available.
14. How can I stay updated on further developments or reports in the Telecom Billing and Revenue Management Platform Market?
To stay informed about further developments, trends, and reports in the Telecom Billing and Revenue Management Platform Market, consider subscribing to industry newsletters, following relevant companies and organizations, or regularly checking reputable industry news sources and publications.
Methodology
Step 1 - Identification of Relevant Samples Size from Population Database


Step 2 - Approaches for Defining Global Market Size (Value, Volume* & Price*)

Note*: In applicable scenarios
Step 3 - Data Sources
Primary Research
- Web Analytics
- Survey Reports
- Research Institute
- Latest Research Reports
- Opinion Leaders
Secondary Research
- Annual Reports
- White Paper
- Latest Press Release
- Industry Association
- Paid Database
- Investor Presentations

Step 4 - Data Triangulation
Involves using different sources of information in order to increase the validity of a study
These sources are likely to be stakeholders in a program - participants, other researchers, program staff, other community members, and so on.
Then we put all data in single framework & apply various statistical tools to find out the dynamic on the market.
During the analysis stage, feedback from the stakeholder groups would be compared to determine areas of agreement as well as areas of divergence
