

Key Insights
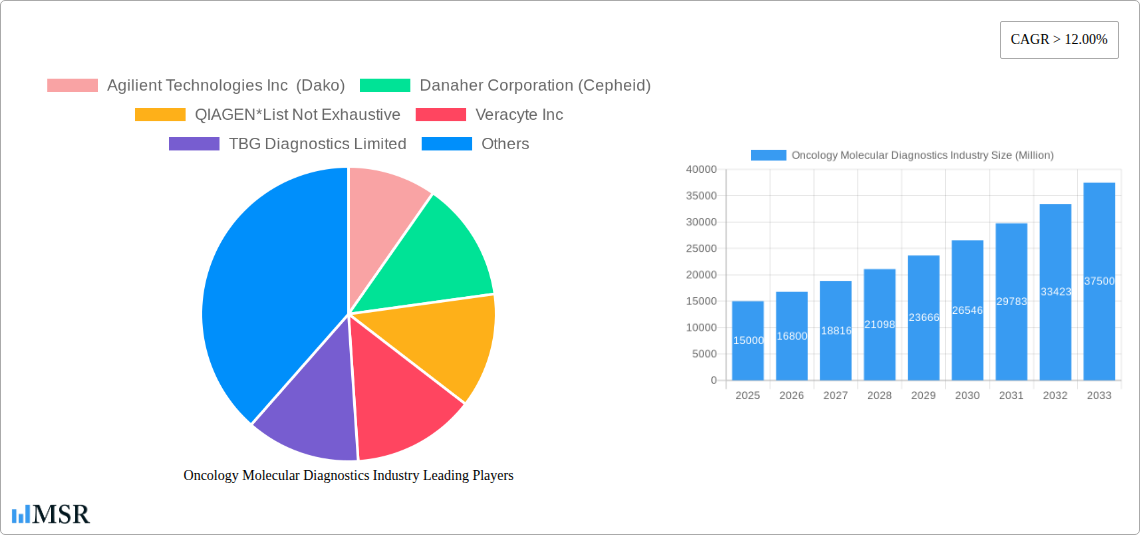
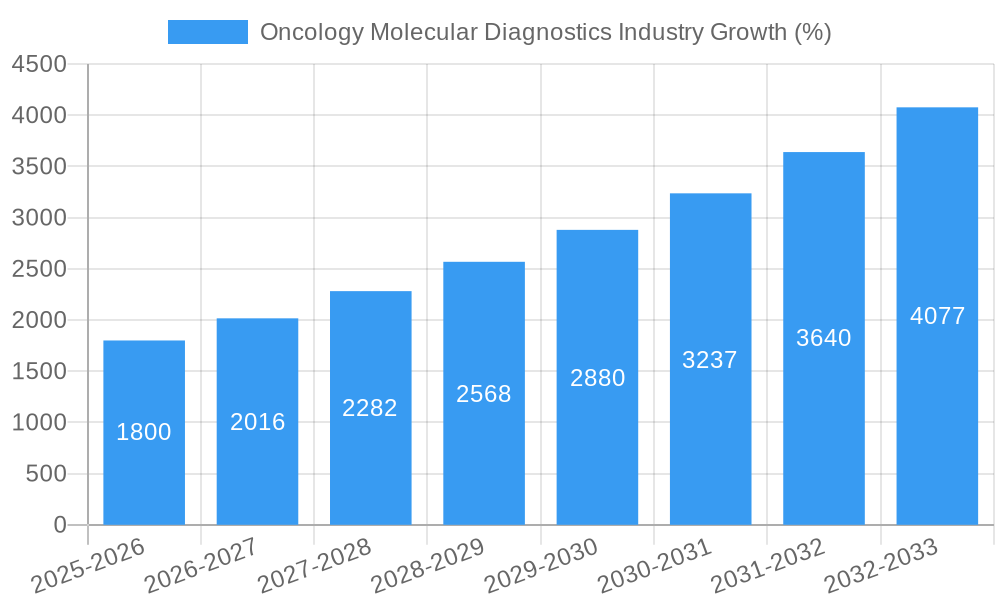
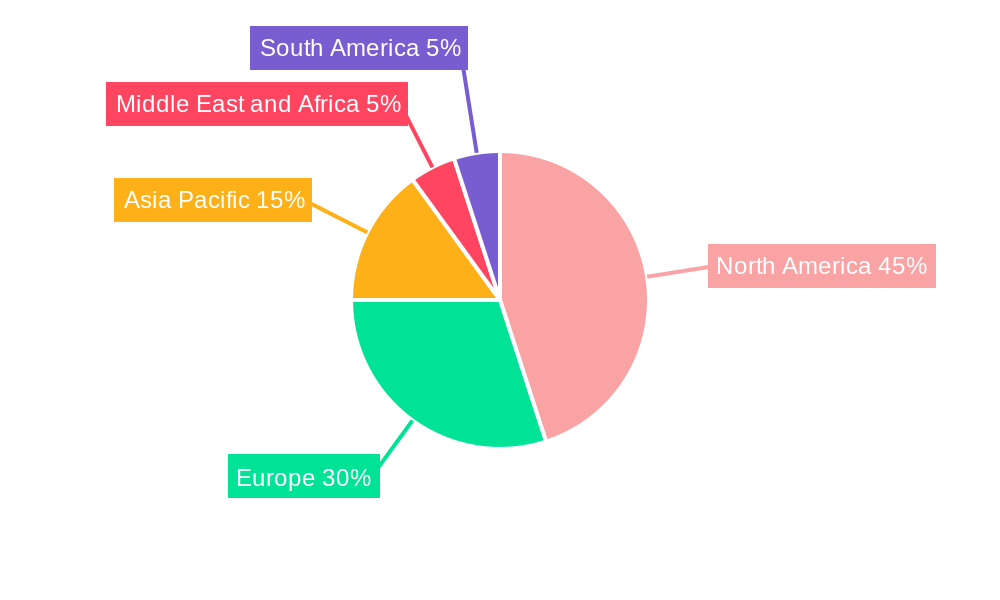
The oncology molecular diagnostics market is experiencing robust growth, driven by the increasing prevalence of cancer globally, advancements in molecular diagnostic technologies, and the rising demand for personalized medicine. The market's Compound Annual Growth Rate (CAGR) exceeding 12% signifies significant expansion opportunities over the forecast period (2025-2033). Key drivers include the development of more sensitive and specific diagnostic tests enabling earlier cancer detection, improved treatment selection, and enhanced disease monitoring. Technological advancements like next-generation sequencing (NGS) and polymerase chain reaction (PCR) are revolutionizing cancer diagnostics, leading to faster and more accurate results. The market is segmented by application type (breast, prostate, colorectal, lung, blood, liver, cervical cancers, and others), end-user (hospitals, diagnostic centers, and others), product type (instruments, reagents, and others), and technology type (PCR, INAAT, DNA sequencing, in-situ hybridization, mass spectrometry, TMA, chips & microarrays, and others). The increasing adoption of targeted therapies and personalized medicine further fuels market growth, as these treatments require precise molecular diagnostics to identify suitable candidates. While regulatory hurdles and high costs associated with advanced technologies pose some restraints, the overall market outlook remains strongly positive. Geographic regions like North America and Europe currently hold substantial market shares due to advanced healthcare infrastructure and high healthcare spending, but Asia-Pacific is expected to witness significant growth driven by rising cancer incidence and improving healthcare facilities.
The competitive landscape is marked by both established players like Agilent Technologies, Danaher Corporation, QIAGEN, Thermo Fisher Scientific, and Roche, and emerging companies specializing in innovative diagnostic technologies. These companies are constantly striving to develop more efficient and cost-effective diagnostic tools, fostering competition and driving innovation within the market. Strategic partnerships, mergers, and acquisitions are also common strategies employed to expand market reach and technological capabilities. Future growth will likely be influenced by the continued development and adoption of liquid biopsies, which allow for minimally invasive cancer detection and monitoring. Furthermore, advancements in artificial intelligence and machine learning are expected to further enhance the accuracy and efficiency of molecular diagnostic tests. The ongoing efforts to improve healthcare accessibility and affordability, especially in developing economies, will also play a crucial role in shaping future market dynamics.
Oncology Molecular Diagnostics Market Report: 2019-2033
This comprehensive report provides an in-depth analysis of the Oncology Molecular Diagnostics industry, offering actionable insights for stakeholders across the value chain. With a study period spanning 2019-2033, a base year of 2025, and a forecast period of 2025-2033, this report leverages extensive data analysis to project market trends and growth opportunities. The global market size in 2025 is estimated at $xx Million.
Oncology Molecular Diagnostics Industry Market Concentration & Dynamics
The Oncology Molecular Diagnostics market is characterized by a moderately concentrated landscape, with key players like Agilent Technologies Inc (Dako), Danaher Corporation (Cepheid), QIAGEN, Veracyte Inc, and Thermo Fisher Scientific Inc holding significant market share. The market exhibits a dynamic interplay of factors, including ongoing innovation in diagnostic technologies, stringent regulatory frameworks (e.g., FDA approvals), the emergence of substitute products (e.g., advanced imaging techniques), and evolving end-user preferences towards personalized medicine.
Market concentration is further influenced by mergers and acquisitions (M&A) activities. The historical period (2019-2024) witnessed approximately xx M&A deals, with a projected increase to xx deals during the forecast period (2025-2033). This consolidation trend reflects the industry's drive towards expanding product portfolios and gaining a competitive edge. Market share data reveals that the top 5 players collectively account for approximately xx% of the market in 2025, indicating a moderate level of concentration.
Oncology Molecular Diagnostics Industry Insights & Trends
The Oncology Molecular Diagnostics market is experiencing robust growth, driven primarily by the increasing prevalence of cancer globally, advancements in molecular diagnostic technologies, and a rising demand for early and accurate cancer diagnosis and treatment personalization. The market size is projected to reach $xx Million by 2033, exhibiting a CAGR of xx% during the forecast period. Technological disruptions, such as the adoption of next-generation sequencing (NGS) and liquid biopsies, are revolutionizing cancer diagnostics, enabling earlier detection and more targeted therapies. Evolving consumer behaviors, emphasizing proactive health management and personalized care, further contribute to market expansion.
Key Markets & Segments Leading Oncology Molecular Diagnostics Industry
The North American region is currently the dominant market for Oncology Molecular Diagnostics, driven by factors such as robust healthcare infrastructure, high adoption rates of advanced technologies, and favorable regulatory environments. However, other regions, particularly Asia-Pacific, are expected to show significant growth in the coming years.
Leading Segments:
- By Application Type: Breast cancer, lung cancer, and colorectal cancer currently represent the largest segments, reflecting their high prevalence. However, blood cancer and other application types are poised for significant growth owing to technological advancements and increased awareness.
- By End User: Hospitals and diagnostic centers are major end users, accounting for the bulk of the market share. However, the "Other End Users" segment, encompassing research institutions and private laboratories, is also showing substantial growth.
- By Product Type: Reagents constitute the largest segment in terms of market value due to their high consumption in various diagnostic procedures.
- By Technology Type: Polymerase Chain Reaction (PCR) remains the dominant technology; however, NGS is rapidly gaining traction, owing to its capability for high-throughput analysis and comprehensive genomic profiling.
Growth Drivers:
- Increasing prevalence of cancer worldwide.
- Rising healthcare expenditure and insurance coverage.
- Advancements in molecular diagnostic technologies (NGS, liquid biopsies).
- Growing demand for personalized medicine.
- Favorable government initiatives and regulatory support.
Oncology Molecular Diagnostics Industry Product Developments
Recent product innovations focus on improving the accuracy, speed, and cost-effectiveness of cancer diagnostics. Miniaturized devices, automated platforms, and advanced software for data analysis represent key advancements. These developments are enhancing the diagnostic capabilities and improving the competitive landscape, particularly for next-generation sequencing (NGS) based tests offering comprehensive genomic profiling. This allows for more precise treatment strategies and better patient outcomes.
Challenges in the Oncology Molecular Diagnostics Industry Market
The industry faces challenges such as stringent regulatory approvals, particularly for novel diagnostic technologies. Supply chain disruptions, particularly concerning reagents and consumables, can affect market stability. Furthermore, intense competition among established players and emerging companies creates pricing pressures. These factors collectively impact market growth and profitability.
Forces Driving Oncology Molecular Diagnostics Industry Growth
Key growth drivers include technological advancements leading to more accurate and affordable diagnostic tests, increasing cancer prevalence globally, rising demand for personalized oncology, and supportive government policies promoting early detection and advanced treatment strategies. These factors collectively drive market expansion.
Long-Term Growth Catalysts in the Oncology Molecular Diagnostics Industry
Long-term growth will be fueled by ongoing innovation in areas like liquid biopsies, single-cell analysis, and artificial intelligence-driven diagnostics. Strategic partnerships between diagnostic companies and pharmaceutical firms will facilitate the development of companion diagnostics and accelerate market penetration. Expansion into emerging markets with growing healthcare infrastructure and increasing cancer prevalence will further propel market growth.
Emerging Opportunities in Oncology Molecular Diagnostics Industry
Emerging opportunities include the development of point-of-care diagnostics, enabling rapid testing in remote areas and improving patient access. The integration of artificial intelligence (AI) and machine learning (ML) into diagnostic platforms offers potential for improved diagnostic accuracy and efficiency. The increasing demand for early detection and personalized medicine, coupled with technological innovation, presents significant growth prospects.
Leading Players in the Oncology Molecular Diagnostics Industry Sector
- Agilent Technologies Inc (Dako)
- Danaher Corporation (Cepheid)
- QIAGEN
- Veracyte Inc
- TBG Diagnostics Limited
- HTG Molecular Diagnostics Inc
- Thermo Fisher Scientific Inc
- Abbott Laboratories
- F Hoffmann La-Roche Ltd
- bioMérieux SA
- Illumina Inc
- Sysmex Corporation (Sysmex Europe GmbH)
Key Milestones in Oncology Molecular Diagnostics Industry Industry
- 2020: FDA approval of a novel liquid biopsy test for early cancer detection.
- 2021: Launch of a high-throughput NGS platform by a major player.
- 2022: A significant merger between two leading companies in the molecular diagnostics field.
- 2023: Introduction of AI-powered diagnostic software improving diagnostic accuracy.
- 2024: Expansion of a major player into a new emerging market.
Strategic Outlook for Oncology Molecular Diagnostics Industry Market
The future of the Oncology Molecular Diagnostics market is bright, driven by continuous technological advancements, the growing need for early and precise cancer diagnosis, and the rising adoption of personalized medicine. Strategic partnerships, acquisitions, and expansion into new markets will be crucial for sustained growth. Companies focusing on innovation, particularly in liquid biopsies and AI-powered diagnostics, are well-positioned to capture significant market share in the years to come.
Oncology Molecular Diagnostics Industry Segmentation
-
1. Product Type
- 1.1. Instrument
- 1.2. Reagents
- 1.3. Other Product Types
-
2. Technology Type
- 2.1. Polymerase Chain Reaction (PCR)
- 2.2. Isotherm
- 2.3. DNA Sequencing and Next-Generation Sequencing
- 2.4. In-situ Hybridization
- 2.5. Mass Spectrometry
- 2.6. Transcription Mediated Amplification (TMA)
- 2.7. Chips and Microarrays
- 2.8. Other Technology Types
-
3. Application Type
- 3.1. Breast Cancer
- 3.2. Prostate Cancer
- 3.3. Colorectal Cancer
- 3.4. Lung Cancer
- 3.5. Blood Cancer
- 3.6. Liver Cancer
- 3.7. Cervical Cancer
- 3.8. Other Application Types
-
4. End User
- 4.1. Hospitals
- 4.2. Diagnostic Centers
- 4.3. Other End Users
Oncology Molecular Diagnostics Industry Segmentation By Geography
-
1. North America
- 1.1. United States
- 1.2. Canada
- 1.3. Mexico
-
2. Europe
- 2.1. Germany
- 2.2. United Kingdom
- 2.3. France
- 2.4. Italy
- 2.5. Spain
- 2.6. Rest of Europe
-
3. Asia Pacific
- 3.1. China
- 3.2. Japan
- 3.3. India
- 3.4. Australia
- 3.5. South Korea
- 3.6. Rest of Asia Pacific
-
4. Middle East and Africa
- 4.1. GCC
- 4.2. South Africa
- 4.3. Rest of Middle East and Africa
-
5. South America
- 5.1. Brazil
- 5.2. Argentina
- 5.3. Rest of South America
Oncology Molecular Diagnostics Industry REPORT HIGHLIGHTS
| Aspects | Details |
|---|---|
| Study Period | 2019-2033 |
| Base Year | 2024 |
| Estimated Year | 2025 |
| Forecast Period | 2025-2033 |
| Historical Period | 2019-2024 |
| Growth Rate | CAGR of > 12.00% from 2019-2033 |
| Segmentation |
|
Table of Contents
- 1. Introduction
- 1.1. Research Scope
- 1.2. Market Segmentation
- 1.3. Research Methodology
- 1.4. Definitions and Assumptions
- 2. Executive Summary
- 2.1. Introduction
- 3. Market Dynamics
- 3.1. Introduction
- 3.2. Market Drivers
- 3.2.1. Rising Prevalence of Cancer Worldwide; Technological Advancements in Diagnostic Testing; Increasing Demand for Point-of-care Treatment
- 3.3. Market Restrains
- 3.3.1. High Cost of Molecular Diagnostic Tests; Lack of Skilled Workforce and Stringent Regulatory Framework
- 3.4. Market Trends
- 3.4.1. Polymerase Chain Reaction (PCR) is Anticipated to Observe a Significant Growth
- 4. Market Factor Analysis
- 4.1. Porters Five Forces
- 4.2. Supply/Value Chain
- 4.3. PESTEL analysis
- 4.4. Market Entropy
- 4.5. Patent/Trademark Analysis
- 5. Global Oncology Molecular Diagnostics Industry Analysis, Insights and Forecast, 2019-2031
- 5.1. Market Analysis, Insights and Forecast - by Product Type
- 5.1.1. Instrument
- 5.1.2. Reagents
- 5.1.3. Other Product Types
- 5.2. Market Analysis, Insights and Forecast - by Technology Type
- 5.2.1. Polymerase Chain Reaction (PCR)
- 5.2.2. Isotherm
- 5.2.3. DNA Sequencing and Next-Generation Sequencing
- 5.2.4. In-situ Hybridization
- 5.2.5. Mass Spectrometry
- 5.2.6. Transcription Mediated Amplification (TMA)
- 5.2.7. Chips and Microarrays
- 5.2.8. Other Technology Types
- 5.3. Market Analysis, Insights and Forecast - by Application Type
- 5.3.1. Breast Cancer
- 5.3.2. Prostate Cancer
- 5.3.3. Colorectal Cancer
- 5.3.4. Lung Cancer
- 5.3.5. Blood Cancer
- 5.3.6. Liver Cancer
- 5.3.7. Cervical Cancer
- 5.3.8. Other Application Types
- 5.4. Market Analysis, Insights and Forecast - by End User
- 5.4.1. Hospitals
- 5.4.2. Diagnostic Centers
- 5.4.3. Other End Users
- 5.5. Market Analysis, Insights and Forecast - by Region
- 5.5.1. North America
- 5.5.2. Europe
- 5.5.3. Asia Pacific
- 5.5.4. Middle East and Africa
- 5.5.5. South America
- 5.1. Market Analysis, Insights and Forecast - by Product Type
- 6. North America Oncology Molecular Diagnostics Industry Analysis, Insights and Forecast, 2019-2031
- 6.1. Market Analysis, Insights and Forecast - by Product Type
- 6.1.1. Instrument
- 6.1.2. Reagents
- 6.1.3. Other Product Types
- 6.2. Market Analysis, Insights and Forecast - by Technology Type
- 6.2.1. Polymerase Chain Reaction (PCR)
- 6.2.2. Isotherm
- 6.2.3. DNA Sequencing and Next-Generation Sequencing
- 6.2.4. In-situ Hybridization
- 6.2.5. Mass Spectrometry
- 6.2.6. Transcription Mediated Amplification (TMA)
- 6.2.7. Chips and Microarrays
- 6.2.8. Other Technology Types
- 6.3. Market Analysis, Insights and Forecast - by Application Type
- 6.3.1. Breast Cancer
- 6.3.2. Prostate Cancer
- 6.3.3. Colorectal Cancer
- 6.3.4. Lung Cancer
- 6.3.5. Blood Cancer
- 6.3.6. Liver Cancer
- 6.3.7. Cervical Cancer
- 6.3.8. Other Application Types
- 6.4. Market Analysis, Insights and Forecast - by End User
- 6.4.1. Hospitals
- 6.4.2. Diagnostic Centers
- 6.4.3. Other End Users
- 6.1. Market Analysis, Insights and Forecast - by Product Type
- 7. Europe Oncology Molecular Diagnostics Industry Analysis, Insights and Forecast, 2019-2031
- 7.1. Market Analysis, Insights and Forecast - by Product Type
- 7.1.1. Instrument
- 7.1.2. Reagents
- 7.1.3. Other Product Types
- 7.2. Market Analysis, Insights and Forecast - by Technology Type
- 7.2.1. Polymerase Chain Reaction (PCR)
- 7.2.2. Isotherm
- 7.2.3. DNA Sequencing and Next-Generation Sequencing
- 7.2.4. In-situ Hybridization
- 7.2.5. Mass Spectrometry
- 7.2.6. Transcription Mediated Amplification (TMA)
- 7.2.7. Chips and Microarrays
- 7.2.8. Other Technology Types
- 7.3. Market Analysis, Insights and Forecast - by Application Type
- 7.3.1. Breast Cancer
- 7.3.2. Prostate Cancer
- 7.3.3. Colorectal Cancer
- 7.3.4. Lung Cancer
- 7.3.5. Blood Cancer
- 7.3.6. Liver Cancer
- 7.3.7. Cervical Cancer
- 7.3.8. Other Application Types
- 7.4. Market Analysis, Insights and Forecast - by End User
- 7.4.1. Hospitals
- 7.4.2. Diagnostic Centers
- 7.4.3. Other End Users
- 7.1. Market Analysis, Insights and Forecast - by Product Type
- 8. Asia Pacific Oncology Molecular Diagnostics Industry Analysis, Insights and Forecast, 2019-2031
- 8.1. Market Analysis, Insights and Forecast - by Product Type
- 8.1.1. Instrument
- 8.1.2. Reagents
- 8.1.3. Other Product Types
- 8.2. Market Analysis, Insights and Forecast - by Technology Type
- 8.2.1. Polymerase Chain Reaction (PCR)
- 8.2.2. Isotherm
- 8.2.3. DNA Sequencing and Next-Generation Sequencing
- 8.2.4. In-situ Hybridization
- 8.2.5. Mass Spectrometry
- 8.2.6. Transcription Mediated Amplification (TMA)
- 8.2.7. Chips and Microarrays
- 8.2.8. Other Technology Types
- 8.3. Market Analysis, Insights and Forecast - by Application Type
- 8.3.1. Breast Cancer
- 8.3.2. Prostate Cancer
- 8.3.3. Colorectal Cancer
- 8.3.4. Lung Cancer
- 8.3.5. Blood Cancer
- 8.3.6. Liver Cancer
- 8.3.7. Cervical Cancer
- 8.3.8. Other Application Types
- 8.4. Market Analysis, Insights and Forecast - by End User
- 8.4.1. Hospitals
- 8.4.2. Diagnostic Centers
- 8.4.3. Other End Users
- 8.1. Market Analysis, Insights and Forecast - by Product Type
- 9. Middle East and Africa Oncology Molecular Diagnostics Industry Analysis, Insights and Forecast, 2019-2031
- 9.1. Market Analysis, Insights and Forecast - by Product Type
- 9.1.1. Instrument
- 9.1.2. Reagents
- 9.1.3. Other Product Types
- 9.2. Market Analysis, Insights and Forecast - by Technology Type
- 9.2.1. Polymerase Chain Reaction (PCR)
- 9.2.2. Isotherm
- 9.2.3. DNA Sequencing and Next-Generation Sequencing
- 9.2.4. In-situ Hybridization
- 9.2.5. Mass Spectrometry
- 9.2.6. Transcription Mediated Amplification (TMA)
- 9.2.7. Chips and Microarrays
- 9.2.8. Other Technology Types
- 9.3. Market Analysis, Insights and Forecast - by Application Type
- 9.3.1. Breast Cancer
- 9.3.2. Prostate Cancer
- 9.3.3. Colorectal Cancer
- 9.3.4. Lung Cancer
- 9.3.5. Blood Cancer
- 9.3.6. Liver Cancer
- 9.3.7. Cervical Cancer
- 9.3.8. Other Application Types
- 9.4. Market Analysis, Insights and Forecast - by End User
- 9.4.1. Hospitals
- 9.4.2. Diagnostic Centers
- 9.4.3. Other End Users
- 9.1. Market Analysis, Insights and Forecast - by Product Type
- 10. South America Oncology Molecular Diagnostics Industry Analysis, Insights and Forecast, 2019-2031
- 10.1. Market Analysis, Insights and Forecast - by Product Type
- 10.1.1. Instrument
- 10.1.2. Reagents
- 10.1.3. Other Product Types
- 10.2. Market Analysis, Insights and Forecast - by Technology Type
- 10.2.1. Polymerase Chain Reaction (PCR)
- 10.2.2. Isotherm
- 10.2.3. DNA Sequencing and Next-Generation Sequencing
- 10.2.4. In-situ Hybridization
- 10.2.5. Mass Spectrometry
- 10.2.6. Transcription Mediated Amplification (TMA)
- 10.2.7. Chips and Microarrays
- 10.2.8. Other Technology Types
- 10.3. Market Analysis, Insights and Forecast - by Application Type
- 10.3.1. Breast Cancer
- 10.3.2. Prostate Cancer
- 10.3.3. Colorectal Cancer
- 10.3.4. Lung Cancer
- 10.3.5. Blood Cancer
- 10.3.6. Liver Cancer
- 10.3.7. Cervical Cancer
- 10.3.8. Other Application Types
- 10.4. Market Analysis, Insights and Forecast - by End User
- 10.4.1. Hospitals
- 10.4.2. Diagnostic Centers
- 10.4.3. Other End Users
- 10.1. Market Analysis, Insights and Forecast - by Product Type
- 11. North America Oncology Molecular Diagnostics Industry Analysis, Insights and Forecast, 2019-2031
- 11.1. Market Analysis, Insights and Forecast - By Country/Sub-region
- 11.1.1 United States
- 11.1.2 Canada
- 11.1.3 Mexico
- 12. Europe Oncology Molecular Diagnostics Industry Analysis, Insights and Forecast, 2019-2031
- 12.1. Market Analysis, Insights and Forecast - By Country/Sub-region
- 12.1.1 Germany
- 12.1.2 United Kingdom
- 12.1.3 France
- 12.1.4 Italy
- 12.1.5 Spain
- 12.1.6 Rest of Europe
- 13. Asia Pacific Oncology Molecular Diagnostics Industry Analysis, Insights and Forecast, 2019-2031
- 13.1. Market Analysis, Insights and Forecast - By Country/Sub-region
- 13.1.1 China
- 13.1.2 Japan
- 13.1.3 India
- 13.1.4 Australia
- 13.1.5 South Korea
- 13.1.6 Rest of Asia Pacific
- 14. Middle East and Africa Oncology Molecular Diagnostics Industry Analysis, Insights and Forecast, 2019-2031
- 14.1. Market Analysis, Insights and Forecast - By Country/Sub-region
- 14.1.1 GCC
- 14.1.2 South Africa
- 14.1.3 Rest of Middle East and Africa
- 15. South America Oncology Molecular Diagnostics Industry Analysis, Insights and Forecast, 2019-2031
- 15.1. Market Analysis, Insights and Forecast - By Country/Sub-region
- 15.1.1 Brazil
- 15.1.2 Argentina
- 15.1.3 Rest of South America
- 16. Competitive Analysis
- 16.1. Global Market Share Analysis 2024
- 16.2. Company Profiles
- 16.2.1 Agilient Technologies Inc (Dako)
- 16.2.1.1. Overview
- 16.2.1.2. Products
- 16.2.1.3. SWOT Analysis
- 16.2.1.4. Recent Developments
- 16.2.1.5. Financials (Based on Availability)
- 16.2.2 Danaher Corporation (Cepheid)
- 16.2.2.1. Overview
- 16.2.2.2. Products
- 16.2.2.3. SWOT Analysis
- 16.2.2.4. Recent Developments
- 16.2.2.5. Financials (Based on Availability)
- 16.2.3 QIAGEN*List Not Exhaustive
- 16.2.3.1. Overview
- 16.2.3.2. Products
- 16.2.3.3. SWOT Analysis
- 16.2.3.4. Recent Developments
- 16.2.3.5. Financials (Based on Availability)
- 16.2.4 Veracyte Inc
- 16.2.4.1. Overview
- 16.2.4.2. Products
- 16.2.4.3. SWOT Analysis
- 16.2.4.4. Recent Developments
- 16.2.4.5. Financials (Based on Availability)
- 16.2.5 TBG Diagnostics Limited
- 16.2.5.1. Overview
- 16.2.5.2. Products
- 16.2.5.3. SWOT Analysis
- 16.2.5.4. Recent Developments
- 16.2.5.5. Financials (Based on Availability)
- 16.2.6 HTG Molecular Diagnostics Inc
- 16.2.6.1. Overview
- 16.2.6.2. Products
- 16.2.6.3. SWOT Analysis
- 16.2.6.4. Recent Developments
- 16.2.6.5. Financials (Based on Availability)
- 16.2.7 Thermo Fisher Scientific Inc
- 16.2.7.1. Overview
- 16.2.7.2. Products
- 16.2.7.3. SWOT Analysis
- 16.2.7.4. Recent Developments
- 16.2.7.5. Financials (Based on Availability)
- 16.2.8 Abbott Laboratories
- 16.2.8.1. Overview
- 16.2.8.2. Products
- 16.2.8.3. SWOT Analysis
- 16.2.8.4. Recent Developments
- 16.2.8.5. Financials (Based on Availability)
- 16.2.9 F Hoffmann La-Roche Ltd
- 16.2.9.1. Overview
- 16.2.9.2. Products
- 16.2.9.3. SWOT Analysis
- 16.2.9.4. Recent Developments
- 16.2.9.5. Financials (Based on Availability)
- 16.2.10 bioMérieux SA
- 16.2.10.1. Overview
- 16.2.10.2. Products
- 16.2.10.3. SWOT Analysis
- 16.2.10.4. Recent Developments
- 16.2.10.5. Financials (Based on Availability)
- 16.2.11 Illumina Inc
- 16.2.11.1. Overview
- 16.2.11.2. Products
- 16.2.11.3. SWOT Analysis
- 16.2.11.4. Recent Developments
- 16.2.11.5. Financials (Based on Availability)
- 16.2.12 Sysmex Corporation (Sysmex Europe GmbH)
- 16.2.12.1. Overview
- 16.2.12.2. Products
- 16.2.12.3. SWOT Analysis
- 16.2.12.4. Recent Developments
- 16.2.12.5. Financials (Based on Availability)
- 16.2.1 Agilient Technologies Inc (Dako)
List of Figures
- Figure 1: Global Oncology Molecular Diagnostics Industry Revenue Breakdown (Million, %) by Region 2024 & 2032
- Figure 2: North America Oncology Molecular Diagnostics Industry Revenue (Million), by Country 2024 & 2032
- Figure 3: North America Oncology Molecular Diagnostics Industry Revenue Share (%), by Country 2024 & 2032
- Figure 4: Europe Oncology Molecular Diagnostics Industry Revenue (Million), by Country 2024 & 2032
- Figure 5: Europe Oncology Molecular Diagnostics Industry Revenue Share (%), by Country 2024 & 2032
- Figure 6: Asia Pacific Oncology Molecular Diagnostics Industry Revenue (Million), by Country 2024 & 2032
- Figure 7: Asia Pacific Oncology Molecular Diagnostics Industry Revenue Share (%), by Country 2024 & 2032
- Figure 8: Middle East and Africa Oncology Molecular Diagnostics Industry Revenue (Million), by Country 2024 & 2032
- Figure 9: Middle East and Africa Oncology Molecular Diagnostics Industry Revenue Share (%), by Country 2024 & 2032
- Figure 10: South America Oncology Molecular Diagnostics Industry Revenue (Million), by Country 2024 & 2032
- Figure 11: South America Oncology Molecular Diagnostics Industry Revenue Share (%), by Country 2024 & 2032
- Figure 12: North America Oncology Molecular Diagnostics Industry Revenue (Million), by Product Type 2024 & 2032
- Figure 13: North America Oncology Molecular Diagnostics Industry Revenue Share (%), by Product Type 2024 & 2032
- Figure 14: North America Oncology Molecular Diagnostics Industry Revenue (Million), by Technology Type 2024 & 2032
- Figure 15: North America Oncology Molecular Diagnostics Industry Revenue Share (%), by Technology Type 2024 & 2032
- Figure 16: North America Oncology Molecular Diagnostics Industry Revenue (Million), by Application Type 2024 & 2032
- Figure 17: North America Oncology Molecular Diagnostics Industry Revenue Share (%), by Application Type 2024 & 2032
- Figure 18: North America Oncology Molecular Diagnostics Industry Revenue (Million), by End User 2024 & 2032
- Figure 19: North America Oncology Molecular Diagnostics Industry Revenue Share (%), by End User 2024 & 2032
- Figure 20: North America Oncology Molecular Diagnostics Industry Revenue (Million), by Country 2024 & 2032
- Figure 21: North America Oncology Molecular Diagnostics Industry Revenue Share (%), by Country 2024 & 2032
- Figure 22: Europe Oncology Molecular Diagnostics Industry Revenue (Million), by Product Type 2024 & 2032
- Figure 23: Europe Oncology Molecular Diagnostics Industry Revenue Share (%), by Product Type 2024 & 2032
- Figure 24: Europe Oncology Molecular Diagnostics Industry Revenue (Million), by Technology Type 2024 & 2032
- Figure 25: Europe Oncology Molecular Diagnostics Industry Revenue Share (%), by Technology Type 2024 & 2032
- Figure 26: Europe Oncology Molecular Diagnostics Industry Revenue (Million), by Application Type 2024 & 2032
- Figure 27: Europe Oncology Molecular Diagnostics Industry Revenue Share (%), by Application Type 2024 & 2032
- Figure 28: Europe Oncology Molecular Diagnostics Industry Revenue (Million), by End User 2024 & 2032
- Figure 29: Europe Oncology Molecular Diagnostics Industry Revenue Share (%), by End User 2024 & 2032
- Figure 30: Europe Oncology Molecular Diagnostics Industry Revenue (Million), by Country 2024 & 2032
- Figure 31: Europe Oncology Molecular Diagnostics Industry Revenue Share (%), by Country 2024 & 2032
- Figure 32: Asia Pacific Oncology Molecular Diagnostics Industry Revenue (Million), by Product Type 2024 & 2032
- Figure 33: Asia Pacific Oncology Molecular Diagnostics Industry Revenue Share (%), by Product Type 2024 & 2032
- Figure 34: Asia Pacific Oncology Molecular Diagnostics Industry Revenue (Million), by Technology Type 2024 & 2032
- Figure 35: Asia Pacific Oncology Molecular Diagnostics Industry Revenue Share (%), by Technology Type 2024 & 2032
- Figure 36: Asia Pacific Oncology Molecular Diagnostics Industry Revenue (Million), by Application Type 2024 & 2032
- Figure 37: Asia Pacific Oncology Molecular Diagnostics Industry Revenue Share (%), by Application Type 2024 & 2032
- Figure 38: Asia Pacific Oncology Molecular Diagnostics Industry Revenue (Million), by End User 2024 & 2032
- Figure 39: Asia Pacific Oncology Molecular Diagnostics Industry Revenue Share (%), by End User 2024 & 2032
- Figure 40: Asia Pacific Oncology Molecular Diagnostics Industry Revenue (Million), by Country 2024 & 2032
- Figure 41: Asia Pacific Oncology Molecular Diagnostics Industry Revenue Share (%), by Country 2024 & 2032
- Figure 42: Middle East and Africa Oncology Molecular Diagnostics Industry Revenue (Million), by Product Type 2024 & 2032
- Figure 43: Middle East and Africa Oncology Molecular Diagnostics Industry Revenue Share (%), by Product Type 2024 & 2032
- Figure 44: Middle East and Africa Oncology Molecular Diagnostics Industry Revenue (Million), by Technology Type 2024 & 2032
- Figure 45: Middle East and Africa Oncology Molecular Diagnostics Industry Revenue Share (%), by Technology Type 2024 & 2032
- Figure 46: Middle East and Africa Oncology Molecular Diagnostics Industry Revenue (Million), by Application Type 2024 & 2032
- Figure 47: Middle East and Africa Oncology Molecular Diagnostics Industry Revenue Share (%), by Application Type 2024 & 2032
- Figure 48: Middle East and Africa Oncology Molecular Diagnostics Industry Revenue (Million), by End User 2024 & 2032
- Figure 49: Middle East and Africa Oncology Molecular Diagnostics Industry Revenue Share (%), by End User 2024 & 2032
- Figure 50: Middle East and Africa Oncology Molecular Diagnostics Industry Revenue (Million), by Country 2024 & 2032
- Figure 51: Middle East and Africa Oncology Molecular Diagnostics Industry Revenue Share (%), by Country 2024 & 2032
- Figure 52: South America Oncology Molecular Diagnostics Industry Revenue (Million), by Product Type 2024 & 2032
- Figure 53: South America Oncology Molecular Diagnostics Industry Revenue Share (%), by Product Type 2024 & 2032
- Figure 54: South America Oncology Molecular Diagnostics Industry Revenue (Million), by Technology Type 2024 & 2032
- Figure 55: South America Oncology Molecular Diagnostics Industry Revenue Share (%), by Technology Type 2024 & 2032
- Figure 56: South America Oncology Molecular Diagnostics Industry Revenue (Million), by Application Type 2024 & 2032
- Figure 57: South America Oncology Molecular Diagnostics Industry Revenue Share (%), by Application Type 2024 & 2032
- Figure 58: South America Oncology Molecular Diagnostics Industry Revenue (Million), by End User 2024 & 2032
- Figure 59: South America Oncology Molecular Diagnostics Industry Revenue Share (%), by End User 2024 & 2032
- Figure 60: South America Oncology Molecular Diagnostics Industry Revenue (Million), by Country 2024 & 2032
- Figure 61: South America Oncology Molecular Diagnostics Industry Revenue Share (%), by Country 2024 & 2032
List of Tables
- Table 1: Global Oncology Molecular Diagnostics Industry Revenue Million Forecast, by Region 2019 & 2032
- Table 2: Global Oncology Molecular Diagnostics Industry Revenue Million Forecast, by Product Type 2019 & 2032
- Table 3: Global Oncology Molecular Diagnostics Industry Revenue Million Forecast, by Technology Type 2019 & 2032
- Table 4: Global Oncology Molecular Diagnostics Industry Revenue Million Forecast, by Application Type 2019 & 2032
- Table 5: Global Oncology Molecular Diagnostics Industry Revenue Million Forecast, by End User 2019 & 2032
- Table 6: Global Oncology Molecular Diagnostics Industry Revenue Million Forecast, by Region 2019 & 2032
- Table 7: Global Oncology Molecular Diagnostics Industry Revenue Million Forecast, by Country 2019 & 2032
- Table 8: United States Oncology Molecular Diagnostics Industry Revenue (Million) Forecast, by Application 2019 & 2032
- Table 9: Canada Oncology Molecular Diagnostics Industry Revenue (Million) Forecast, by Application 2019 & 2032
- Table 10: Mexico Oncology Molecular Diagnostics Industry Revenue (Million) Forecast, by Application 2019 & 2032
- Table 11: Global Oncology Molecular Diagnostics Industry Revenue Million Forecast, by Country 2019 & 2032
- Table 12: Germany Oncology Molecular Diagnostics Industry Revenue (Million) Forecast, by Application 2019 & 2032
- Table 13: United Kingdom Oncology Molecular Diagnostics Industry Revenue (Million) Forecast, by Application 2019 & 2032
- Table 14: France Oncology Molecular Diagnostics Industry Revenue (Million) Forecast, by Application 2019 & 2032
- Table 15: Italy Oncology Molecular Diagnostics Industry Revenue (Million) Forecast, by Application 2019 & 2032
- Table 16: Spain Oncology Molecular Diagnostics Industry Revenue (Million) Forecast, by Application 2019 & 2032
- Table 17: Rest of Europe Oncology Molecular Diagnostics Industry Revenue (Million) Forecast, by Application 2019 & 2032
- Table 18: Global Oncology Molecular Diagnostics Industry Revenue Million Forecast, by Country 2019 & 2032
- Table 19: China Oncology Molecular Diagnostics Industry Revenue (Million) Forecast, by Application 2019 & 2032
- Table 20: Japan Oncology Molecular Diagnostics Industry Revenue (Million) Forecast, by Application 2019 & 2032
- Table 21: India Oncology Molecular Diagnostics Industry Revenue (Million) Forecast, by Application 2019 & 2032
- Table 22: Australia Oncology Molecular Diagnostics Industry Revenue (Million) Forecast, by Application 2019 & 2032
- Table 23: South Korea Oncology Molecular Diagnostics Industry Revenue (Million) Forecast, by Application 2019 & 2032
- Table 24: Rest of Asia Pacific Oncology Molecular Diagnostics Industry Revenue (Million) Forecast, by Application 2019 & 2032
- Table 25: Global Oncology Molecular Diagnostics Industry Revenue Million Forecast, by Country 2019 & 2032
- Table 26: GCC Oncology Molecular Diagnostics Industry Revenue (Million) Forecast, by Application 2019 & 2032
- Table 27: South Africa Oncology Molecular Diagnostics Industry Revenue (Million) Forecast, by Application 2019 & 2032
- Table 28: Rest of Middle East and Africa Oncology Molecular Diagnostics Industry Revenue (Million) Forecast, by Application 2019 & 2032
- Table 29: Global Oncology Molecular Diagnostics Industry Revenue Million Forecast, by Country 2019 & 2032
- Table 30: Brazil Oncology Molecular Diagnostics Industry Revenue (Million) Forecast, by Application 2019 & 2032
- Table 31: Argentina Oncology Molecular Diagnostics Industry Revenue (Million) Forecast, by Application 2019 & 2032
- Table 32: Rest of South America Oncology Molecular Diagnostics Industry Revenue (Million) Forecast, by Application 2019 & 2032
- Table 33: Global Oncology Molecular Diagnostics Industry Revenue Million Forecast, by Product Type 2019 & 2032
- Table 34: Global Oncology Molecular Diagnostics Industry Revenue Million Forecast, by Technology Type 2019 & 2032
- Table 35: Global Oncology Molecular Diagnostics Industry Revenue Million Forecast, by Application Type 2019 & 2032
- Table 36: Global Oncology Molecular Diagnostics Industry Revenue Million Forecast, by End User 2019 & 2032
- Table 37: Global Oncology Molecular Diagnostics Industry Revenue Million Forecast, by Country 2019 & 2032
- Table 38: United States Oncology Molecular Diagnostics Industry Revenue (Million) Forecast, by Application 2019 & 2032
- Table 39: Canada Oncology Molecular Diagnostics Industry Revenue (Million) Forecast, by Application 2019 & 2032
- Table 40: Mexico Oncology Molecular Diagnostics Industry Revenue (Million) Forecast, by Application 2019 & 2032
- Table 41: Global Oncology Molecular Diagnostics Industry Revenue Million Forecast, by Product Type 2019 & 2032
- Table 42: Global Oncology Molecular Diagnostics Industry Revenue Million Forecast, by Technology Type 2019 & 2032
- Table 43: Global Oncology Molecular Diagnostics Industry Revenue Million Forecast, by Application Type 2019 & 2032
- Table 44: Global Oncology Molecular Diagnostics Industry Revenue Million Forecast, by End User 2019 & 2032
- Table 45: Global Oncology Molecular Diagnostics Industry Revenue Million Forecast, by Country 2019 & 2032
- Table 46: Germany Oncology Molecular Diagnostics Industry Revenue (Million) Forecast, by Application 2019 & 2032
- Table 47: United Kingdom Oncology Molecular Diagnostics Industry Revenue (Million) Forecast, by Application 2019 & 2032
- Table 48: France Oncology Molecular Diagnostics Industry Revenue (Million) Forecast, by Application 2019 & 2032
- Table 49: Italy Oncology Molecular Diagnostics Industry Revenue (Million) Forecast, by Application 2019 & 2032
- Table 50: Spain Oncology Molecular Diagnostics Industry Revenue (Million) Forecast, by Application 2019 & 2032
- Table 51: Rest of Europe Oncology Molecular Diagnostics Industry Revenue (Million) Forecast, by Application 2019 & 2032
- Table 52: Global Oncology Molecular Diagnostics Industry Revenue Million Forecast, by Product Type 2019 & 2032
- Table 53: Global Oncology Molecular Diagnostics Industry Revenue Million Forecast, by Technology Type 2019 & 2032
- Table 54: Global Oncology Molecular Diagnostics Industry Revenue Million Forecast, by Application Type 2019 & 2032
- Table 55: Global Oncology Molecular Diagnostics Industry Revenue Million Forecast, by End User 2019 & 2032
- Table 56: Global Oncology Molecular Diagnostics Industry Revenue Million Forecast, by Country 2019 & 2032
- Table 57: China Oncology Molecular Diagnostics Industry Revenue (Million) Forecast, by Application 2019 & 2032
- Table 58: Japan Oncology Molecular Diagnostics Industry Revenue (Million) Forecast, by Application 2019 & 2032
- Table 59: India Oncology Molecular Diagnostics Industry Revenue (Million) Forecast, by Application 2019 & 2032
- Table 60: Australia Oncology Molecular Diagnostics Industry Revenue (Million) Forecast, by Application 2019 & 2032
- Table 61: South Korea Oncology Molecular Diagnostics Industry Revenue (Million) Forecast, by Application 2019 & 2032
- Table 62: Rest of Asia Pacific Oncology Molecular Diagnostics Industry Revenue (Million) Forecast, by Application 2019 & 2032
- Table 63: Global Oncology Molecular Diagnostics Industry Revenue Million Forecast, by Product Type 2019 & 2032
- Table 64: Global Oncology Molecular Diagnostics Industry Revenue Million Forecast, by Technology Type 2019 & 2032
- Table 65: Global Oncology Molecular Diagnostics Industry Revenue Million Forecast, by Application Type 2019 & 2032
- Table 66: Global Oncology Molecular Diagnostics Industry Revenue Million Forecast, by End User 2019 & 2032
- Table 67: Global Oncology Molecular Diagnostics Industry Revenue Million Forecast, by Country 2019 & 2032
- Table 68: GCC Oncology Molecular Diagnostics Industry Revenue (Million) Forecast, by Application 2019 & 2032
- Table 69: South Africa Oncology Molecular Diagnostics Industry Revenue (Million) Forecast, by Application 2019 & 2032
- Table 70: Rest of Middle East and Africa Oncology Molecular Diagnostics Industry Revenue (Million) Forecast, by Application 2019 & 2032
- Table 71: Global Oncology Molecular Diagnostics Industry Revenue Million Forecast, by Product Type 2019 & 2032
- Table 72: Global Oncology Molecular Diagnostics Industry Revenue Million Forecast, by Technology Type 2019 & 2032
- Table 73: Global Oncology Molecular Diagnostics Industry Revenue Million Forecast, by Application Type 2019 & 2032
- Table 74: Global Oncology Molecular Diagnostics Industry Revenue Million Forecast, by End User 2019 & 2032
- Table 75: Global Oncology Molecular Diagnostics Industry Revenue Million Forecast, by Country 2019 & 2032
- Table 76: Brazil Oncology Molecular Diagnostics Industry Revenue (Million) Forecast, by Application 2019 & 2032
- Table 77: Argentina Oncology Molecular Diagnostics Industry Revenue (Million) Forecast, by Application 2019 & 2032
- Table 78: Rest of South America Oncology Molecular Diagnostics Industry Revenue (Million) Forecast, by Application 2019 & 2032
Frequently Asked Questions
1. What is the projected Compound Annual Growth Rate (CAGR) of the Oncology Molecular Diagnostics Industry?
The projected CAGR is approximately > 12.00%.
2. Which companies are prominent players in the Oncology Molecular Diagnostics Industry?
Key companies in the market include Agilient Technologies Inc (Dako), Danaher Corporation (Cepheid), QIAGEN*List Not Exhaustive, Veracyte Inc, TBG Diagnostics Limited, HTG Molecular Diagnostics Inc, Thermo Fisher Scientific Inc, Abbott Laboratories, F Hoffmann La-Roche Ltd, bioMérieux SA, Illumina Inc, Sysmex Corporation (Sysmex Europe GmbH).
3. What are the main segments of the Oncology Molecular Diagnostics Industry?
The market segments include Product Type, Technology Type, Application Type, End User.
4. Can you provide details about the market size?
The market size is estimated to be USD XX Million as of 2022.
5. What are some drivers contributing to market growth?
Rising Prevalence of Cancer Worldwide; Technological Advancements in Diagnostic Testing; Increasing Demand for Point-of-care Treatment.
6. What are the notable trends driving market growth?
Polymerase Chain Reaction (PCR) is Anticipated to Observe a Significant Growth.
7. Are there any restraints impacting market growth?
High Cost of Molecular Diagnostic Tests; Lack of Skilled Workforce and Stringent Regulatory Framework.
8. Can you provide examples of recent developments in the market?
N/A
9. What pricing options are available for accessing the report?
Pricing options include single-user, multi-user, and enterprise licenses priced at USD 4750, USD 5250, and USD 8750 respectively.
10. Is the market size provided in terms of value or volume?
The market size is provided in terms of value, measured in Million.
11. Are there any specific market keywords associated with the report?
Yes, the market keyword associated with the report is "Oncology Molecular Diagnostics Industry," which aids in identifying and referencing the specific market segment covered.
12. How do I determine which pricing option suits my needs best?
The pricing options vary based on user requirements and access needs. Individual users may opt for single-user licenses, while businesses requiring broader access may choose multi-user or enterprise licenses for cost-effective access to the report.
13. Are there any additional resources or data provided in the Oncology Molecular Diagnostics Industry report?
While the report offers comprehensive insights, it's advisable to review the specific contents or supplementary materials provided to ascertain if additional resources or data are available.
14. How can I stay updated on further developments or reports in the Oncology Molecular Diagnostics Industry?
To stay informed about further developments, trends, and reports in the Oncology Molecular Diagnostics Industry, consider subscribing to industry newsletters, following relevant companies and organizations, or regularly checking reputable industry news sources and publications.
Methodology
Step 1 - Identification of Relevant Samples Size from Population Database


Step 2 - Approaches for Defining Global Market Size (Value, Volume* & Price*)

Note*: In applicable scenarios
Step 3 - Data Sources
Primary Research
- Web Analytics
- Survey Reports
- Research Institute
- Latest Research Reports
- Opinion Leaders
Secondary Research
- Annual Reports
- White Paper
- Latest Press Release
- Industry Association
- Paid Database
- Investor Presentations

Step 4 - Data Triangulation
Involves using different sources of information in order to increase the validity of a study
These sources are likely to be stakeholders in a program - participants, other researchers, program staff, other community members, and so on.
Then we put all data in single framework & apply various statistical tools to find out the dynamic on the market.
During the analysis stage, feedback from the stakeholder groups would be compared to determine areas of agreement as well as areas of divergence
