

Key Insights
The global pipeline pigging equipment market is experiencing robust growth, driven by the increasing demand for efficient pipeline maintenance and inspection across the oil and gas industry. The market's Compound Annual Growth Rate (CAGR) exceeding 5.50% from 2019 to 2024 indicates a strong upward trajectory, projected to continue into the forecast period (2025-2033). Key drivers include the aging infrastructure of existing pipelines necessitating regular maintenance and the stringent regulatory requirements for pipeline safety across various regions. The rising adoption of advanced pigging technologies, such as intelligent pigs equipped with sensors for enhanced data acquisition and analysis, further fuels market expansion. Growth is segmented across various applications (oil and gas pipelines) and product categories, including pipeline pig products, replacement components (pig passage indicators, trackers, launching/receiving equipment, and pig washer equipment), and closures. North America and Europe currently hold significant market shares, attributed to well-established pipeline networks and stringent regulatory landscapes. However, rapid industrialization and infrastructure development in the Asia-Pacific region are expected to drive substantial growth in the coming years, with China, India, and Southeast Asia emerging as key markets.
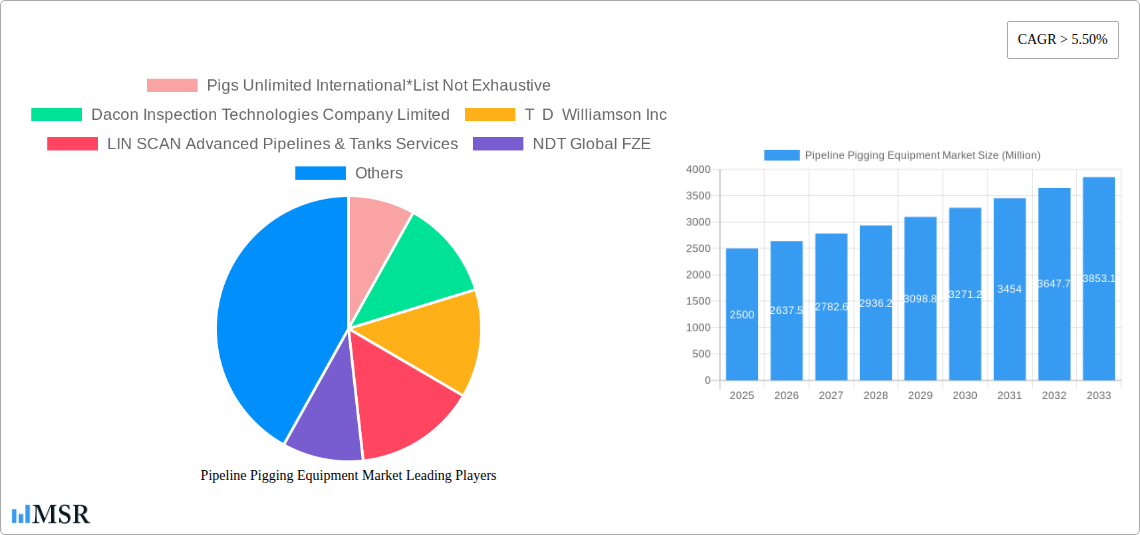
While challenges such as high initial investment costs for advanced pigging equipment and potential technological disruptions might pose some restraints, the overall market outlook remains positive. The strategic focus on improving pipeline efficiency and minimizing downtime through effective pigging technologies is a significant factor driving market expansion. Competition among established players like Pigs Unlimited International, Dacon Inspection Technologies, T D Williamson, and Baker Hughes, alongside emerging companies, is likely to intensify, leading to innovative product development and competitive pricing. The ongoing demand for efficient and reliable pipeline maintenance solutions will continue to propel growth in the pipeline pigging equipment market throughout the forecast period. We estimate the market size in 2025 to be approximately $2.5 billion, based on the provided CAGR and considering the market's established size and growth trajectory. This figure will likely increase significantly by 2033 due to continued demand and technological advancements.
Pipeline Pigging Equipment Market: A Comprehensive Report (2019-2033)
This comprehensive report provides an in-depth analysis of the global Pipeline Pigging Equipment market, offering invaluable insights for industry stakeholders, investors, and strategic decision-makers. Covering the period 2019-2033, with a focus on 2025, this report meticulously examines market dynamics, trends, leading players, and future growth opportunities. The market size is projected to reach xx Million by 2033, exhibiting a CAGR of xx% during the forecast period (2025-2033).
Pipeline Pigging Equipment Market Concentration & Dynamics
The Pipeline Pigging Equipment market exhibits a moderately concentrated landscape, with key players like Pigs Unlimited International, Dacon Inspection Technologies Company Limited, T D Williamson Inc, and Baker Hughes a GE Co holding significant market share. The market share distribution is dynamic, influenced by factors such as technological advancements, M&A activities, and regulatory changes. Innovation ecosystems are robust, with ongoing R&D focused on enhancing pigging efficiency, durability, and data analytics capabilities.
- Market Concentration: The top 5 players account for approximately xx% of the global market share in 2025.
- M&A Activity: A total of xx M&A deals were recorded in the historical period (2019-2024), indicating a consolidated market with strategic acquisitions driving growth.
- Regulatory Landscape: Stringent environmental regulations and safety standards influence product design and adoption.
- Substitute Products: While limited, alternative pipeline cleaning methods pose a potential threat to market growth.
- End-User Trends: Increasing demand for efficient and reliable pipeline maintenance drives market expansion.
Pipeline Pigging Equipment Market Industry Insights & Trends
The Pipeline Pigging Equipment market is driven by the burgeoning oil and gas industry, expanding pipeline networks, and the rising need for efficient pipeline maintenance. The market witnessed significant growth during the historical period (2019-2024), driven by increasing investments in pipeline infrastructure, especially in developing economies. Technological advancements like smart pigs with integrated sensors and data analytics capabilities are revolutionizing pipeline inspection and maintenance processes. The shift towards automation and remote monitoring enhances operational efficiency and reduces downtime. Consumer behavior is leaning towards cost-effective, reliable, and environmentally friendly solutions. The market size in 2025 is estimated at xx Million.

Key Markets & Segments Leading Pipeline Pigging Equipment Market
The Oil Pipeline application segment holds the largest market share, driven by the extensive global network of oil pipelines and the stringent requirements for efficient maintenance. Geographically, North America and the Middle East dominate the market due to significant oil and gas production and robust pipeline infrastructure.
Leading Segments:
- Application: Oil Pipeline (xx Million), Gas Pipeline (xx Million)
- Products: Pipeline Pig Products (xx Million), Replacement Components (xx Million) - Pig Passage Indicators, Pig Trackers and Indicators, Pig Launching and Receiving, Pig Washer Equipment, Closures.
Drivers:
- Economic Growth: Investments in oil and gas infrastructure fuel market demand.
- Infrastructure Development: Expansion of pipeline networks necessitates pipeline pigging equipment.
- Stringent Regulations: Compliance with environmental and safety standards drives adoption of advanced technologies.
Detailed dominance analysis shows that North America leads owing to robust oil & gas production and established pipeline networks. The Middle East follows closely, with significant investments in pipeline infrastructure.
Pipeline Pigging Equipment Market Product Developments
Recent product innovations focus on enhancing pigging efficiency, data acquisition, and remote monitoring capabilities. Smart pigs with integrated sensors provide real-time data on pipeline conditions, enabling proactive maintenance and reducing downtime. The development of durable and corrosion-resistant materials extends pig lifespan and reduces replacement costs. These advancements provide manufacturers a significant competitive advantage.
Challenges in the Pipeline Pigging Equipment Market Market
The Pipeline Pigging Equipment market faces challenges from fluctuating oil and gas prices, supply chain disruptions, and intense competition. Stringent regulatory requirements increase compliance costs and product development complexity. These factors impact profitability and hinder market growth. The global economic downturn also affected sales in some regions.
Forces Driving Pipeline Pigging Equipment Market Growth
Technological advancements, particularly in smart pig technology and data analytics, are major growth catalysts. Increased investments in pipeline infrastructure projects worldwide, driven by rising energy demand, further fuel market expansion. Moreover, stringent regulations concerning pipeline safety and environmental protection incentivize the adoption of advanced pigging technologies.
Long-Term Growth Catalysts in the Pipeline Pigging Equipment Market
Long-term growth will be driven by ongoing technological innovations, strategic partnerships between equipment manufacturers and pipeline operators, and the expansion into new geographic markets with developing pipeline infrastructure. The increasing adoption of digitalization and the Internet of Things (IoT) will also be key drivers.
Emerging Opportunities in Pipeline Pigging Equipment Market
Emerging opportunities lie in the development of environmentally friendly and sustainable pigging solutions, the integration of advanced data analytics and artificial intelligence (AI) for predictive maintenance, and the expansion into new markets, particularly in regions with developing pipeline infrastructure. Specialized pigging equipment for specific pipeline types (e.g., high-pressure pipelines, subsea pipelines) will also create new market opportunities.
Leading Players in the Pipeline Pigging Equipment Market Sector
- Pigs Unlimited International
- Dacon Inspection Technologies Company Limited
- T D Williamson Inc
- LIN SCAN Advanced Pipelines & Tanks Services
- NDT Global FZE
- Xylem Inc
- 3P Services GmbH & Co KG
- Russell NDE Systems
- Baker Hughes a GE Co
Key Milestones in Pipeline Pigging Equipment Market Industry
- 2020: Introduction of a new generation of smart pigs with enhanced data analytics capabilities by Pigs Unlimited International.
- 2022: Acquisition of a smaller pigging equipment manufacturer by T D Williamson Inc, expanding its market reach.
- 2023: Launch of a new, eco-friendly pigging technology by Xylem Inc.
Strategic Outlook for Pipeline Pigging Equipment Market Market
The Pipeline Pigging Equipment market presents significant growth potential driven by sustained investments in pipeline infrastructure, the increasing adoption of advanced technologies, and stringent environmental regulations. Strategic partnerships, acquisitions, and the development of innovative, sustainable pigging solutions will be crucial for securing a competitive edge and capturing market share in the coming years. The market is poised for robust expansion, offering substantial opportunities for both established players and new entrants.
Pipeline Pigging Equipment Market Segmentation
-
1. Application
- 1.1. Oil Pipeline
- 1.2. Gas Pipeline
-
2. Products
-
2.1. Pipeline Pig Products
- 2.1.1. Batching Pigs
- 2.1.2. Cleaning Pigs
- 2.1.3. Gauging Pigs
- 2.1.4. Liquids Displacement Pigs
- 2.1.5. Special Application Pigs
- 2.1.6. Replacement Components
- 2.2. Pig Passage Indicators
- 2.3. Pig Trackers and Indicators
- 2.4. Pig Launching and Receiving
- 2.5. Pig Washer Equipment
- 2.6. Closures
-
2.1. Pipeline Pig Products
Pipeline Pigging Equipment Market Segmentation By Geography
- 1. North America
- 2. Europe
- 3. Asia Pacific
- 4. South America
- 5. Middle East and Africa

Pipeline Pigging Equipment Market REPORT HIGHLIGHTS
| Aspects | Details |
|---|---|
| Study Period | 2019-2033 |
| Base Year | 2024 |
| Estimated Year | 2025 |
| Forecast Period | 2025-2033 |
| Historical Period | 2019-2024 |
| Growth Rate | CAGR of > 5.50% from 2019-2033 |
| Segmentation |
|
Table of Contents
- 1. Introduction
- 1.1. Research Scope
- 1.2. Market Segmentation
- 1.3. Research Methodology
- 1.4. Definitions and Assumptions
- 2. Executive Summary
- 2.1. Introduction
- 3. Market Dynamics
- 3.1. Introduction
- 3.2. Market Drivers
- 3.2.1. 4.; The Rise in Oil and Gas Drilling Activities4.; Increased Shale Gas Exploration
- 3.3. Market Restrains
- 3.3.1. 4.; Increasing Share of Renewable Energy
- 3.4. Market Trends
- 3.4.1. Gas Pipeline Pigging System to Dominate the Market
- 4. Market Factor Analysis
- 4.1. Porters Five Forces
- 4.2. Supply/Value Chain
- 4.3. PESTEL analysis
- 4.4. Market Entropy
- 4.5. Patent/Trademark Analysis
- 5. Global Pipeline Pigging Equipment Market Analysis, Insights and Forecast, 2019-2031
- 5.1. Market Analysis, Insights and Forecast - by Application
- 5.1.1. Oil Pipeline
- 5.1.2. Gas Pipeline
- 5.2. Market Analysis, Insights and Forecast - by Products
- 5.2.1. Pipeline Pig Products
- 5.2.1.1. Batching Pigs
- 5.2.1.2. Cleaning Pigs
- 5.2.1.3. Gauging Pigs
- 5.2.1.4. Liquids Displacement Pigs
- 5.2.1.5. Special Application Pigs
- 5.2.1.6. Replacement Components
- 5.2.2. Pig Passage Indicators
- 5.2.3. Pig Trackers and Indicators
- 5.2.4. Pig Launching and Receiving
- 5.2.5. Pig Washer Equipment
- 5.2.6. Closures
- 5.2.1. Pipeline Pig Products
- 5.3. Market Analysis, Insights and Forecast - by Region
- 5.3.1. North America
- 5.3.2. Europe
- 5.3.3. Asia Pacific
- 5.3.4. South America
- 5.3.5. Middle East and Africa
- 5.1. Market Analysis, Insights and Forecast - by Application
- 6. North America Pipeline Pigging Equipment Market Analysis, Insights and Forecast, 2019-2031
- 6.1. Market Analysis, Insights and Forecast - by Application
- 6.1.1. Oil Pipeline
- 6.1.2. Gas Pipeline
- 6.2. Market Analysis, Insights and Forecast - by Products
- 6.2.1. Pipeline Pig Products
- 6.2.1.1. Batching Pigs
- 6.2.1.2. Cleaning Pigs
- 6.2.1.3. Gauging Pigs
- 6.2.1.4. Liquids Displacement Pigs
- 6.2.1.5. Special Application Pigs
- 6.2.1.6. Replacement Components
- 6.2.2. Pig Passage Indicators
- 6.2.3. Pig Trackers and Indicators
- 6.2.4. Pig Launching and Receiving
- 6.2.5. Pig Washer Equipment
- 6.2.6. Closures
- 6.2.1. Pipeline Pig Products
- 6.1. Market Analysis, Insights and Forecast - by Application
- 7. Europe Pipeline Pigging Equipment Market Analysis, Insights and Forecast, 2019-2031
- 7.1. Market Analysis, Insights and Forecast - by Application
- 7.1.1. Oil Pipeline
- 7.1.2. Gas Pipeline
- 7.2. Market Analysis, Insights and Forecast - by Products
- 7.2.1. Pipeline Pig Products
- 7.2.1.1. Batching Pigs
- 7.2.1.2. Cleaning Pigs
- 7.2.1.3. Gauging Pigs
- 7.2.1.4. Liquids Displacement Pigs
- 7.2.1.5. Special Application Pigs
- 7.2.1.6. Replacement Components
- 7.2.2. Pig Passage Indicators
- 7.2.3. Pig Trackers and Indicators
- 7.2.4. Pig Launching and Receiving
- 7.2.5. Pig Washer Equipment
- 7.2.6. Closures
- 7.2.1. Pipeline Pig Products
- 7.1. Market Analysis, Insights and Forecast - by Application
- 8. Asia Pacific Pipeline Pigging Equipment Market Analysis, Insights and Forecast, 2019-2031
- 8.1. Market Analysis, Insights and Forecast - by Application
- 8.1.1. Oil Pipeline
- 8.1.2. Gas Pipeline
- 8.2. Market Analysis, Insights and Forecast - by Products
- 8.2.1. Pipeline Pig Products
- 8.2.1.1. Batching Pigs
- 8.2.1.2. Cleaning Pigs
- 8.2.1.3. Gauging Pigs
- 8.2.1.4. Liquids Displacement Pigs
- 8.2.1.5. Special Application Pigs
- 8.2.1.6. Replacement Components
- 8.2.2. Pig Passage Indicators
- 8.2.3. Pig Trackers and Indicators
- 8.2.4. Pig Launching and Receiving
- 8.2.5. Pig Washer Equipment
- 8.2.6. Closures
- 8.2.1. Pipeline Pig Products
- 8.1. Market Analysis, Insights and Forecast - by Application
- 9. South America Pipeline Pigging Equipment Market Analysis, Insights and Forecast, 2019-2031
- 9.1. Market Analysis, Insights and Forecast - by Application
- 9.1.1. Oil Pipeline
- 9.1.2. Gas Pipeline
- 9.2. Market Analysis, Insights and Forecast - by Products
- 9.2.1. Pipeline Pig Products
- 9.2.1.1. Batching Pigs
- 9.2.1.2. Cleaning Pigs
- 9.2.1.3. Gauging Pigs
- 9.2.1.4. Liquids Displacement Pigs
- 9.2.1.5. Special Application Pigs
- 9.2.1.6. Replacement Components
- 9.2.2. Pig Passage Indicators
- 9.2.3. Pig Trackers and Indicators
- 9.2.4. Pig Launching and Receiving
- 9.2.5. Pig Washer Equipment
- 9.2.6. Closures
- 9.2.1. Pipeline Pig Products
- 9.1. Market Analysis, Insights and Forecast - by Application
- 10. Middle East and Africa Pipeline Pigging Equipment Market Analysis, Insights and Forecast, 2019-2031
- 10.1. Market Analysis, Insights and Forecast - by Application
- 10.1.1. Oil Pipeline
- 10.1.2. Gas Pipeline
- 10.2. Market Analysis, Insights and Forecast - by Products
- 10.2.1. Pipeline Pig Products
- 10.2.1.1. Batching Pigs
- 10.2.1.2. Cleaning Pigs
- 10.2.1.3. Gauging Pigs
- 10.2.1.4. Liquids Displacement Pigs
- 10.2.1.5. Special Application Pigs
- 10.2.1.6. Replacement Components
- 10.2.2. Pig Passage Indicators
- 10.2.3. Pig Trackers and Indicators
- 10.2.4. Pig Launching and Receiving
- 10.2.5. Pig Washer Equipment
- 10.2.6. Closures
- 10.2.1. Pipeline Pig Products
- 10.1. Market Analysis, Insights and Forecast - by Application
- 11. North America Pipeline Pigging Equipment Market Analysis, Insights and Forecast, 2019-2031
- 11.1. Market Analysis, Insights and Forecast - By Country/Sub-region
- 11.1.1 United States
- 11.1.2 Canada
- 11.1.3 Mexico
- 12. Europe Pipeline Pigging Equipment Market Analysis, Insights and Forecast, 2019-2031
- 12.1. Market Analysis, Insights and Forecast - By Country/Sub-region
- 12.1.1 Germany
- 12.1.2 United Kingdom
- 12.1.3 France
- 12.1.4 Spain
- 12.1.5 Italy
- 12.1.6 Spain
- 12.1.7 Belgium
- 12.1.8 Netherland
- 12.1.9 Nordics
- 12.1.10 Rest of Europe
- 13. Asia Pacific Pipeline Pigging Equipment Market Analysis, Insights and Forecast, 2019-2031
- 13.1. Market Analysis, Insights and Forecast - By Country/Sub-region
- 13.1.1 China
- 13.1.2 Japan
- 13.1.3 India
- 13.1.4 South Korea
- 13.1.5 Southeast Asia
- 13.1.6 Australia
- 13.1.7 Indonesia
- 13.1.8 Phillipes
- 13.1.9 Singapore
- 13.1.10 Thailandc
- 13.1.11 Rest of Asia Pacific
- 14. South America Pipeline Pigging Equipment Market Analysis, Insights and Forecast, 2019-2031
- 14.1. Market Analysis, Insights and Forecast - By Country/Sub-region
- 14.1.1 Brazil
- 14.1.2 Argentina
- 14.1.3 Peru
- 14.1.4 Chile
- 14.1.5 Colombia
- 14.1.6 Ecuador
- 14.1.7 Venezuela
- 14.1.8 Rest of South America
- 15. North America Pipeline Pigging Equipment Market Analysis, Insights and Forecast, 2019-2031
- 15.1. Market Analysis, Insights and Forecast - By Country/Sub-region
- 15.1.1 United States
- 15.1.2 Canada
- 15.1.3 Mexico
- 16. MEA Pipeline Pigging Equipment Market Analysis, Insights and Forecast, 2019-2031
- 16.1. Market Analysis, Insights and Forecast - By Country/Sub-region
- 16.1.1 United Arab Emirates
- 16.1.2 Saudi Arabia
- 16.1.3 South Africa
- 16.1.4 Rest of Middle East and Africa
- 17. Competitive Analysis
- 17.1. Global Market Share Analysis 2024
- 17.2. Company Profiles
- 17.2.1 Pigs Unlimited International*List Not Exhaustive
- 17.2.1.1. Overview
- 17.2.1.2. Products
- 17.2.1.3. SWOT Analysis
- 17.2.1.4. Recent Developments
- 17.2.1.5. Financials (Based on Availability)
- 17.2.2 Dacon Inspection Technologies Company Limited
- 17.2.2.1. Overview
- 17.2.2.2. Products
- 17.2.2.3. SWOT Analysis
- 17.2.2.4. Recent Developments
- 17.2.2.5. Financials (Based on Availability)
- 17.2.3 T D Williamson Inc
- 17.2.3.1. Overview
- 17.2.3.2. Products
- 17.2.3.3. SWOT Analysis
- 17.2.3.4. Recent Developments
- 17.2.3.5. Financials (Based on Availability)
- 17.2.4 LIN SCAN Advanced Pipelines & Tanks Services
- 17.2.4.1. Overview
- 17.2.4.2. Products
- 17.2.4.3. SWOT Analysis
- 17.2.4.4. Recent Developments
- 17.2.4.5. Financials (Based on Availability)
- 17.2.5 NDT Global FZE
- 17.2.5.1. Overview
- 17.2.5.2. Products
- 17.2.5.3. SWOT Analysis
- 17.2.5.4. Recent Developments
- 17.2.5.5. Financials (Based on Availability)
- 17.2.6 Xylem Inc
- 17.2.6.1. Overview
- 17.2.6.2. Products
- 17.2.6.3. SWOT Analysis
- 17.2.6.4. Recent Developments
- 17.2.6.5. Financials (Based on Availability)
- 17.2.7 3P Services GmbH & Co KG
- 17.2.7.1. Overview
- 17.2.7.2. Products
- 17.2.7.3. SWOT Analysis
- 17.2.7.4. Recent Developments
- 17.2.7.5. Financials (Based on Availability)
- 17.2.8 Russell NDE Systems
- 17.2.8.1. Overview
- 17.2.8.2. Products
- 17.2.8.3. SWOT Analysis
- 17.2.8.4. Recent Developments
- 17.2.8.5. Financials (Based on Availability)
- 17.2.9 Baker Hughes a GE Co
- 17.2.9.1. Overview
- 17.2.9.2. Products
- 17.2.9.3. SWOT Analysis
- 17.2.9.4. Recent Developments
- 17.2.9.5. Financials (Based on Availability)
- 17.2.1 Pigs Unlimited International*List Not Exhaustive
List of Figures
- Figure 1: Global Pipeline Pigging Equipment Market Revenue Breakdown (Million, %) by Region 2024 & 2032
- Figure 2: Global Pipeline Pigging Equipment Market Volume Breakdown (Kiloton, %) by Region 2024 & 2032
- Figure 3: North America Pipeline Pigging Equipment Market Revenue (Million), by Country 2024 & 2032
- Figure 4: North America Pipeline Pigging Equipment Market Volume (Kiloton), by Country 2024 & 2032
- Figure 5: North America Pipeline Pigging Equipment Market Revenue Share (%), by Country 2024 & 2032
- Figure 6: North America Pipeline Pigging Equipment Market Volume Share (%), by Country 2024 & 2032
- Figure 7: Europe Pipeline Pigging Equipment Market Revenue (Million), by Country 2024 & 2032
- Figure 8: Europe Pipeline Pigging Equipment Market Volume (Kiloton), by Country 2024 & 2032
- Figure 9: Europe Pipeline Pigging Equipment Market Revenue Share (%), by Country 2024 & 2032
- Figure 10: Europe Pipeline Pigging Equipment Market Volume Share (%), by Country 2024 & 2032
- Figure 11: Asia Pacific Pipeline Pigging Equipment Market Revenue (Million), by Country 2024 & 2032
- Figure 12: Asia Pacific Pipeline Pigging Equipment Market Volume (Kiloton), by Country 2024 & 2032
- Figure 13: Asia Pacific Pipeline Pigging Equipment Market Revenue Share (%), by Country 2024 & 2032
- Figure 14: Asia Pacific Pipeline Pigging Equipment Market Volume Share (%), by Country 2024 & 2032
- Figure 15: South America Pipeline Pigging Equipment Market Revenue (Million), by Country 2024 & 2032
- Figure 16: South America Pipeline Pigging Equipment Market Volume (Kiloton), by Country 2024 & 2032
- Figure 17: South America Pipeline Pigging Equipment Market Revenue Share (%), by Country 2024 & 2032
- Figure 18: South America Pipeline Pigging Equipment Market Volume Share (%), by Country 2024 & 2032
- Figure 19: North America Pipeline Pigging Equipment Market Revenue (Million), by Country 2024 & 2032
- Figure 20: North America Pipeline Pigging Equipment Market Volume (Kiloton), by Country 2024 & 2032
- Figure 21: North America Pipeline Pigging Equipment Market Revenue Share (%), by Country 2024 & 2032
- Figure 22: North America Pipeline Pigging Equipment Market Volume Share (%), by Country 2024 & 2032
- Figure 23: MEA Pipeline Pigging Equipment Market Revenue (Million), by Country 2024 & 2032
- Figure 24: MEA Pipeline Pigging Equipment Market Volume (Kiloton), by Country 2024 & 2032
- Figure 25: MEA Pipeline Pigging Equipment Market Revenue Share (%), by Country 2024 & 2032
- Figure 26: MEA Pipeline Pigging Equipment Market Volume Share (%), by Country 2024 & 2032
- Figure 27: North America Pipeline Pigging Equipment Market Revenue (Million), by Application 2024 & 2032
- Figure 28: North America Pipeline Pigging Equipment Market Volume (Kiloton), by Application 2024 & 2032
- Figure 29: North America Pipeline Pigging Equipment Market Revenue Share (%), by Application 2024 & 2032
- Figure 30: North America Pipeline Pigging Equipment Market Volume Share (%), by Application 2024 & 2032
- Figure 31: North America Pipeline Pigging Equipment Market Revenue (Million), by Products 2024 & 2032
- Figure 32: North America Pipeline Pigging Equipment Market Volume (Kiloton), by Products 2024 & 2032
- Figure 33: North America Pipeline Pigging Equipment Market Revenue Share (%), by Products 2024 & 2032
- Figure 34: North America Pipeline Pigging Equipment Market Volume Share (%), by Products 2024 & 2032
- Figure 35: North America Pipeline Pigging Equipment Market Revenue (Million), by Country 2024 & 2032
- Figure 36: North America Pipeline Pigging Equipment Market Volume (Kiloton), by Country 2024 & 2032
- Figure 37: North America Pipeline Pigging Equipment Market Revenue Share (%), by Country 2024 & 2032
- Figure 38: North America Pipeline Pigging Equipment Market Volume Share (%), by Country 2024 & 2032
- Figure 39: Europe Pipeline Pigging Equipment Market Revenue (Million), by Application 2024 & 2032
- Figure 40: Europe Pipeline Pigging Equipment Market Volume (Kiloton), by Application 2024 & 2032
- Figure 41: Europe Pipeline Pigging Equipment Market Revenue Share (%), by Application 2024 & 2032
- Figure 42: Europe Pipeline Pigging Equipment Market Volume Share (%), by Application 2024 & 2032
- Figure 43: Europe Pipeline Pigging Equipment Market Revenue (Million), by Products 2024 & 2032
- Figure 44: Europe Pipeline Pigging Equipment Market Volume (Kiloton), by Products 2024 & 2032
- Figure 45: Europe Pipeline Pigging Equipment Market Revenue Share (%), by Products 2024 & 2032
- Figure 46: Europe Pipeline Pigging Equipment Market Volume Share (%), by Products 2024 & 2032
- Figure 47: Europe Pipeline Pigging Equipment Market Revenue (Million), by Country 2024 & 2032
- Figure 48: Europe Pipeline Pigging Equipment Market Volume (Kiloton), by Country 2024 & 2032
- Figure 49: Europe Pipeline Pigging Equipment Market Revenue Share (%), by Country 2024 & 2032
- Figure 50: Europe Pipeline Pigging Equipment Market Volume Share (%), by Country 2024 & 2032
- Figure 51: Asia Pacific Pipeline Pigging Equipment Market Revenue (Million), by Application 2024 & 2032
- Figure 52: Asia Pacific Pipeline Pigging Equipment Market Volume (Kiloton), by Application 2024 & 2032
- Figure 53: Asia Pacific Pipeline Pigging Equipment Market Revenue Share (%), by Application 2024 & 2032
- Figure 54: Asia Pacific Pipeline Pigging Equipment Market Volume Share (%), by Application 2024 & 2032
- Figure 55: Asia Pacific Pipeline Pigging Equipment Market Revenue (Million), by Products 2024 & 2032
- Figure 56: Asia Pacific Pipeline Pigging Equipment Market Volume (Kiloton), by Products 2024 & 2032
- Figure 57: Asia Pacific Pipeline Pigging Equipment Market Revenue Share (%), by Products 2024 & 2032
- Figure 58: Asia Pacific Pipeline Pigging Equipment Market Volume Share (%), by Products 2024 & 2032
- Figure 59: Asia Pacific Pipeline Pigging Equipment Market Revenue (Million), by Country 2024 & 2032
- Figure 60: Asia Pacific Pipeline Pigging Equipment Market Volume (Kiloton), by Country 2024 & 2032
- Figure 61: Asia Pacific Pipeline Pigging Equipment Market Revenue Share (%), by Country 2024 & 2032
- Figure 62: Asia Pacific Pipeline Pigging Equipment Market Volume Share (%), by Country 2024 & 2032
- Figure 63: South America Pipeline Pigging Equipment Market Revenue (Million), by Application 2024 & 2032
- Figure 64: South America Pipeline Pigging Equipment Market Volume (Kiloton), by Application 2024 & 2032
- Figure 65: South America Pipeline Pigging Equipment Market Revenue Share (%), by Application 2024 & 2032
- Figure 66: South America Pipeline Pigging Equipment Market Volume Share (%), by Application 2024 & 2032
- Figure 67: South America Pipeline Pigging Equipment Market Revenue (Million), by Products 2024 & 2032
- Figure 68: South America Pipeline Pigging Equipment Market Volume (Kiloton), by Products 2024 & 2032
- Figure 69: South America Pipeline Pigging Equipment Market Revenue Share (%), by Products 2024 & 2032
- Figure 70: South America Pipeline Pigging Equipment Market Volume Share (%), by Products 2024 & 2032
- Figure 71: South America Pipeline Pigging Equipment Market Revenue (Million), by Country 2024 & 2032
- Figure 72: South America Pipeline Pigging Equipment Market Volume (Kiloton), by Country 2024 & 2032
- Figure 73: South America Pipeline Pigging Equipment Market Revenue Share (%), by Country 2024 & 2032
- Figure 74: South America Pipeline Pigging Equipment Market Volume Share (%), by Country 2024 & 2032
- Figure 75: Middle East and Africa Pipeline Pigging Equipment Market Revenue (Million), by Application 2024 & 2032
- Figure 76: Middle East and Africa Pipeline Pigging Equipment Market Volume (Kiloton), by Application 2024 & 2032
- Figure 77: Middle East and Africa Pipeline Pigging Equipment Market Revenue Share (%), by Application 2024 & 2032
- Figure 78: Middle East and Africa Pipeline Pigging Equipment Market Volume Share (%), by Application 2024 & 2032
- Figure 79: Middle East and Africa Pipeline Pigging Equipment Market Revenue (Million), by Products 2024 & 2032
- Figure 80: Middle East and Africa Pipeline Pigging Equipment Market Volume (Kiloton), by Products 2024 & 2032
- Figure 81: Middle East and Africa Pipeline Pigging Equipment Market Revenue Share (%), by Products 2024 & 2032
- Figure 82: Middle East and Africa Pipeline Pigging Equipment Market Volume Share (%), by Products 2024 & 2032
- Figure 83: Middle East and Africa Pipeline Pigging Equipment Market Revenue (Million), by Country 2024 & 2032
- Figure 84: Middle East and Africa Pipeline Pigging Equipment Market Volume (Kiloton), by Country 2024 & 2032
- Figure 85: Middle East and Africa Pipeline Pigging Equipment Market Revenue Share (%), by Country 2024 & 2032
- Figure 86: Middle East and Africa Pipeline Pigging Equipment Market Volume Share (%), by Country 2024 & 2032
List of Tables
- Table 1: Global Pipeline Pigging Equipment Market Revenue Million Forecast, by Region 2019 & 2032
- Table 2: Global Pipeline Pigging Equipment Market Volume Kiloton Forecast, by Region 2019 & 2032
- Table 3: Global Pipeline Pigging Equipment Market Revenue Million Forecast, by Application 2019 & 2032
- Table 4: Global Pipeline Pigging Equipment Market Volume Kiloton Forecast, by Application 2019 & 2032
- Table 5: Global Pipeline Pigging Equipment Market Revenue Million Forecast, by Products 2019 & 2032
- Table 6: Global Pipeline Pigging Equipment Market Volume Kiloton Forecast, by Products 2019 & 2032
- Table 7: Global Pipeline Pigging Equipment Market Revenue Million Forecast, by Region 2019 & 2032
- Table 8: Global Pipeline Pigging Equipment Market Volume Kiloton Forecast, by Region 2019 & 2032
- Table 9: Global Pipeline Pigging Equipment Market Revenue Million Forecast, by Country 2019 & 2032
- Table 10: Global Pipeline Pigging Equipment Market Volume Kiloton Forecast, by Country 2019 & 2032
- Table 11: United States Pipeline Pigging Equipment Market Revenue (Million) Forecast, by Application 2019 & 2032
- Table 12: United States Pipeline Pigging Equipment Market Volume (Kiloton) Forecast, by Application 2019 & 2032
- Table 13: Canada Pipeline Pigging Equipment Market Revenue (Million) Forecast, by Application 2019 & 2032
- Table 14: Canada Pipeline Pigging Equipment Market Volume (Kiloton) Forecast, by Application 2019 & 2032
- Table 15: Mexico Pipeline Pigging Equipment Market Revenue (Million) Forecast, by Application 2019 & 2032
- Table 16: Mexico Pipeline Pigging Equipment Market Volume (Kiloton) Forecast, by Application 2019 & 2032
- Table 17: Global Pipeline Pigging Equipment Market Revenue Million Forecast, by Country 2019 & 2032
- Table 18: Global Pipeline Pigging Equipment Market Volume Kiloton Forecast, by Country 2019 & 2032
- Table 19: Germany Pipeline Pigging Equipment Market Revenue (Million) Forecast, by Application 2019 & 2032
- Table 20: Germany Pipeline Pigging Equipment Market Volume (Kiloton) Forecast, by Application 2019 & 2032
- Table 21: United Kingdom Pipeline Pigging Equipment Market Revenue (Million) Forecast, by Application 2019 & 2032
- Table 22: United Kingdom Pipeline Pigging Equipment Market Volume (Kiloton) Forecast, by Application 2019 & 2032
- Table 23: France Pipeline Pigging Equipment Market Revenue (Million) Forecast, by Application 2019 & 2032
- Table 24: France Pipeline Pigging Equipment Market Volume (Kiloton) Forecast, by Application 2019 & 2032
- Table 25: Spain Pipeline Pigging Equipment Market Revenue (Million) Forecast, by Application 2019 & 2032
- Table 26: Spain Pipeline Pigging Equipment Market Volume (Kiloton) Forecast, by Application 2019 & 2032
- Table 27: Italy Pipeline Pigging Equipment Market Revenue (Million) Forecast, by Application 2019 & 2032
- Table 28: Italy Pipeline Pigging Equipment Market Volume (Kiloton) Forecast, by Application 2019 & 2032
- Table 29: Spain Pipeline Pigging Equipment Market Revenue (Million) Forecast, by Application 2019 & 2032
- Table 30: Spain Pipeline Pigging Equipment Market Volume (Kiloton) Forecast, by Application 2019 & 2032
- Table 31: Belgium Pipeline Pigging Equipment Market Revenue (Million) Forecast, by Application 2019 & 2032
- Table 32: Belgium Pipeline Pigging Equipment Market Volume (Kiloton) Forecast, by Application 2019 & 2032
- Table 33: Netherland Pipeline Pigging Equipment Market Revenue (Million) Forecast, by Application 2019 & 2032
- Table 34: Netherland Pipeline Pigging Equipment Market Volume (Kiloton) Forecast, by Application 2019 & 2032
- Table 35: Nordics Pipeline Pigging Equipment Market Revenue (Million) Forecast, by Application 2019 & 2032
- Table 36: Nordics Pipeline Pigging Equipment Market Volume (Kiloton) Forecast, by Application 2019 & 2032
- Table 37: Rest of Europe Pipeline Pigging Equipment Market Revenue (Million) Forecast, by Application 2019 & 2032
- Table 38: Rest of Europe Pipeline Pigging Equipment Market Volume (Kiloton) Forecast, by Application 2019 & 2032
- Table 39: Global Pipeline Pigging Equipment Market Revenue Million Forecast, by Country 2019 & 2032
- Table 40: Global Pipeline Pigging Equipment Market Volume Kiloton Forecast, by Country 2019 & 2032
- Table 41: China Pipeline Pigging Equipment Market Revenue (Million) Forecast, by Application 2019 & 2032
- Table 42: China Pipeline Pigging Equipment Market Volume (Kiloton) Forecast, by Application 2019 & 2032
- Table 43: Japan Pipeline Pigging Equipment Market Revenue (Million) Forecast, by Application 2019 & 2032
- Table 44: Japan Pipeline Pigging Equipment Market Volume (Kiloton) Forecast, by Application 2019 & 2032
- Table 45: India Pipeline Pigging Equipment Market Revenue (Million) Forecast, by Application 2019 & 2032
- Table 46: India Pipeline Pigging Equipment Market Volume (Kiloton) Forecast, by Application 2019 & 2032
- Table 47: South Korea Pipeline Pigging Equipment Market Revenue (Million) Forecast, by Application 2019 & 2032
- Table 48: South Korea Pipeline Pigging Equipment Market Volume (Kiloton) Forecast, by Application 2019 & 2032
- Table 49: Southeast Asia Pipeline Pigging Equipment Market Revenue (Million) Forecast, by Application 2019 & 2032
- Table 50: Southeast Asia Pipeline Pigging Equipment Market Volume (Kiloton) Forecast, by Application 2019 & 2032
- Table 51: Australia Pipeline Pigging Equipment Market Revenue (Million) Forecast, by Application 2019 & 2032
- Table 52: Australia Pipeline Pigging Equipment Market Volume (Kiloton) Forecast, by Application 2019 & 2032
- Table 53: Indonesia Pipeline Pigging Equipment Market Revenue (Million) Forecast, by Application 2019 & 2032
- Table 54: Indonesia Pipeline Pigging Equipment Market Volume (Kiloton) Forecast, by Application 2019 & 2032
- Table 55: Phillipes Pipeline Pigging Equipment Market Revenue (Million) Forecast, by Application 2019 & 2032
- Table 56: Phillipes Pipeline Pigging Equipment Market Volume (Kiloton) Forecast, by Application 2019 & 2032
- Table 57: Singapore Pipeline Pigging Equipment Market Revenue (Million) Forecast, by Application 2019 & 2032
- Table 58: Singapore Pipeline Pigging Equipment Market Volume (Kiloton) Forecast, by Application 2019 & 2032
- Table 59: Thailandc Pipeline Pigging Equipment Market Revenue (Million) Forecast, by Application 2019 & 2032
- Table 60: Thailandc Pipeline Pigging Equipment Market Volume (Kiloton) Forecast, by Application 2019 & 2032
- Table 61: Rest of Asia Pacific Pipeline Pigging Equipment Market Revenue (Million) Forecast, by Application 2019 & 2032
- Table 62: Rest of Asia Pacific Pipeline Pigging Equipment Market Volume (Kiloton) Forecast, by Application 2019 & 2032
- Table 63: Global Pipeline Pigging Equipment Market Revenue Million Forecast, by Country 2019 & 2032
- Table 64: Global Pipeline Pigging Equipment Market Volume Kiloton Forecast, by Country 2019 & 2032
- Table 65: Brazil Pipeline Pigging Equipment Market Revenue (Million) Forecast, by Application 2019 & 2032
- Table 66: Brazil Pipeline Pigging Equipment Market Volume (Kiloton) Forecast, by Application 2019 & 2032
- Table 67: Argentina Pipeline Pigging Equipment Market Revenue (Million) Forecast, by Application 2019 & 2032
- Table 68: Argentina Pipeline Pigging Equipment Market Volume (Kiloton) Forecast, by Application 2019 & 2032
- Table 69: Peru Pipeline Pigging Equipment Market Revenue (Million) Forecast, by Application 2019 & 2032
- Table 70: Peru Pipeline Pigging Equipment Market Volume (Kiloton) Forecast, by Application 2019 & 2032
- Table 71: Chile Pipeline Pigging Equipment Market Revenue (Million) Forecast, by Application 2019 & 2032
- Table 72: Chile Pipeline Pigging Equipment Market Volume (Kiloton) Forecast, by Application 2019 & 2032
- Table 73: Colombia Pipeline Pigging Equipment Market Revenue (Million) Forecast, by Application 2019 & 2032
- Table 74: Colombia Pipeline Pigging Equipment Market Volume (Kiloton) Forecast, by Application 2019 & 2032
- Table 75: Ecuador Pipeline Pigging Equipment Market Revenue (Million) Forecast, by Application 2019 & 2032
- Table 76: Ecuador Pipeline Pigging Equipment Market Volume (Kiloton) Forecast, by Application 2019 & 2032
- Table 77: Venezuela Pipeline Pigging Equipment Market Revenue (Million) Forecast, by Application 2019 & 2032
- Table 78: Venezuela Pipeline Pigging Equipment Market Volume (Kiloton) Forecast, by Application 2019 & 2032
- Table 79: Rest of South America Pipeline Pigging Equipment Market Revenue (Million) Forecast, by Application 2019 & 2032
- Table 80: Rest of South America Pipeline Pigging Equipment Market Volume (Kiloton) Forecast, by Application 2019 & 2032
- Table 81: Global Pipeline Pigging Equipment Market Revenue Million Forecast, by Country 2019 & 2032
- Table 82: Global Pipeline Pigging Equipment Market Volume Kiloton Forecast, by Country 2019 & 2032
- Table 83: United States Pipeline Pigging Equipment Market Revenue (Million) Forecast, by Application 2019 & 2032
- Table 84: United States Pipeline Pigging Equipment Market Volume (Kiloton) Forecast, by Application 2019 & 2032
- Table 85: Canada Pipeline Pigging Equipment Market Revenue (Million) Forecast, by Application 2019 & 2032
- Table 86: Canada Pipeline Pigging Equipment Market Volume (Kiloton) Forecast, by Application 2019 & 2032
- Table 87: Mexico Pipeline Pigging Equipment Market Revenue (Million) Forecast, by Application 2019 & 2032
- Table 88: Mexico Pipeline Pigging Equipment Market Volume (Kiloton) Forecast, by Application 2019 & 2032
- Table 89: Global Pipeline Pigging Equipment Market Revenue Million Forecast, by Country 2019 & 2032
- Table 90: Global Pipeline Pigging Equipment Market Volume Kiloton Forecast, by Country 2019 & 2032
- Table 91: United Arab Emirates Pipeline Pigging Equipment Market Revenue (Million) Forecast, by Application 2019 & 2032
- Table 92: United Arab Emirates Pipeline Pigging Equipment Market Volume (Kiloton) Forecast, by Application 2019 & 2032
- Table 93: Saudi Arabia Pipeline Pigging Equipment Market Revenue (Million) Forecast, by Application 2019 & 2032
- Table 94: Saudi Arabia Pipeline Pigging Equipment Market Volume (Kiloton) Forecast, by Application 2019 & 2032
- Table 95: South Africa Pipeline Pigging Equipment Market Revenue (Million) Forecast, by Application 2019 & 2032
- Table 96: South Africa Pipeline Pigging Equipment Market Volume (Kiloton) Forecast, by Application 2019 & 2032
- Table 97: Rest of Middle East and Africa Pipeline Pigging Equipment Market Revenue (Million) Forecast, by Application 2019 & 2032
- Table 98: Rest of Middle East and Africa Pipeline Pigging Equipment Market Volume (Kiloton) Forecast, by Application 2019 & 2032
- Table 99: Global Pipeline Pigging Equipment Market Revenue Million Forecast, by Application 2019 & 2032
- Table 100: Global Pipeline Pigging Equipment Market Volume Kiloton Forecast, by Application 2019 & 2032
- Table 101: Global Pipeline Pigging Equipment Market Revenue Million Forecast, by Products 2019 & 2032
- Table 102: Global Pipeline Pigging Equipment Market Volume Kiloton Forecast, by Products 2019 & 2032
- Table 103: Global Pipeline Pigging Equipment Market Revenue Million Forecast, by Country 2019 & 2032
- Table 104: Global Pipeline Pigging Equipment Market Volume Kiloton Forecast, by Country 2019 & 2032
- Table 105: Global Pipeline Pigging Equipment Market Revenue Million Forecast, by Application 2019 & 2032
- Table 106: Global Pipeline Pigging Equipment Market Volume Kiloton Forecast, by Application 2019 & 2032
- Table 107: Global Pipeline Pigging Equipment Market Revenue Million Forecast, by Products 2019 & 2032
- Table 108: Global Pipeline Pigging Equipment Market Volume Kiloton Forecast, by Products 2019 & 2032
- Table 109: Global Pipeline Pigging Equipment Market Revenue Million Forecast, by Country 2019 & 2032
- Table 110: Global Pipeline Pigging Equipment Market Volume Kiloton Forecast, by Country 2019 & 2032
- Table 111: Global Pipeline Pigging Equipment Market Revenue Million Forecast, by Application 2019 & 2032
- Table 112: Global Pipeline Pigging Equipment Market Volume Kiloton Forecast, by Application 2019 & 2032
- Table 113: Global Pipeline Pigging Equipment Market Revenue Million Forecast, by Products 2019 & 2032
- Table 114: Global Pipeline Pigging Equipment Market Volume Kiloton Forecast, by Products 2019 & 2032
- Table 115: Global Pipeline Pigging Equipment Market Revenue Million Forecast, by Country 2019 & 2032
- Table 116: Global Pipeline Pigging Equipment Market Volume Kiloton Forecast, by Country 2019 & 2032
- Table 117: Global Pipeline Pigging Equipment Market Revenue Million Forecast, by Application 2019 & 2032
- Table 118: Global Pipeline Pigging Equipment Market Volume Kiloton Forecast, by Application 2019 & 2032
- Table 119: Global Pipeline Pigging Equipment Market Revenue Million Forecast, by Products 2019 & 2032
- Table 120: Global Pipeline Pigging Equipment Market Volume Kiloton Forecast, by Products 2019 & 2032
- Table 121: Global Pipeline Pigging Equipment Market Revenue Million Forecast, by Country 2019 & 2032
- Table 122: Global Pipeline Pigging Equipment Market Volume Kiloton Forecast, by Country 2019 & 2032
- Table 123: Global Pipeline Pigging Equipment Market Revenue Million Forecast, by Application 2019 & 2032
- Table 124: Global Pipeline Pigging Equipment Market Volume Kiloton Forecast, by Application 2019 & 2032
- Table 125: Global Pipeline Pigging Equipment Market Revenue Million Forecast, by Products 2019 & 2032
- Table 126: Global Pipeline Pigging Equipment Market Volume Kiloton Forecast, by Products 2019 & 2032
- Table 127: Global Pipeline Pigging Equipment Market Revenue Million Forecast, by Country 2019 & 2032
- Table 128: Global Pipeline Pigging Equipment Market Volume Kiloton Forecast, by Country 2019 & 2032
Frequently Asked Questions
1. What is the projected Compound Annual Growth Rate (CAGR) of the Pipeline Pigging Equipment Market?
The projected CAGR is approximately > 5.50%.
2. Which companies are prominent players in the Pipeline Pigging Equipment Market?
Key companies in the market include Pigs Unlimited International*List Not Exhaustive, Dacon Inspection Technologies Company Limited, T D Williamson Inc, LIN SCAN Advanced Pipelines & Tanks Services, NDT Global FZE, Xylem Inc, 3P Services GmbH & Co KG, Russell NDE Systems, Baker Hughes a GE Co.
3. What are the main segments of the Pipeline Pigging Equipment Market?
The market segments include Application, Products.
4. Can you provide details about the market size?
The market size is estimated to be USD XX Million as of 2022.
5. What are some drivers contributing to market growth?
4.; The Rise in Oil and Gas Drilling Activities4.; Increased Shale Gas Exploration.
6. What are the notable trends driving market growth?
Gas Pipeline Pigging System to Dominate the Market.
7. Are there any restraints impacting market growth?
4.; Increasing Share of Renewable Energy.
8. Can you provide examples of recent developments in the market?
N/A
9. What pricing options are available for accessing the report?
Pricing options include single-user, multi-user, and enterprise licenses priced at USD 4750, USD 5250, and USD 8750 respectively.
10. Is the market size provided in terms of value or volume?
The market size is provided in terms of value, measured in Million and volume, measured in Kiloton.
11. Are there any specific market keywords associated with the report?
Yes, the market keyword associated with the report is "Pipeline Pigging Equipment Market," which aids in identifying and referencing the specific market segment covered.
12. How do I determine which pricing option suits my needs best?
The pricing options vary based on user requirements and access needs. Individual users may opt for single-user licenses, while businesses requiring broader access may choose multi-user or enterprise licenses for cost-effective access to the report.
13. Are there any additional resources or data provided in the Pipeline Pigging Equipment Market report?
While the report offers comprehensive insights, it's advisable to review the specific contents or supplementary materials provided to ascertain if additional resources or data are available.
14. How can I stay updated on further developments or reports in the Pipeline Pigging Equipment Market?
To stay informed about further developments, trends, and reports in the Pipeline Pigging Equipment Market, consider subscribing to industry newsletters, following relevant companies and organizations, or regularly checking reputable industry news sources and publications.
Methodology
Step 1 - Identification of Relevant Samples Size from Population Database


Step 2 - Approaches for Defining Global Market Size (Value, Volume* & Price*)

Note*: In applicable scenarios
Step 3 - Data Sources
Primary Research
- Web Analytics
- Survey Reports
- Research Institute
- Latest Research Reports
- Opinion Leaders
Secondary Research
- Annual Reports
- White Paper
- Latest Press Release
- Industry Association
- Paid Database
- Investor Presentations

Step 4 - Data Triangulation
Involves using different sources of information in order to increase the validity of a study
These sources are likely to be stakeholders in a program - participants, other researchers, program staff, other community members, and so on.
Then we put all data in single framework & apply various statistical tools to find out the dynamic on the market.
During the analysis stage, feedback from the stakeholder groups would be compared to determine areas of agreement as well as areas of divergence
