

Key Insights
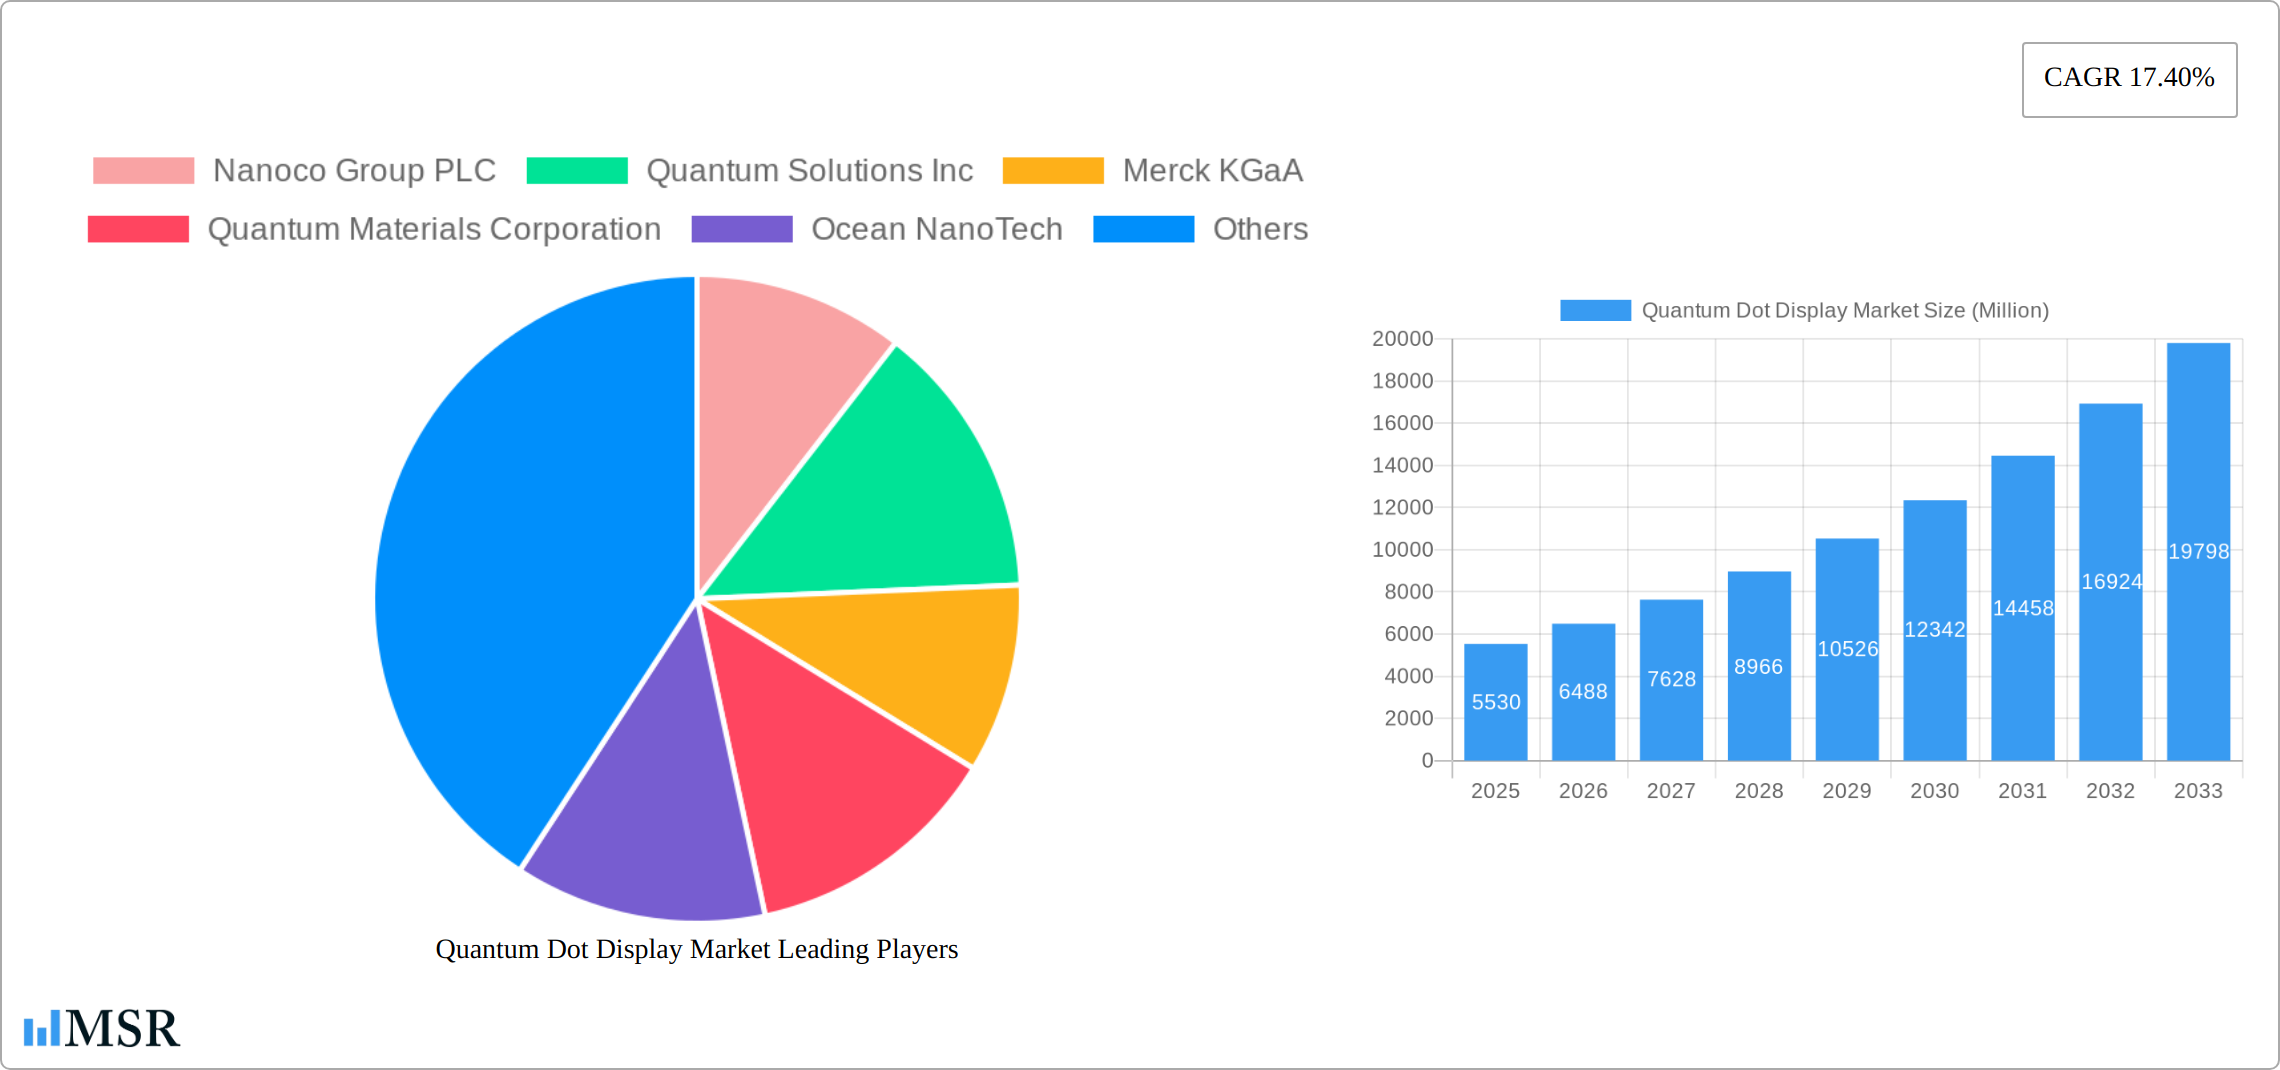
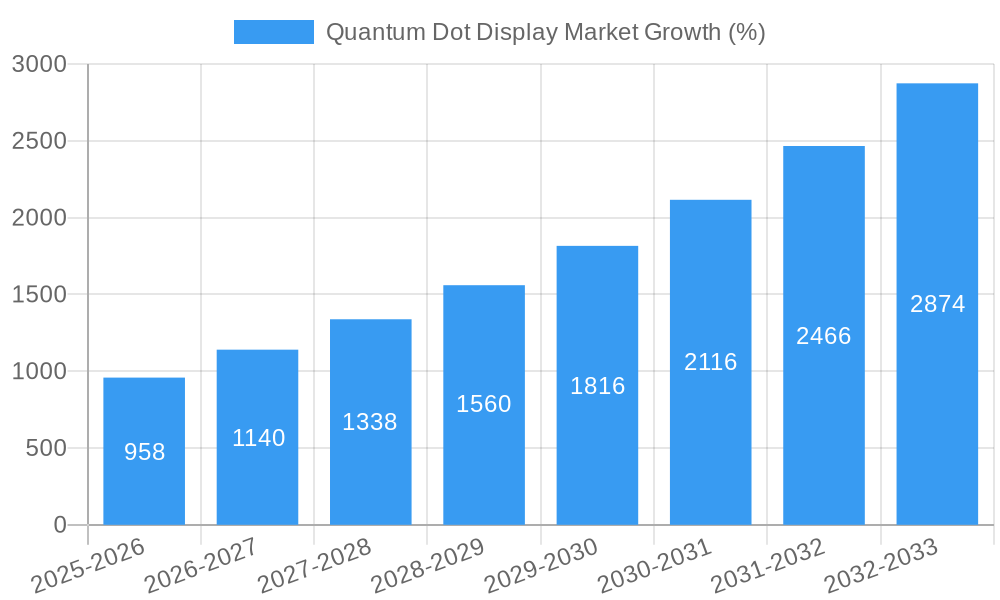
The Quantum Dot Display market is experiencing robust growth, projected to reach $5.53 billion in 2025 and maintain a Compound Annual Growth Rate (CAGR) of 17.40% from 2025 to 2033. This expansion is driven by several key factors. Firstly, the increasing demand for high-resolution, vibrant displays in consumer electronics like smartphones, televisions, and monitors fuels significant market expansion. Advances in quantum dot technology, leading to improved color gamut, brightness, and energy efficiency, further stimulate adoption. The penetration of quantum dots into various applications beyond displays, such as optoelectronics, medical imaging, and agriculture (for advanced sensing and lighting), contributes to the market's overall growth trajectory. Competition among major players like Nanoco Group PLC, Quantum Materials Corporation, and Merck KGaA is driving innovation and price reductions, making quantum dot technology more accessible.
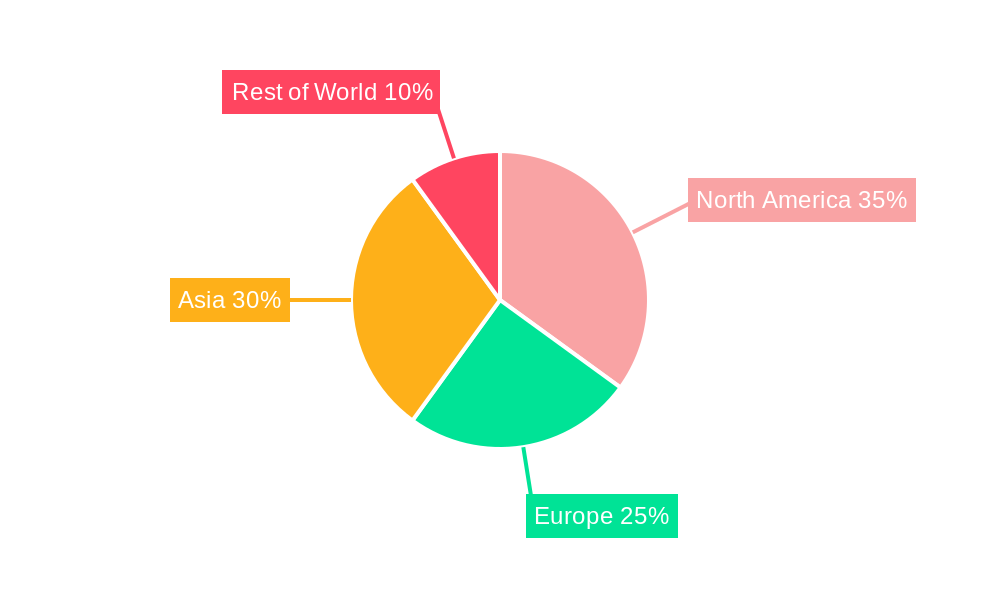
However, the market faces certain restraints. High initial manufacturing costs and the complex synthesis process of quantum dots can limit widespread adoption, particularly in budget-conscious segments. Furthermore, concerns surrounding the long-term environmental impact of quantum dot production and disposal require addressing to ensure sustainable market development. Nevertheless, ongoing research and development efforts focused on cost reduction and environmentally friendly production methods are expected to mitigate these challenges. Regional analysis suggests North America and Asia (particularly China) will be key markets, driven by strong consumer demand and significant manufacturing investments. The segmentation by type (III-V, II-VI, Silicon) and application highlights the versatility of quantum dots, creating opportunities across diverse sectors. The forecast period of 2025-2033 offers promising prospects for continued market expansion and technological advancement within this dynamic industry.
Quantum Dot Display Market: A Comprehensive Report (2019-2033)
This comprehensive report provides an in-depth analysis of the Quantum Dot Display Market, offering valuable insights for industry stakeholders. With a study period spanning 2019-2033, a base year of 2025, and a forecast period of 2025-2033, this report meticulously examines market dynamics, technological advancements, and emerging opportunities. The report covers key market segments including by type (III-V-Semiconductors, II-VI-Semiconductors, Silicon (Si)) and by application (Optoelectronics and Optical Components, Medicine, Agriculture, Alternative Energy, Other Applications), providing a granular understanding of the current landscape and future trajectory. The market size in 2025 is estimated to be xx Million and is projected to reach xx Million by 2033, exhibiting a CAGR of xx%.
Quantum Dot Display Market Market Concentration & Dynamics
The Quantum Dot Display market exhibits a moderately concentrated landscape, with a handful of key players controlling a significant market share. However, the presence of numerous smaller, innovative companies indicates a dynamic competitive environment. Market share data for 2024 reveals that the top 5 players hold approximately xx% of the global market, while the remaining share is distributed among numerous smaller participants. Innovation ecosystems are thriving, particularly around materials science and device manufacturing. Regulatory frameworks, while evolving, generally favor technological advancements in display technology. Substitute products, such as OLEDs, pose significant competition. End-user trends are shifting towards higher resolution, brighter, and more energy-efficient displays, fueling demand for quantum dot technology. M&A activity in the sector has been moderate in recent years, with approximately xx deals recorded between 2019 and 2024, mainly focusing on strategic partnerships and technology acquisitions.
- Market Concentration: Moderately concentrated, with top 5 players holding approximately xx% market share (2024).
- Innovation Ecosystems: Robust, driven by advancements in materials science and device engineering.
- Regulatory Frameworks: Generally supportive of technological progress.
- Substitute Products: OLEDs present a key competitive threat.
- End-User Trends: Demand for higher resolution, brighter, and energy-efficient displays is rising.
- M&A Activity: Approximately xx deals between 2019 and 2024.
Quantum Dot Display Market Industry Insights & Trends
The Quantum Dot Display market is experiencing robust growth, driven by several key factors. The increasing demand for high-quality displays in consumer electronics, particularly smartphones, televisions, and monitors, is a significant driver. Technological advancements leading to improved performance metrics, including color gamut, brightness, and energy efficiency, are further fueling market expansion. Evolving consumer preferences toward larger, higher-resolution displays are also impacting market dynamics. However, challenges like the cost of production and the potential for long-term stability issues are restraining market growth. Overall, the market is expected to witness a substantial surge in the coming years, driven by technological advancements and increased consumer demand. The market size is projected to reach xx Million by 2033, from xx Million in 2025, showcasing considerable growth potential.
Key Markets & Segments Leading Quantum Dot Display Market
The Optoelectronics and Optical Components segment dominates the application landscape, driven by the significant use of quantum dots in displays. Within the type segment, II-VI-Semiconductors currently holds a larger market share due to their established production capabilities and relatively lower cost compared to III-V counterparts. However, ongoing research and development efforts focus on improving the efficiency and cost-effectiveness of III-V-Semiconductors. The Asia-Pacific region is currently the leading market for Quantum Dot Displays, driven by significant growth in consumer electronics and display manufacturing hubs in countries like China, South Korea, and Japan.
- Dominant Region: Asia-Pacific
- Dominant Segment (By Application): Optoelectronics and Optical Components
- Dominant Segment (By Type): II-VI-Semiconductors
Drivers for Asia-Pacific Dominance:
- Rapid economic growth and increasing disposable incomes.
- Large and expanding consumer electronics market.
- Presence of major display manufacturing facilities.
- Government support for technological advancements.
Quantum Dot Display Market Product Developments
Recent years have witnessed significant advancements in quantum dot display technology. Improvements in materials synthesis have led to enhanced color purity and brightness, while advancements in device architectures have improved energy efficiency. The integration of quantum dots with other display technologies, such as LCD and OLED, has expanded application possibilities. These technological advancements have created significant competitive advantages for companies able to deliver higher-performance displays at competitive costs.
Challenges in the Quantum Dot Display Market Market
The Quantum Dot Display market faces several challenges including high production costs, the need for specialized equipment and expertise, and the potential for long-term stability issues. Stringent regulatory requirements related to toxicity and environmental impact also pose challenges. Furthermore, the competitive landscape, with established players like OLED manufacturers, presents intense competition. These hurdles could impact market growth in the medium to long term unless effectively addressed.
Forces Driving Quantum Dot Display Market Growth
Technological advancements in materials synthesis and display design are key drivers. The increasing demand for higher-resolution, energy-efficient displays in consumer electronics, such as smartphones and televisions, fuels market expansion. Favorable regulatory environments supporting the adoption of environmentally friendly display technologies also contribute. For example, government incentives for green technology adoption in various regions accelerate growth.
Challenges in the Quantum Dot Display Market Market
Long-term growth catalysts include ongoing research and development efforts focusing on improving cost-effectiveness and long-term stability. Strategic partnerships between materials suppliers and display manufacturers are facilitating the integration of quantum dots into a wider range of products. Expansion into emerging markets and applications, such as augmented reality and virtual reality displays, promises future growth opportunities.
Emerging Opportunities in Quantum Dot Display Market
Emerging opportunities lie in the development of high-performance displays for applications beyond consumer electronics, such as medical imaging and automotive displays. The growing demand for sustainable and environmentally friendly technologies presents significant opportunities for quantum dots, especially given their potential for improved energy efficiency compared to traditional displays. Furthermore, advancements in material synthesis could lead to cost reductions, opening up new market segments.
Leading Players in the Quantum Dot Display Market Sector
- Nanoco Group PLC
- Quantum Solutions Inc
- Merck KGaA
- Quantum Materials Corporation
- Ocean NanoTech
- Thermo Fisher Scientific Inc
- NnCrystal US Corporation (NN-Labs)
- UbiQD Inc
- Nanosys Inc (Shoei Electronic Materials Inc)
- NanoOptical Materials Inc
Key Milestones in Quantum Dot Display Market Industry
- November 2023: UbiQD Inc. launched UbiGro Cover, advancing sustainable agriculture solutions.
- January 2024: Quantum Solutions Inc. released QDot Perovskite CsPbBr3 Single Crystals for X-ray sensors in collaboration with AY Sensors.
Strategic Outlook for Quantum Dot Display Market Market
The Quantum Dot Display market is poised for significant growth in the coming years. Continued technological advancements, cost reductions, and expansion into new applications will be critical to unlocking its full potential. Strategic partnerships and collaborations will be vital in navigating the competitive landscape and accelerating market penetration. Companies that can effectively address challenges related to cost, stability, and regulatory compliance are best positioned to capitalize on the substantial opportunities within this rapidly evolving sector.
Quantum Dot Display Market Segmentation
-
1. Type
- 1.1. III-V-Semiconductors
- 1.2. II-VI-Semiconductors
- 1.3. Silicon (Si)
-
2. Application
- 2.1. Optoelectronics and Optical Components
- 2.2. Medicine
- 2.3. Agriculture
- 2.4. Alternative Energy
- 2.5. Other Applications
Quantum Dot Display Market Segmentation By Geography
-
1. North America
- 1.1. United States
- 1.2. Canada
-
2. Europe
- 2.1. United Kingdom
- 2.2. Germany
- 2.3. France
-
3. Asia
- 3.1. China
- 3.2. Japan
- 3.3. India
- 3.4. Australia and New Zealand
Quantum Dot Display Market REPORT HIGHLIGHTS
| Aspects | Details |
|---|---|
| Study Period | 2019-2033 |
| Base Year | 2024 |
| Estimated Year | 2025 |
| Forecast Period | 2025-2033 |
| Historical Period | 2019-2024 |
| Growth Rate | CAGR of 17.40% from 2019-2033 |
| Segmentation |
|
Table of Contents
- 1. Introduction
- 1.1. Research Scope
- 1.2. Market Segmentation
- 1.3. Research Methodology
- 1.4. Definitions and Assumptions
- 2. Executive Summary
- 2.1. Introduction
- 3. Market Dynamics
- 3.1. Introduction
- 3.2. Market Drivers
- 3.2.1. Increasing Demand for Quantum Dots in High-Quality Display Devices; Growing Demand for Energy-efficient Solutions
- 3.3. Market Restrains
- 3.3.1. Complexity Associated with the 3D Electronics and Limited Material Selection
- 3.4. Market Trends
- 3.4.1. Optoelectronics and Optical Components to Witness Significant Growth
- 4. Market Factor Analysis
- 4.1. Porters Five Forces
- 4.2. Supply/Value Chain
- 4.3. PESTEL analysis
- 4.4. Market Entropy
- 4.5. Patent/Trademark Analysis
- 5. Global Quantum Dot Display Market Analysis, Insights and Forecast, 2019-2031
- 5.1. Market Analysis, Insights and Forecast - by Type
- 5.1.1. III-V-Semiconductors
- 5.1.2. II-VI-Semiconductors
- 5.1.3. Silicon (Si)
- 5.2. Market Analysis, Insights and Forecast - by Application
- 5.2.1. Optoelectronics and Optical Components
- 5.2.2. Medicine
- 5.2.3. Agriculture
- 5.2.4. Alternative Energy
- 5.2.5. Other Applications
- 5.3. Market Analysis, Insights and Forecast - by Region
- 5.3.1. North America
- 5.3.2. Europe
- 5.3.3. Asia
- 5.1. Market Analysis, Insights and Forecast - by Type
- 6. North America Quantum Dot Display Market Analysis, Insights and Forecast, 2019-2031
- 6.1. Market Analysis, Insights and Forecast - by Type
- 6.1.1. III-V-Semiconductors
- 6.1.2. II-VI-Semiconductors
- 6.1.3. Silicon (Si)
- 6.2. Market Analysis, Insights and Forecast - by Application
- 6.2.1. Optoelectronics and Optical Components
- 6.2.2. Medicine
- 6.2.3. Agriculture
- 6.2.4. Alternative Energy
- 6.2.5. Other Applications
- 6.1. Market Analysis, Insights and Forecast - by Type
- 7. Europe Quantum Dot Display Market Analysis, Insights and Forecast, 2019-2031
- 7.1. Market Analysis, Insights and Forecast - by Type
- 7.1.1. III-V-Semiconductors
- 7.1.2. II-VI-Semiconductors
- 7.1.3. Silicon (Si)
- 7.2. Market Analysis, Insights and Forecast - by Application
- 7.2.1. Optoelectronics and Optical Components
- 7.2.2. Medicine
- 7.2.3. Agriculture
- 7.2.4. Alternative Energy
- 7.2.5. Other Applications
- 7.1. Market Analysis, Insights and Forecast - by Type
- 8. Asia Quantum Dot Display Market Analysis, Insights and Forecast, 2019-2031
- 8.1. Market Analysis, Insights and Forecast - by Type
- 8.1.1. III-V-Semiconductors
- 8.1.2. II-VI-Semiconductors
- 8.1.3. Silicon (Si)
- 8.2. Market Analysis, Insights and Forecast - by Application
- 8.2.1. Optoelectronics and Optical Components
- 8.2.2. Medicine
- 8.2.3. Agriculture
- 8.2.4. Alternative Energy
- 8.2.5. Other Applications
- 8.1. Market Analysis, Insights and Forecast - by Type
- 9. North America Quantum Dot Display Market Analysis, Insights and Forecast, 2019-2031
- 9.1. Market Analysis, Insights and Forecast - By Country/Sub-region
- 9.1.1 United States
- 9.1.2 Canada
- 10. Europe Quantum Dot Display Market Analysis, Insights and Forecast, 2019-2031
- 10.1. Market Analysis, Insights and Forecast - By Country/Sub-region
- 10.1.1 United Kingdom
- 10.1.2 Germany
- 10.1.3 France
- 11. Asia Quantum Dot Display Market Analysis, Insights and Forecast, 2019-2031
- 11.1. Market Analysis, Insights and Forecast - By Country/Sub-region
- 11.1.1 China
- 11.1.2 Japan
- 11.1.3 India
- 11.1.4 Australia and New Zealand
- 12. Competitive Analysis
- 12.1. Global Market Share Analysis 2024
- 12.2. Company Profiles
- 12.2.1 Nanoco Group PLC
- 12.2.1.1. Overview
- 12.2.1.2. Products
- 12.2.1.3. SWOT Analysis
- 12.2.1.4. Recent Developments
- 12.2.1.5. Financials (Based on Availability)
- 12.2.2 Quantum Solutions Inc
- 12.2.2.1. Overview
- 12.2.2.2. Products
- 12.2.2.3. SWOT Analysis
- 12.2.2.4. Recent Developments
- 12.2.2.5. Financials (Based on Availability)
- 12.2.3 Merck KGaA
- 12.2.3.1. Overview
- 12.2.3.2. Products
- 12.2.3.3. SWOT Analysis
- 12.2.3.4. Recent Developments
- 12.2.3.5. Financials (Based on Availability)
- 12.2.4 Quantum Materials Corporation
- 12.2.4.1. Overview
- 12.2.4.2. Products
- 12.2.4.3. SWOT Analysis
- 12.2.4.4. Recent Developments
- 12.2.4.5. Financials (Based on Availability)
- 12.2.5 Ocean NanoTech
- 12.2.5.1. Overview
- 12.2.5.2. Products
- 12.2.5.3. SWOT Analysis
- 12.2.5.4. Recent Developments
- 12.2.5.5. Financials (Based on Availability)
- 12.2.6 Thermo Fisher Scientific Inc
- 12.2.6.1. Overview
- 12.2.6.2. Products
- 12.2.6.3. SWOT Analysis
- 12.2.6.4. Recent Developments
- 12.2.6.5. Financials (Based on Availability)
- 12.2.7 NnCrystal US Corporation (NN-Labs)
- 12.2.7.1. Overview
- 12.2.7.2. Products
- 12.2.7.3. SWOT Analysis
- 12.2.7.4. Recent Developments
- 12.2.7.5. Financials (Based on Availability)
- 12.2.8 UbiQD Inc
- 12.2.8.1. Overview
- 12.2.8.2. Products
- 12.2.8.3. SWOT Analysis
- 12.2.8.4. Recent Developments
- 12.2.8.5. Financials (Based on Availability)
- 12.2.9 Nanosys Inc (Shoei Electronic Materials Inc)
- 12.2.9.1. Overview
- 12.2.9.2. Products
- 12.2.9.3. SWOT Analysis
- 12.2.9.4. Recent Developments
- 12.2.9.5. Financials (Based on Availability)
- 12.2.10 NanoOptical Materials Inc
- 12.2.10.1. Overview
- 12.2.10.2. Products
- 12.2.10.3. SWOT Analysis
- 12.2.10.4. Recent Developments
- 12.2.10.5. Financials (Based on Availability)
- 12.2.1 Nanoco Group PLC
List of Figures
- Figure 1: Global Quantum Dot Display Market Revenue Breakdown (Million, %) by Region 2024 & 2032
- Figure 2: North America Quantum Dot Display Market Revenue (Million), by Country 2024 & 2032
- Figure 3: North America Quantum Dot Display Market Revenue Share (%), by Country 2024 & 2032
- Figure 4: Europe Quantum Dot Display Market Revenue (Million), by Country 2024 & 2032
- Figure 5: Europe Quantum Dot Display Market Revenue Share (%), by Country 2024 & 2032
- Figure 6: Asia Quantum Dot Display Market Revenue (Million), by Country 2024 & 2032
- Figure 7: Asia Quantum Dot Display Market Revenue Share (%), by Country 2024 & 2032
- Figure 8: North America Quantum Dot Display Market Revenue (Million), by Type 2024 & 2032
- Figure 9: North America Quantum Dot Display Market Revenue Share (%), by Type 2024 & 2032
- Figure 10: North America Quantum Dot Display Market Revenue (Million), by Application 2024 & 2032
- Figure 11: North America Quantum Dot Display Market Revenue Share (%), by Application 2024 & 2032
- Figure 12: North America Quantum Dot Display Market Revenue (Million), by Country 2024 & 2032
- Figure 13: North America Quantum Dot Display Market Revenue Share (%), by Country 2024 & 2032
- Figure 14: Europe Quantum Dot Display Market Revenue (Million), by Type 2024 & 2032
- Figure 15: Europe Quantum Dot Display Market Revenue Share (%), by Type 2024 & 2032
- Figure 16: Europe Quantum Dot Display Market Revenue (Million), by Application 2024 & 2032
- Figure 17: Europe Quantum Dot Display Market Revenue Share (%), by Application 2024 & 2032
- Figure 18: Europe Quantum Dot Display Market Revenue (Million), by Country 2024 & 2032
- Figure 19: Europe Quantum Dot Display Market Revenue Share (%), by Country 2024 & 2032
- Figure 20: Asia Quantum Dot Display Market Revenue (Million), by Type 2024 & 2032
- Figure 21: Asia Quantum Dot Display Market Revenue Share (%), by Type 2024 & 2032
- Figure 22: Asia Quantum Dot Display Market Revenue (Million), by Application 2024 & 2032
- Figure 23: Asia Quantum Dot Display Market Revenue Share (%), by Application 2024 & 2032
- Figure 24: Asia Quantum Dot Display Market Revenue (Million), by Country 2024 & 2032
- Figure 25: Asia Quantum Dot Display Market Revenue Share (%), by Country 2024 & 2032
List of Tables
- Table 1: Global Quantum Dot Display Market Revenue Million Forecast, by Region 2019 & 2032
- Table 2: Global Quantum Dot Display Market Revenue Million Forecast, by Type 2019 & 2032
- Table 3: Global Quantum Dot Display Market Revenue Million Forecast, by Application 2019 & 2032
- Table 4: Global Quantum Dot Display Market Revenue Million Forecast, by Region 2019 & 2032
- Table 5: Global Quantum Dot Display Market Revenue Million Forecast, by Country 2019 & 2032
- Table 6: United States Quantum Dot Display Market Revenue (Million) Forecast, by Application 2019 & 2032
- Table 7: Canada Quantum Dot Display Market Revenue (Million) Forecast, by Application 2019 & 2032
- Table 8: Global Quantum Dot Display Market Revenue Million Forecast, by Country 2019 & 2032
- Table 9: United Kingdom Quantum Dot Display Market Revenue (Million) Forecast, by Application 2019 & 2032
- Table 10: Germany Quantum Dot Display Market Revenue (Million) Forecast, by Application 2019 & 2032
- Table 11: France Quantum Dot Display Market Revenue (Million) Forecast, by Application 2019 & 2032
- Table 12: Global Quantum Dot Display Market Revenue Million Forecast, by Country 2019 & 2032
- Table 13: China Quantum Dot Display Market Revenue (Million) Forecast, by Application 2019 & 2032
- Table 14: Japan Quantum Dot Display Market Revenue (Million) Forecast, by Application 2019 & 2032
- Table 15: India Quantum Dot Display Market Revenue (Million) Forecast, by Application 2019 & 2032
- Table 16: Australia and New Zealand Quantum Dot Display Market Revenue (Million) Forecast, by Application 2019 & 2032
- Table 17: Global Quantum Dot Display Market Revenue Million Forecast, by Type 2019 & 2032
- Table 18: Global Quantum Dot Display Market Revenue Million Forecast, by Application 2019 & 2032
- Table 19: Global Quantum Dot Display Market Revenue Million Forecast, by Country 2019 & 2032
- Table 20: United States Quantum Dot Display Market Revenue (Million) Forecast, by Application 2019 & 2032
- Table 21: Canada Quantum Dot Display Market Revenue (Million) Forecast, by Application 2019 & 2032
- Table 22: Global Quantum Dot Display Market Revenue Million Forecast, by Type 2019 & 2032
- Table 23: Global Quantum Dot Display Market Revenue Million Forecast, by Application 2019 & 2032
- Table 24: Global Quantum Dot Display Market Revenue Million Forecast, by Country 2019 & 2032
- Table 25: United Kingdom Quantum Dot Display Market Revenue (Million) Forecast, by Application 2019 & 2032
- Table 26: Germany Quantum Dot Display Market Revenue (Million) Forecast, by Application 2019 & 2032
- Table 27: France Quantum Dot Display Market Revenue (Million) Forecast, by Application 2019 & 2032
- Table 28: Global Quantum Dot Display Market Revenue Million Forecast, by Type 2019 & 2032
- Table 29: Global Quantum Dot Display Market Revenue Million Forecast, by Application 2019 & 2032
- Table 30: Global Quantum Dot Display Market Revenue Million Forecast, by Country 2019 & 2032
- Table 31: China Quantum Dot Display Market Revenue (Million) Forecast, by Application 2019 & 2032
- Table 32: Japan Quantum Dot Display Market Revenue (Million) Forecast, by Application 2019 & 2032
- Table 33: India Quantum Dot Display Market Revenue (Million) Forecast, by Application 2019 & 2032
- Table 34: Australia and New Zealand Quantum Dot Display Market Revenue (Million) Forecast, by Application 2019 & 2032
Frequently Asked Questions
1. What is the projected Compound Annual Growth Rate (CAGR) of the Quantum Dot Display Market?
The projected CAGR is approximately 17.40%.
2. Which companies are prominent players in the Quantum Dot Display Market?
Key companies in the market include Nanoco Group PLC, Quantum Solutions Inc, Merck KGaA, Quantum Materials Corporation, Ocean NanoTech, Thermo Fisher Scientific Inc, NnCrystal US Corporation (NN-Labs), UbiQD Inc, Nanosys Inc (Shoei Electronic Materials Inc), NanoOptical Materials Inc.
3. What are the main segments of the Quantum Dot Display Market?
The market segments include Type, Application.
4. Can you provide details about the market size?
The market size is estimated to be USD 5.53 Million as of 2022.
5. What are some drivers contributing to market growth?
Increasing Demand for Quantum Dots in High-Quality Display Devices; Growing Demand for Energy-efficient Solutions.
6. What are the notable trends driving market growth?
Optoelectronics and Optical Components to Witness Significant Growth.
7. Are there any restraints impacting market growth?
Complexity Associated with the 3D Electronics and Limited Material Selection.
8. Can you provide examples of recent developments in the market?
January 2024 - Quantum Solutions announced the release of QDot Perovskite CsPbBr3 Single Crystals for X-ray sensors. The product is released in collaboration with AY Sensors. This material is a significant alternative to CdTe and CdZnTe (CZT) crystals used in direct X-ray sensors. CsPbBr3 single crystals are regarded as the most favorable perovskite composition for X-ray sensors in terms of performance and long-term stability.
9. What pricing options are available for accessing the report?
Pricing options include single-user, multi-user, and enterprise licenses priced at USD 4750, USD 5250, and USD 8750 respectively.
10. Is the market size provided in terms of value or volume?
The market size is provided in terms of value, measured in Million.
11. Are there any specific market keywords associated with the report?
Yes, the market keyword associated with the report is "Quantum Dot Display Market," which aids in identifying and referencing the specific market segment covered.
12. How do I determine which pricing option suits my needs best?
The pricing options vary based on user requirements and access needs. Individual users may opt for single-user licenses, while businesses requiring broader access may choose multi-user or enterprise licenses for cost-effective access to the report.
13. Are there any additional resources or data provided in the Quantum Dot Display Market report?
While the report offers comprehensive insights, it's advisable to review the specific contents or supplementary materials provided to ascertain if additional resources or data are available.
14. How can I stay updated on further developments or reports in the Quantum Dot Display Market?
To stay informed about further developments, trends, and reports in the Quantum Dot Display Market, consider subscribing to industry newsletters, following relevant companies and organizations, or regularly checking reputable industry news sources and publications.
Methodology
Step 1 - Identification of Relevant Samples Size from Population Database


Step 2 - Approaches for Defining Global Market Size (Value, Volume* & Price*)

Note*: In applicable scenarios
Step 3 - Data Sources
Primary Research
- Web Analytics
- Survey Reports
- Research Institute
- Latest Research Reports
- Opinion Leaders
Secondary Research
- Annual Reports
- White Paper
- Latest Press Release
- Industry Association
- Paid Database
- Investor Presentations

Step 4 - Data Triangulation
Involves using different sources of information in order to increase the validity of a study
These sources are likely to be stakeholders in a program - participants, other researchers, program staff, other community members, and so on.
Then we put all data in single framework & apply various statistical tools to find out the dynamic on the market.
During the analysis stage, feedback from the stakeholder groups would be compared to determine areas of agreement as well as areas of divergence
