

Key Insights
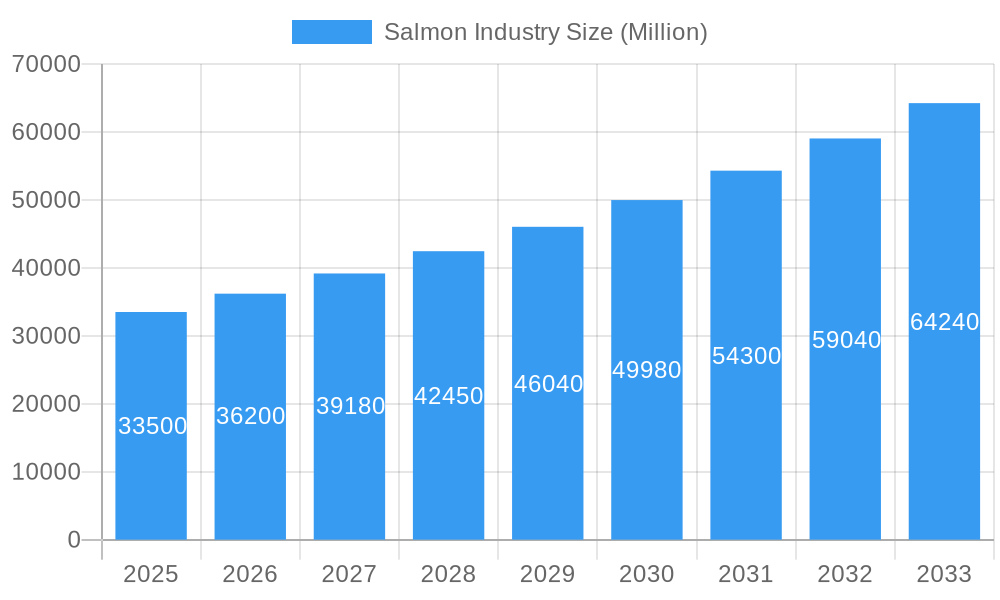
The global salmon industry, valued at $33.5 billion in 2025, is projected to experience robust growth, driven by increasing consumer demand for healthy protein sources and the rising popularity of sushi and other salmon-based dishes. The industry's Compound Annual Growth Rate (CAGR) of 8.07% from 2025 to 2033 indicates a significant expansion, reaching an estimated value exceeding $65 billion by 2033. This growth is fueled by several factors, including advancements in aquaculture techniques leading to increased farmed salmon production, a growing global middle class with increased disposable income, and strategic marketing efforts emphasizing the health benefits of salmon consumption. However, challenges such as fluctuating feed prices, environmental concerns surrounding aquaculture practices (e.g., sea lice infestations, escapes), and disease outbreaks present potential restraints. Market segmentation reveals a strong preference for farmed salmon, particularly Atlantic Salmon, representing the largest share of the market, although wild-caught salmon maintains a significant niche market, particularly among consumers seeking premium quality and sustainability. Geographic distribution shows that North America and Europe dominate the market, with strong growth projected in the Asia-Pacific region due to rising seafood consumption in China and Japan.
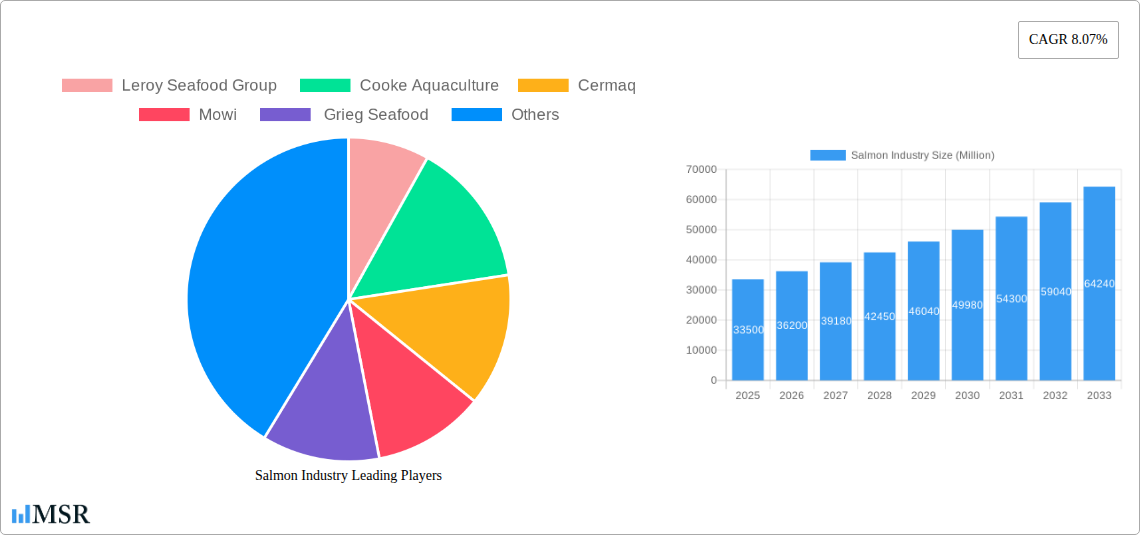
Salmon Industry Market Size (In Billion)
The competitive landscape features major players like Leroy Seafood Group, Cooke Aquaculture, Cermaq, Mowi, and Grieg Seafood, engaging in continuous innovation to enhance production efficiency and sustainability initiatives. These companies are increasingly focusing on traceability and branding to cater to consumer preference for transparency and environmentally responsible seafood. Future industry trends suggest a growing focus on sustainable aquaculture practices, including reducing the environmental footprint of salmon farming, the development of alternative feed sources to reduce reliance on wild-caught fish, and the implementation of stricter regulations to ensure food safety and traceability. The industry's future success hinges on its ability to address these challenges effectively while capitalizing on the growing global demand for high-quality salmon. Further diversification into different salmon species and value-added products will also play a significant role in shaping the industry's trajectory in the coming years.
Salmon Industry Company Market Share
Unlock the Potential of the Global Salmon Industry: A Comprehensive Market Report (2019-2033)
This in-depth report provides a comprehensive analysis of the global salmon industry, encompassing market dynamics, key trends, leading players, and future growth prospects. Covering the period from 2019 to 2033, with a base year of 2025, this report is essential for industry stakeholders, investors, and anyone seeking to understand this dynamic market. The report projects a market value exceeding $xx Million by 2033, driven by factors detailed within.
Salmon Industry Market Concentration & Dynamics
The global salmon market exhibits moderate concentration, with major players like Mowi, Leroy Seafood Group, Cooke Aquaculture, Cermaq, and Grieg Seafood holding significant market share. However, the presence of numerous smaller players, particularly in wild-caught segments, prevents complete domination by a few. The industry is characterized by a complex interplay of factors:
- Market Share: Mowi holds an estimated xx% market share in 2025, followed by Leroy Seafood Group at xx%, Cooke Aquaculture at xx%, Cermaq at xx%, and Grieg Seafood at xx%. Smaller players account for the remaining share.
- Innovation Ecosystems: Significant investment in sustainable farming practices, selective breeding, and disease prevention technologies is driving innovation.
- Regulatory Frameworks: Stringent regulations concerning aquaculture practices, environmental impact, and food safety influence industry operations significantly. Variations across regions lead to complexities in navigating regulatory compliance.
- Substitute Products: Other seafood species, such as tuna and trout, offer competitive pressure. Plant-based alternatives are emerging, but currently represent a minor threat.
- End-User Trends: Growing consumer demand for healthy and sustainable protein sources fuels industry growth. Demand for traceability and transparency continues to increase.
- M&A Activities: The historical period (2019-2024) saw xx major M&A deals, primarily focused on consolidating market share and expanding geographical reach. The forecast period (2025-2033) anticipates a similar pace of consolidation, although potentially with a focus on technology acquisitions.
Salmon Industry Industry Insights & Trends
The global salmon market is experiencing robust and dynamic growth, underpinned by a confluence of powerful driving forces. The market size, projected to reach approximately $XX Million by 2025, is anticipated to expand at an impressive Compound Annual Growth Rate (CAGR) of XX% between 2025 and 2033. This significant upward trajectory is propelled by several key factors:
- Surging Global Demand: A notable increase in per capita seafood consumption, particularly within rapidly developing economies, is a primary catalyst for escalating demand for salmon.
- Heightened Health and Wellness Consciousness: Consumers are increasingly prioritizing their health, recognizing salmon as a powerhouse of essential nutrients and health benefits. This awareness is translating into consistent and strong purchasing behavior.
- Advancements in Sustainable Aquaculture: Continuous improvements in aquaculture technologies, coupled with a steadfast commitment to environmental stewardship and sustainable practices, are significantly enhancing the ecological footprint and appeal of farmed salmon.
- Pioneering Technological Innovations: Breakthroughs in areas such as advanced fish feed formulations, sophisticated breeding techniques, and proactive disease management are collectively contributing to enhanced operational efficiency, higher yields, and improved product quality.
- Evolving Consumer Preferences: The modern consumer increasingly seeks convenience. This shift is evident in the growing preference for ready-to-eat and value-added salmon products. Furthermore, transparency regarding traceability and the origin of seafood is becoming paramount to consumer purchasing decisions.
Key Markets & Segments Leading Salmon Industry
The Atlantic Salmon segment dominates the market, accounting for approximately xx% of total volume in 2025. Norway and Chile remain leading producers of farmed Atlantic Salmon.
- Dominant Regions/Countries: Norway holds a substantial share of global salmon production, benefiting from favorable environmental conditions and established aquaculture infrastructure. Chile also plays a significant role, supported by its robust aquaculture sector.
- Dominant Segment - Type: Farmed salmon accounts for the vast majority (xx%) of the market, owing to its higher production capacity and lower cost compared to wild-caught salmon.
- Dominant Segment - Species Type: Atlantic Salmon maintains a dominant position due to high consumer acceptance and widespread farming practices.
- Drivers:
- Economic Growth: Rising disposable incomes in key markets drive seafood consumption.
- Infrastructure Development: Investment in aquaculture infrastructure and logistics enhances production and distribution efficiency.
- Government Support: Government policies and subsidies supporting aquaculture development contribute to market growth.
The wild-caught segment, while smaller, caters to a niche market that values specific qualities and sustainability certifications. Other species types are experiencing niche growth, driven by regional preferences and diversification efforts.
Salmon Industry Product Developments
Recent product innovations center around convenience, value-added products (e.g., pre-portioned packs, marinated salmon), and ready-to-cook options. Technological advancements in feed formulations are improving fish health, growth rates, and overall product quality. The market increasingly prioritizes sustainably sourced salmon and transparent supply chains.
Challenges in the Salmon Industry Market
The industry faces several challenges, including:
- Regulatory Hurdles: Complex and varying regulations across regions can increase operational costs and create compliance difficulties.
- Supply Chain Issues: Maintaining a stable and reliable supply chain can be challenging, particularly during periods of high demand or unforeseen events (e.g., disease outbreaks).
- Competitive Pressures: Competition from other seafood products and emerging plant-based alternatives poses ongoing pressure.
- Environmental Concerns: Growing concerns about the environmental impact of aquaculture necessitate continuous improvements in sustainability practices.
Forces Driving Salmon Industry Growth
The robust expansion of the salmon industry is being propelled by a set of interconnected and impactful growth drivers:
- Technological Advancements: Ongoing innovations in feed technology, precision in selective breeding, and sophisticated disease control strategies are not only boosting productivity but also reinforcing the sustainability of salmon farming operations.
- Favorable Economic Factors: Rising disposable incomes across key global markets are directly correlating with increased consumer spending on premium and high-value protein sources, with salmon benefiting significantly from this trend.
- Supportive Regulatory Frameworks: Proactive government policies that champion sustainable aquaculture development and actively promote the consumption of healthy seafood are creating a conducive environment for industry growth and investment.
Long-Term Growth Catalysts in Salmon Industry
Long-term growth hinges on sustained innovation in sustainable aquaculture practices, strategic partnerships to improve supply chain efficiency and market access, and expansion into new markets with high growth potential.
Emerging Opportunities in Salmon Industry
The salmon industry is ripe with emerging opportunities poised to shape its future landscape:
- Pioneering Value-Added Products: There is a significant opportunity to develop and market innovative, convenient, and ready-to-eat salmon products that directly address the demands of busy modern lifestyles.
- Deepening Sustainable Aquaculture Practices: Continued investment in cutting-edge technologies and the refinement of sustainable practices are crucial for minimizing environmental impact, optimizing resource utilization, and enhancing the overall traceability of salmon products.
- Strategic New Market Penetration: Exploring and entering new geographical markets, alongside expanding existing distribution networks, presents a substantial opportunity to reach a broader and more diverse global consumer base.
Leading Players in the Salmon Industry Sector
Key Milestones in Salmon Industry Industry
- 2020: A marked increase in the adoption of sustainability certifications across various segments of the salmon industry.
- 2021: Witnessed substantial investment flowing into the development and implementation of advanced closed-containment aquaculture technologies.
- 2022: Marked by the successful launch of several innovative value-added salmon products, strategically designed to appeal to specific consumer demographics.
- 2023: Characterized by a wave of significant mergers and acquisitions, aimed at consolidating market share and enhancing competitive positioning.
- 2024: Showcased a growing commitment to the widespread adoption of advanced traceability systems, bolstering consumer confidence and transparency.
Strategic Outlook for Salmon Industry Market
The strategic outlook for the salmon industry market is exceptionally promising, driven by a continuous cycle of innovation in sustainable aquaculture, a persistently growing global demand for nutritious protein sources, and the cultivation of strategic partnerships. The industry's unwavering focus on sustainability, robust traceability, and the development of high-value, convenient products positions it for sustained and significant future growth, with particular potential anticipated in emerging markets.
Salmon Industry Segmentation
-
1. Species Type
- 1.1. Atlantic Salmon
- 1.2. Coho Salmon
- 1.3. Masu Salmon
- 1.4. Chinook Salmon
- 1.5. Other Species Types
-
2. Type
- 2.1. Farmed
- 2.2. Wild Captured
-
3. Species Type
- 3.1. Atlantic Salmon
- 3.2. Coho Salmon
- 3.3. Masu Salmon
- 3.4. Chinook Salmon
- 3.5. Other Species Types
-
4. Type
- 4.1. Farmed
- 4.2. Wild Captured
Salmon Industry Segmentation By Geography
-
1. North America
- 1.1. United States
- 1.2. Canada
-
2. Europe
- 2.1. Norway
- 2.2. Spain
- 2.3. Netherlands
- 2.4. France
- 2.5. Italy
- 2.6. Greece
- 2.7. United Kingdom
- 2.8. Scotland
-
3. Asia Pacific
- 3.1. China
- 3.2. Japan
- 3.3. Australia
-
4. South America
- 4.1. Chile
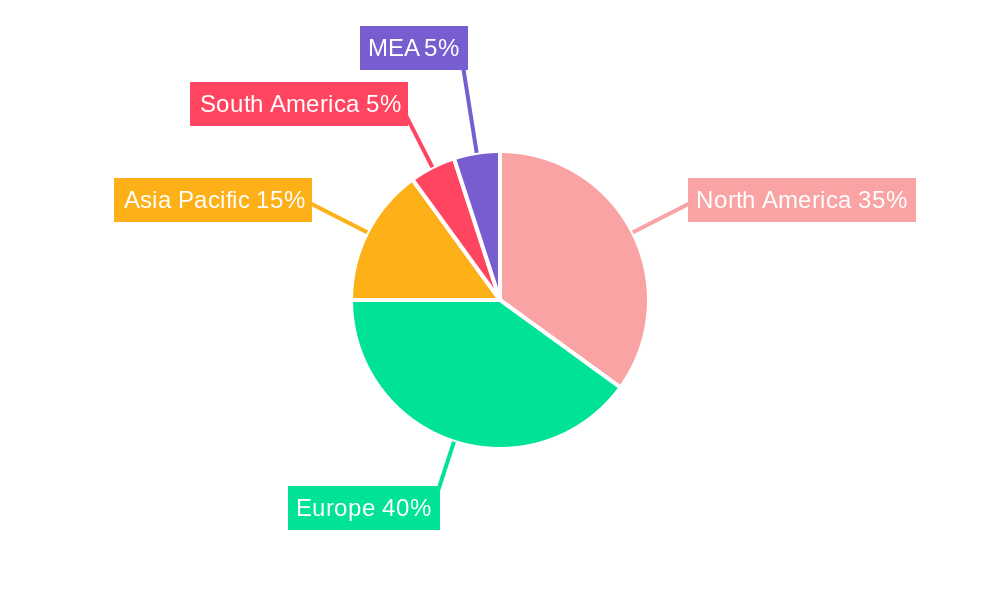
Salmon Industry Regional Market Share
Geographic Coverage of Salmon Industry
Salmon Industry REPORT HIGHLIGHTS
| Aspects | Details |
|---|---|
| Study Period | 2020-2034 |
| Base Year | 2025 |
| Estimated Year | 2026 |
| Forecast Period | 2026-2034 |
| Historical Period | 2020-2025 |
| Growth Rate | CAGR of 8.07% from 2020-2034 |
| Segmentation |
|
Table of Contents
- 1. Introduction
- 1.1. Research Scope
- 1.2. Market Segmentation
- 1.3. Research Objective
- 1.4. Definitions and Assumptions
- 2. Executive Summary
- 2.1. Market Snapshot
- 3. Market Dynamics
- 3.1. Market Drivers
- 3.2. Market Restrains
- 3.3. Market Trends
- 3.4. Market Opportunities
- 4. Market Factor Analysis
- 4.1. Porters Five Forces
- 4.1.1. Bargaining Power of Suppliers
- 4.1.2. Bargaining Power of Buyers
- 4.1.3. Threat of New Entrants
- 4.1.4. Threat of Substitutes
- 4.1.5. Competitive Rivalry
- 4.2. PESTEL analysis
- 4.3. BCG Analysis
- 4.3.1. Stars (High Growth, High Market Share)
- 4.3.2. Cash Cows (Low Growth, High Market Share)
- 4.3.3. Question Mark (High Growth, Low Market Share)
- 4.3.4. Dogs (Low Growth, Low Market Share)
- 4.4. Ansoff Matrix Analysis
- 4.5. Supply Chain Analysis
- 4.6. Regulatory Landscape
- 4.7. Current Market Potential and Opportunity Assessment (TAM–SAM–SOM Framework)
- 4.8. MSR Analyst Note
- 4.1. Porters Five Forces
- 5. Market Analysis, Insights and Forecast 2021-2033
- 5.1. Market Analysis, Insights and Forecast - by Species Type
- 5.1.1. Atlantic Salmon
- 5.1.2. Coho Salmon
- 5.1.3. Masu Salmon
- 5.1.4. Chinook Salmon
- 5.1.5. Other Species Types
- 5.2. Market Analysis, Insights and Forecast - by Type
- 5.2.1. Farmed
- 5.2.2. Wild Captured
- 5.3. Market Analysis, Insights and Forecast - by Species Type
- 5.3.1. Atlantic Salmon
- 5.3.2. Coho Salmon
- 5.3.3. Masu Salmon
- 5.3.4. Chinook Salmon
- 5.3.5. Other Species Types
- 5.4. Market Analysis, Insights and Forecast - by Type
- 5.4.1. Farmed
- 5.4.2. Wild Captured
- 5.5. Market Analysis, Insights and Forecast - by Region
- 5.5.1. North America
- 5.5.2. Europe
- 5.5.3. Asia Pacific
- 5.5.4. South America
- 5.1. Market Analysis, Insights and Forecast - by Species Type
- 6. Global Salmon Industry Analysis, Insights and Forecast, 2021-2033
- 6.1. Market Analysis, Insights and Forecast - by Species Type
- 6.1.1. Atlantic Salmon
- 6.1.2. Coho Salmon
- 6.1.3. Masu Salmon
- 6.1.4. Chinook Salmon
- 6.1.5. Other Species Types
- 6.2. Market Analysis, Insights and Forecast - by Type
- 6.2.1. Farmed
- 6.2.2. Wild Captured
- 6.3. Market Analysis, Insights and Forecast - by Species Type
- 6.3.1. Atlantic Salmon
- 6.3.2. Coho Salmon
- 6.3.3. Masu Salmon
- 6.3.4. Chinook Salmon
- 6.3.5. Other Species Types
- 6.4. Market Analysis, Insights and Forecast - by Type
- 6.4.1. Farmed
- 6.4.2. Wild Captured
- 6.1. Market Analysis, Insights and Forecast - by Species Type
- 7. North America Salmon Industry Analysis, Insights and Forecast, 2020-2032
- 7.1. Market Analysis, Insights and Forecast - by Species Type
- 7.1.1. Atlantic Salmon
- 7.1.2. Coho Salmon
- 7.1.3. Masu Salmon
- 7.1.4. Chinook Salmon
- 7.1.5. Other Species Types
- 7.2. Market Analysis, Insights and Forecast - by Type
- 7.2.1. Farmed
- 7.2.2. Wild Captured
- 7.3. Market Analysis, Insights and Forecast - by Species Type
- 7.3.1. Atlantic Salmon
- 7.3.2. Coho Salmon
- 7.3.3. Masu Salmon
- 7.3.4. Chinook Salmon
- 7.3.5. Other Species Types
- 7.4. Market Analysis, Insights and Forecast - by Type
- 7.4.1. Farmed
- 7.4.2. Wild Captured
- 7.1. Market Analysis, Insights and Forecast - by Species Type
- 8. Europe Salmon Industry Analysis, Insights and Forecast, 2020-2032
- 8.1. Market Analysis, Insights and Forecast - by Species Type
- 8.1.1. Atlantic Salmon
- 8.1.2. Coho Salmon
- 8.1.3. Masu Salmon
- 8.1.4. Chinook Salmon
- 8.1.5. Other Species Types
- 8.2. Market Analysis, Insights and Forecast - by Type
- 8.2.1. Farmed
- 8.2.2. Wild Captured
- 8.3. Market Analysis, Insights and Forecast - by Species Type
- 8.3.1. Atlantic Salmon
- 8.3.2. Coho Salmon
- 8.3.3. Masu Salmon
- 8.3.4. Chinook Salmon
- 8.3.5. Other Species Types
- 8.4. Market Analysis, Insights and Forecast - by Type
- 8.4.1. Farmed
- 8.4.2. Wild Captured
- 8.1. Market Analysis, Insights and Forecast - by Species Type
- 9. Asia Pacific Salmon Industry Analysis, Insights and Forecast, 2020-2032
- 9.1. Market Analysis, Insights and Forecast - by Species Type
- 9.1.1. Atlantic Salmon
- 9.1.2. Coho Salmon
- 9.1.3. Masu Salmon
- 9.1.4. Chinook Salmon
- 9.1.5. Other Species Types
- 9.2. Market Analysis, Insights and Forecast - by Type
- 9.2.1. Farmed
- 9.2.2. Wild Captured
- 9.3. Market Analysis, Insights and Forecast - by Species Type
- 9.3.1. Atlantic Salmon
- 9.3.2. Coho Salmon
- 9.3.3. Masu Salmon
- 9.3.4. Chinook Salmon
- 9.3.5. Other Species Types
- 9.4. Market Analysis, Insights and Forecast - by Type
- 9.4.1. Farmed
- 9.4.2. Wild Captured
- 9.1. Market Analysis, Insights and Forecast - by Species Type
- 10. South America Salmon Industry Analysis, Insights and Forecast, 2020-2032
- 10.1. Market Analysis, Insights and Forecast - by Species Type
- 10.1.1. Atlantic Salmon
- 10.1.2. Coho Salmon
- 10.1.3. Masu Salmon
- 10.1.4. Chinook Salmon
- 10.1.5. Other Species Types
- 10.2. Market Analysis, Insights and Forecast - by Type
- 10.2.1. Farmed
- 10.2.2. Wild Captured
- 10.3. Market Analysis, Insights and Forecast - by Species Type
- 10.3.1. Atlantic Salmon
- 10.3.2. Coho Salmon
- 10.3.3. Masu Salmon
- 10.3.4. Chinook Salmon
- 10.3.5. Other Species Types
- 10.4. Market Analysis, Insights and Forecast - by Type
- 10.4.1. Farmed
- 10.4.2. Wild Captured
- 10.1. Market Analysis, Insights and Forecast - by Species Type
- 11. Competitive Analysis
- 11.1. Company Profiles
- 11.1.1 Leroy Seafood Group
- 11.1.1.1. Company Overview
- 11.1.1.2. Products
- 11.1.1.3. Company Financials
- 11.1.1.4. SWOT Analysis
- 11.1.2 Cooke Aquaculture
- 11.1.2.1. Company Overview
- 11.1.2.2. Products
- 11.1.2.3. Company Financials
- 11.1.2.4. SWOT Analysis
- 11.1.3 Cermaq
- 11.1.3.1. Company Overview
- 11.1.3.2. Products
- 11.1.3.3. Company Financials
- 11.1.3.4. SWOT Analysis
- 11.1.4 Mowi
- 11.1.4.1. Company Overview
- 11.1.4.2. Products
- 11.1.4.3. Company Financials
- 11.1.4.4. SWOT Analysis
- 11.1.5 Grieg Seafood
- 11.1.5.1. Company Overview
- 11.1.5.2. Products
- 11.1.5.3. Company Financials
- 11.1.5.4. SWOT Analysis
- 11.1.1 Leroy Seafood Group
- 11.2. Market Entropy
- 11.2.1 Company's Key Areas Served
- 11.2.2 Recent Developments
- 11.3. Company Market Share Analysis 2025
- 11.3.1 Top 5 Companies Market Share Analysis
- 11.3.2 Top 3 Companies Market Share Analysis
- 11.4. List of Potential Customers
- 12. Research Methodology
List of Figures
- Figure 1: Global Salmon Industry Revenue Breakdown (Million, %) by Region 2025 & 2033
- Figure 2: North America Salmon Industry Revenue (Million), by Species Type 2025 & 2033
- Figure 3: North America Salmon Industry Revenue Share (%), by Species Type 2025 & 2033
- Figure 4: North America Salmon Industry Revenue (Million), by Type 2025 & 2033
- Figure 5: North America Salmon Industry Revenue Share (%), by Type 2025 & 2033
- Figure 6: North America Salmon Industry Revenue (Million), by Species Type 2025 & 2033
- Figure 7: North America Salmon Industry Revenue Share (%), by Species Type 2025 & 2033
- Figure 8: North America Salmon Industry Revenue (Million), by Type 2025 & 2033
- Figure 9: North America Salmon Industry Revenue Share (%), by Type 2025 & 2033
- Figure 10: North America Salmon Industry Revenue (Million), by Country 2025 & 2033
- Figure 11: North America Salmon Industry Revenue Share (%), by Country 2025 & 2033
- Figure 12: Europe Salmon Industry Revenue (Million), by Species Type 2025 & 2033
- Figure 13: Europe Salmon Industry Revenue Share (%), by Species Type 2025 & 2033
- Figure 14: Europe Salmon Industry Revenue (Million), by Type 2025 & 2033
- Figure 15: Europe Salmon Industry Revenue Share (%), by Type 2025 & 2033
- Figure 16: Europe Salmon Industry Revenue (Million), by Species Type 2025 & 2033
- Figure 17: Europe Salmon Industry Revenue Share (%), by Species Type 2025 & 2033
- Figure 18: Europe Salmon Industry Revenue (Million), by Type 2025 & 2033
- Figure 19: Europe Salmon Industry Revenue Share (%), by Type 2025 & 2033
- Figure 20: Europe Salmon Industry Revenue (Million), by Country 2025 & 2033
- Figure 21: Europe Salmon Industry Revenue Share (%), by Country 2025 & 2033
- Figure 22: Asia Pacific Salmon Industry Revenue (Million), by Species Type 2025 & 2033
- Figure 23: Asia Pacific Salmon Industry Revenue Share (%), by Species Type 2025 & 2033
- Figure 24: Asia Pacific Salmon Industry Revenue (Million), by Type 2025 & 2033
- Figure 25: Asia Pacific Salmon Industry Revenue Share (%), by Type 2025 & 2033
- Figure 26: Asia Pacific Salmon Industry Revenue (Million), by Species Type 2025 & 2033
- Figure 27: Asia Pacific Salmon Industry Revenue Share (%), by Species Type 2025 & 2033
- Figure 28: Asia Pacific Salmon Industry Revenue (Million), by Type 2025 & 2033
- Figure 29: Asia Pacific Salmon Industry Revenue Share (%), by Type 2025 & 2033
- Figure 30: Asia Pacific Salmon Industry Revenue (Million), by Country 2025 & 2033
- Figure 31: Asia Pacific Salmon Industry Revenue Share (%), by Country 2025 & 2033
- Figure 32: South America Salmon Industry Revenue (Million), by Species Type 2025 & 2033
- Figure 33: South America Salmon Industry Revenue Share (%), by Species Type 2025 & 2033
- Figure 34: South America Salmon Industry Revenue (Million), by Type 2025 & 2033
- Figure 35: South America Salmon Industry Revenue Share (%), by Type 2025 & 2033
- Figure 36: South America Salmon Industry Revenue (Million), by Species Type 2025 & 2033
- Figure 37: South America Salmon Industry Revenue Share (%), by Species Type 2025 & 2033
- Figure 38: South America Salmon Industry Revenue (Million), by Type 2025 & 2033
- Figure 39: South America Salmon Industry Revenue Share (%), by Type 2025 & 2033
- Figure 40: South America Salmon Industry Revenue (Million), by Country 2025 & 2033
- Figure 41: South America Salmon Industry Revenue Share (%), by Country 2025 & 2033
List of Tables
- Table 1: Global Salmon Industry Revenue Million Forecast, by Species Type 2020 & 2033
- Table 2: Global Salmon Industry Revenue Million Forecast, by Type 2020 & 2033
- Table 3: Global Salmon Industry Revenue Million Forecast, by Species Type 2020 & 2033
- Table 4: Global Salmon Industry Revenue Million Forecast, by Type 2020 & 2033
- Table 5: Global Salmon Industry Revenue Million Forecast, by Region 2020 & 2033
- Table 6: Global Salmon Industry Revenue Million Forecast, by Species Type 2020 & 2033
- Table 7: Global Salmon Industry Revenue Million Forecast, by Type 2020 & 2033
- Table 8: Global Salmon Industry Revenue Million Forecast, by Species Type 2020 & 2033
- Table 9: Global Salmon Industry Revenue Million Forecast, by Type 2020 & 2033
- Table 10: Global Salmon Industry Revenue Million Forecast, by Country 2020 & 2033
- Table 11: United States Salmon Industry Revenue (Million) Forecast, by Application 2020 & 2033
- Table 12: Canada Salmon Industry Revenue (Million) Forecast, by Application 2020 & 2033
- Table 13: Global Salmon Industry Revenue Million Forecast, by Species Type 2020 & 2033
- Table 14: Global Salmon Industry Revenue Million Forecast, by Type 2020 & 2033
- Table 15: Global Salmon Industry Revenue Million Forecast, by Species Type 2020 & 2033
- Table 16: Global Salmon Industry Revenue Million Forecast, by Type 2020 & 2033
- Table 17: Global Salmon Industry Revenue Million Forecast, by Country 2020 & 2033
- Table 18: Norway Salmon Industry Revenue (Million) Forecast, by Application 2020 & 2033
- Table 19: Spain Salmon Industry Revenue (Million) Forecast, by Application 2020 & 2033
- Table 20: Netherlands Salmon Industry Revenue (Million) Forecast, by Application 2020 & 2033
- Table 21: France Salmon Industry Revenue (Million) Forecast, by Application 2020 & 2033
- Table 22: Italy Salmon Industry Revenue (Million) Forecast, by Application 2020 & 2033
- Table 23: Greece Salmon Industry Revenue (Million) Forecast, by Application 2020 & 2033
- Table 24: United Kingdom Salmon Industry Revenue (Million) Forecast, by Application 2020 & 2033
- Table 25: Scotland Salmon Industry Revenue (Million) Forecast, by Application 2020 & 2033
- Table 26: Global Salmon Industry Revenue Million Forecast, by Species Type 2020 & 2033
- Table 27: Global Salmon Industry Revenue Million Forecast, by Type 2020 & 2033
- Table 28: Global Salmon Industry Revenue Million Forecast, by Species Type 2020 & 2033
- Table 29: Global Salmon Industry Revenue Million Forecast, by Type 2020 & 2033
- Table 30: Global Salmon Industry Revenue Million Forecast, by Country 2020 & 2033
- Table 31: China Salmon Industry Revenue (Million) Forecast, by Application 2020 & 2033
- Table 32: Japan Salmon Industry Revenue (Million) Forecast, by Application 2020 & 2033
- Table 33: Australia Salmon Industry Revenue (Million) Forecast, by Application 2020 & 2033
- Table 34: Global Salmon Industry Revenue Million Forecast, by Species Type 2020 & 2033
- Table 35: Global Salmon Industry Revenue Million Forecast, by Type 2020 & 2033
- Table 36: Global Salmon Industry Revenue Million Forecast, by Species Type 2020 & 2033
- Table 37: Global Salmon Industry Revenue Million Forecast, by Type 2020 & 2033
- Table 38: Global Salmon Industry Revenue Million Forecast, by Country 2020 & 2033
- Table 39: Chile Salmon Industry Revenue (Million) Forecast, by Application 2020 & 2033
Frequently Asked Questions
1. What is the projected Compound Annual Growth Rate (CAGR) of the Salmon Industry?
The projected CAGR is approximately 8.07%.
2. Which companies are prominent players in the Salmon Industry?
Key companies in the market include Leroy Seafood Group , Cooke Aquaculture , Cermaq, Mowi , Grieg Seafood .
3. What are the main segments of the Salmon Industry?
The market segments include Species Type, Type, Species Type, Type.
4. Can you provide details about the market size?
The market size is estimated to be USD 33.50 Million as of 2022.
5. What are some drivers contributing to market growth?
; Awareness About Health Benefits Associated With Pecan Consumption; Wide Application of Pecan.
6. What are the notable trends driving market growth?
Healthy Boost in the Salmon Production.
7. Are there any restraints impacting market growth?
; Volatility in the Prices; Adverse Weather Conditions Affecting Yield.
8. Can you provide examples of recent developments in the market?
N/A
9. What pricing options are available for accessing the report?
Pricing options include single-user, multi-user, and enterprise licenses priced at USD 4750, USD 5250, and USD 8750 respectively.
10. Is the market size provided in terms of value or volume?
The market size is provided in terms of value, measured in Million.
11. Are there any specific market keywords associated with the report?
Yes, the market keyword associated with the report is "Salmon Industry," which aids in identifying and referencing the specific market segment covered.
12. How do I determine which pricing option suits my needs best?
The pricing options vary based on user requirements and access needs. Individual users may opt for single-user licenses, while businesses requiring broader access may choose multi-user or enterprise licenses for cost-effective access to the report.
13. Are there any additional resources or data provided in the Salmon Industry report?
While the report offers comprehensive insights, it's advisable to review the specific contents or supplementary materials provided to ascertain if additional resources or data are available.
14. How can I stay updated on further developments or reports in the Salmon Industry?
To stay informed about further developments, trends, and reports in the Salmon Industry, consider subscribing to industry newsletters, following relevant companies and organizations, or regularly checking reputable industry news sources and publications.
Methodology
Step 1 - Identification of Relevant Samples Size from Population Database


Step 2 - Approaches for Defining Global Market Size (Value, Volume* & Price*)

Note*: In applicable scenarios
Step 3 - Data Sources
Primary Research
- Web Analytics
- Survey Reports
- Research Institute
- Latest Research Reports
- Opinion Leaders
Secondary Research
- Annual Reports
- White Paper
- Latest Press Release
- Industry Association
- Paid Database
- Investor Presentations

Step 4 - Data Triangulation
Involves using different sources of information in order to increase the validity of a study
These sources are likely to be stakeholders in a program - participants, other researchers, program staff, other community members, and so on.
Then we put all data in single framework & apply various statistical tools to find out the dynamic on the market.
During the analysis stage, feedback from the stakeholder groups would be compared to determine areas of agreement as well as areas of divergence