

Key Insights
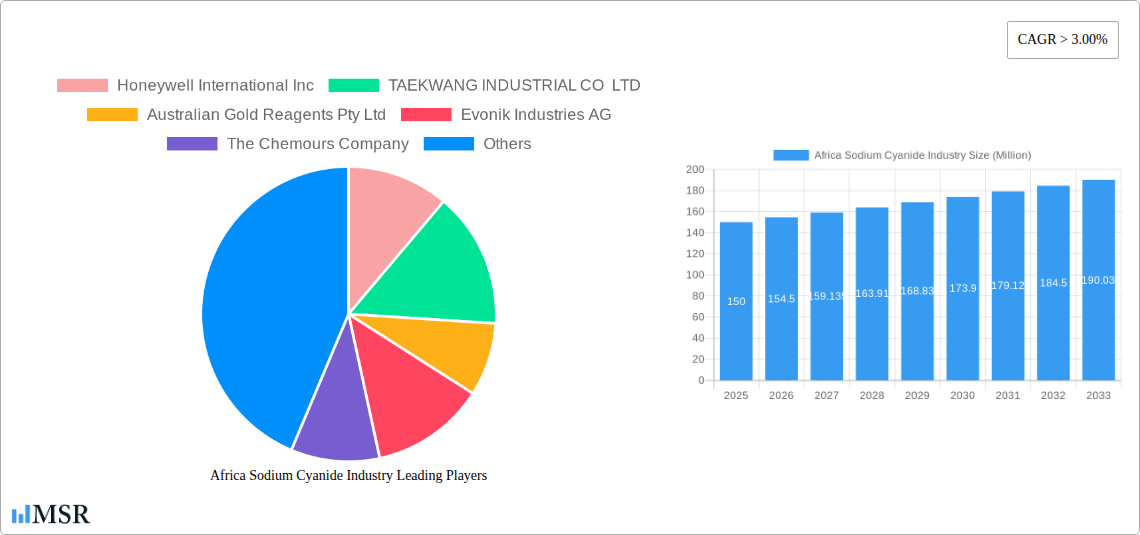
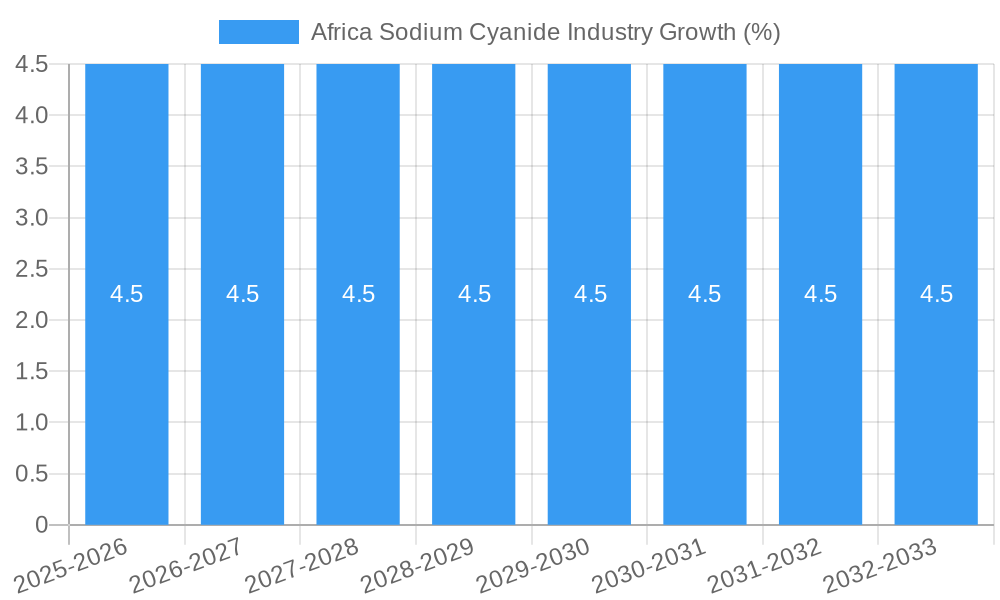
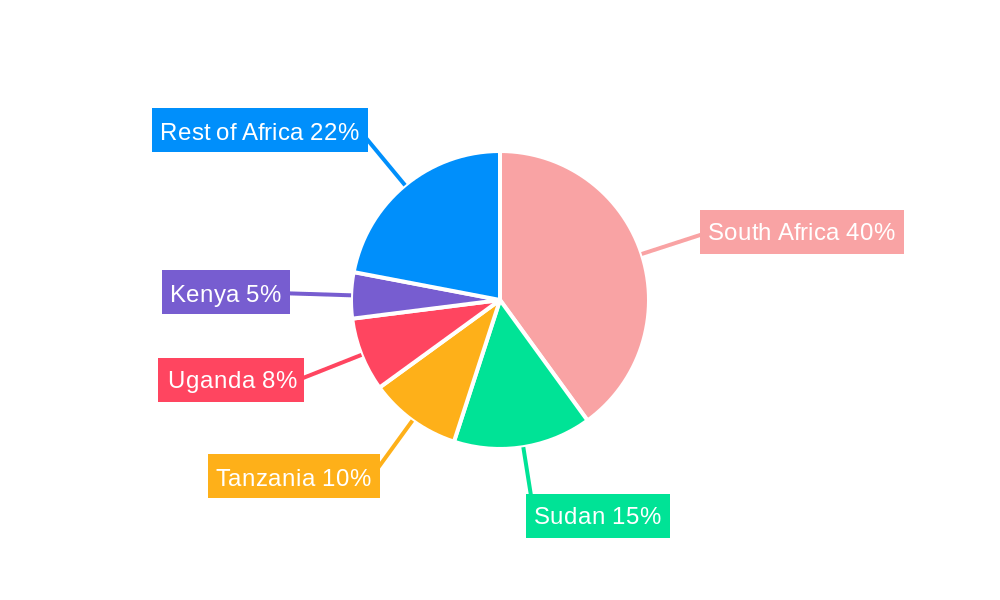
The African sodium cyanide market, valued at approximately $150 million in 2025, is projected to experience robust growth, with a Compound Annual Growth Rate (CAGR) exceeding 3% from 2025 to 2033. This expansion is primarily driven by the burgeoning mining sector, particularly gold mining, across several key African nations. South Africa, with its established gold mining industry, remains a dominant market segment, followed by other significant producers like Sudan, Tanzania, and Uganda. Increasing gold exploration and extraction activities fuel demand for sodium cyanide, a crucial reagent in gold leaching processes. Furthermore, the growth of the chemical industry and other minor end-user sectors contributes to overall market expansion. However, stringent environmental regulations concerning cyanide handling and disposal pose a significant constraint, necessitating investment in safer and more sustainable cyanide management practices. This regulatory landscape, coupled with fluctuating gold prices, influences the market's volatility. The key players in this market, including Honeywell International Inc, TAEKWANG INDUSTRIAL CO LTD, and Orica Limited, are actively engaged in developing and providing innovative cyanide solutions, alongside focusing on strengthening supply chains to mitigate risks.
The forecast period (2025-2033) suggests a consistent upward trajectory for the African sodium cyanide market. While regional variations in growth rates are anticipated, the overall positive trend is supported by sustained investment in mining infrastructure, technological advancements in cyanide utilization (leading to improved efficiency and reduced environmental impact), and the exploration of new gold reserves. Nevertheless, the industry will need to continuously adapt to evolving regulatory frameworks, address concerns regarding cyanide’s toxicity and environmental footprint, and maintain supply chain resilience against economic fluctuations to ensure long-term sustainable growth. A diversification of end-user industries beyond mining could also contribute to a more robust and less volatile market in the coming years.
Africa Sodium Cyanide Industry Market Report: 2019-2033
This comprehensive report provides an in-depth analysis of the Africa sodium cyanide industry, offering invaluable insights for stakeholders across the value chain. From market dynamics and key players to emerging trends and future growth potential, this report is your essential guide to navigating this critical sector. The report covers the period 2019-2033, with a focus on the forecast period 2025-2033 and a base year of 2025. The market size is estimated at xx Million in 2025 and is projected to reach xx Million by 2033, with a CAGR of xx%.
Africa Sodium Cyanide Industry Market Concentration & Dynamics
The Africa sodium cyanide market exhibits a moderately concentrated landscape, with several multinational corporations and regional players dominating the supply chain. Market share is primarily influenced by production capacity, distribution networks, and pricing strategies. The top five companies—Honeywell International Inc, TAEKWANG INDUSTRIAL CO LTD, Australian Gold Reagents Pty Ltd, Evonik Industries AG, and The Chemours Company—account for an estimated xx% of the market. Innovation within the industry focuses on enhancing cyanide production efficiency and reducing environmental impact. Regulatory frameworks vary across African nations, impacting operational costs and compliance requirements. Substitute products are limited, with sodium cyanide remaining the primary reagent for gold extraction. Mergers and acquisitions (M&A) activity has been relatively low in recent years, with only xx major deals recorded between 2019 and 2024. End-user trends are closely tied to gold mining activity and overall economic growth.
- Market Share: Top 5 players hold xx%
- M&A Activity (2019-2024): xx deals
Africa Sodium Cyanide Industry Industry Insights & Trends
The African sodium cyanide market is driven primarily by robust gold mining activity across the continent. Increasing gold production targets in major mining nations, coupled with rising gold prices, have fueled demand for sodium cyanide. Technological advancements in cyanide management and efficient extraction processes are improving operational efficiency and reducing environmental impact. Changing consumer preferences, though less directly impactful, indirectly influence market growth through the demand for gold-related products. The market witnessed significant growth between 2019 and 2024, and this positive trend is expected to continue.
Key Markets & Segments Leading Africa Sodium Cyanide Industry
The mining segment is by far the dominant end-user industry for sodium cyanide in Africa, accounting for over xx% of total consumption. South Africa, Ghana, and Tanzania are key markets, driven by substantial gold reserves and ongoing mining projects.
- Mining Segment Drivers:
- High gold production targets.
- Significant gold reserves in key countries.
- Investments in new mining projects.
- Rising global gold prices.
The chemical sector accounts for a smaller but growing share, mainly related to industrial applications such as electroplating and chemical synthesis. Other end-user industries represent a relatively minor segment. South Africa's established mining industry, coupled with supportive government policies, solidifies its position as the leading market.
Africa Sodium Cyanide Industry Product Developments
Recent innovations focus on safer handling and transportation of sodium cyanide, improving efficiency, and minimizing environmental risks. The industry is exploring alternative cyanide formulations and developing more sustainable technologies to reduce waste and improve safety protocols. These improvements aim to enhance the competitiveness of sodium cyanide producers and improve the overall sustainability of gold mining operations.
Challenges in the Africa Sodium Cyanide Industry Market
The industry faces challenges, including regulatory hurdles related to environmental protection and cyanide handling. Supply chain disruptions due to logistical constraints and geopolitical factors can also impact availability and pricing. Intense competition among established players and emerging producers adds pressure on profit margins. The impact of these challenges is estimated at a xx% reduction in overall market growth in 2024.
Forces Driving Africa Sodium Cyanide Industry Growth
Key growth drivers include increasing gold production, expanding mining operations, and investments in new mining projects across Africa. Technological advancements such as efficient extraction methods and improved cyanide management enhance productivity and reduce environmental concerns. Favorable government policies and infrastructure development also contribute to market expansion.
Long-Term Growth Catalysts in the Africa Sodium Cyanide Industry
Long-term growth is projected to be fueled by ongoing investments in mining exploration and infrastructure development across Africa. Strategic partnerships between mining companies and cyanide producers will enhance supply chain efficiency and sustainability. Further innovation in cyanide management and environmentally friendly production methods will also support market expansion.
Emerging Opportunities in Africa Sodium Cyanide Industry
Emerging opportunities include the expansion into new markets, particularly those with growing gold mining activities. Innovations in cyanide-free extraction technologies and the development of more sustainable alternatives may reshape the market landscape. Meeting the increasing demand for responsible and sustainable sourcing of sodium cyanide will create new opportunities for producers.
Leading Players in the Africa Sodium Cyanide Industry Sector
- Honeywell International Inc
- TAEKWANG INDUSTRIAL CO LTD
- Australian Gold Reagents Pty Ltd
- Evonik Industries AG
- The Chemours Company
- Sasol
- HeBei ChengXin
- TSPC
- Orica Limited
Key Milestones in Africa Sodium Cyanide Industry Industry
- April 2022: Australian Gold Reagents (AGR) announced plans to expand its sodium cyanide production capacity by 30,000 tons per annum, boosting global supply.
- January 2023: Sodium cyanide shortages in Tanzania hampered large and medium-scale mining operations, highlighting supply chain vulnerabilities.
Strategic Outlook for Africa Sodium Cyanide Industry Market
The African sodium cyanide market is poised for continued growth, driven by a combination of factors including increasing gold production, investments in mining infrastructure, and technological advancements. Strategic partnerships, sustainable practices, and proactive regulatory compliance will be crucial for long-term success in this dynamic market. The potential for market expansion and increased profitability remains strong, offering attractive opportunities for investors and industry players.
Africa Sodium Cyanide Industry Segmentation
-
1. End-user Industry
- 1.1. Mining
- 1.2. Chemical
- 1.3. Other End-user Industries
Africa Sodium Cyanide Industry Segmentation By Geography
- 1. Ghana
- 2. Burkina Faso
- 3. Egypt
- 4. Tanzania
- 5. Zimbabwe
- 6. Mali
- 7. Democratic Republic of Congo
- 8. Sudan
- 9. Guinea
- 10. South Africa
- 11. Rest of Africa
Africa Sodium Cyanide Industry REPORT HIGHLIGHTS
| Aspects | Details |
|---|---|
| Study Period | 2019-2033 |
| Base Year | 2024 |
| Estimated Year | 2025 |
| Forecast Period | 2025-2033 |
| Historical Period | 2019-2024 |
| Growth Rate | CAGR of > 3.00% from 2019-2033 |
| Segmentation |
|
Table of Contents
- 1. Introduction
- 1.1. Research Scope
- 1.2. Market Segmentation
- 1.3. Research Methodology
- 1.4. Definitions and Assumptions
- 2. Executive Summary
- 2.1. Introduction
- 3. Market Dynamics
- 3.1. Introduction
- 3.2. Market Drivers
- 3.2.1. Increasing Demand from the Gold Mining Activities; Increasing Demand for Use in Chemical and Polymer Synthesis
- 3.3. Market Restrains
- 3.3.1. Toxicity of Sodium Cyanide
- 3.4. Market Trends
- 3.4.1. Increasing Demand from Mining Industry
- 4. Market Factor Analysis
- 4.1. Porters Five Forces
- 4.2. Supply/Value Chain
- 4.3. PESTEL analysis
- 4.4. Market Entropy
- 4.5. Patent/Trademark Analysis
- 5. Africa Sodium Cyanide Industry Analysis, Insights and Forecast, 2019-2031
- 5.1. Market Analysis, Insights and Forecast - by End-user Industry
- 5.1.1. Mining
- 5.1.2. Chemical
- 5.1.3. Other End-user Industries
- 5.2. Market Analysis, Insights and Forecast - by Region
- 5.2.1. Ghana
- 5.2.2. Burkina Faso
- 5.2.3. Egypt
- 5.2.4. Tanzania
- 5.2.5. Zimbabwe
- 5.2.6. Mali
- 5.2.7. Democratic Republic of Congo
- 5.2.8. Sudan
- 5.2.9. Guinea
- 5.2.10. South Africa
- 5.2.11. Rest of Africa
- 5.1. Market Analysis, Insights and Forecast - by End-user Industry
- 6. Ghana Africa Sodium Cyanide Industry Analysis, Insights and Forecast, 2019-2031
- 6.1. Market Analysis, Insights and Forecast - by End-user Industry
- 6.1.1. Mining
- 6.1.2. Chemical
- 6.1.3. Other End-user Industries
- 6.1. Market Analysis, Insights and Forecast - by End-user Industry
- 7. Burkina Faso Africa Sodium Cyanide Industry Analysis, Insights and Forecast, 2019-2031
- 7.1. Market Analysis, Insights and Forecast - by End-user Industry
- 7.1.1. Mining
- 7.1.2. Chemical
- 7.1.3. Other End-user Industries
- 7.1. Market Analysis, Insights and Forecast - by End-user Industry
- 8. Egypt Africa Sodium Cyanide Industry Analysis, Insights and Forecast, 2019-2031
- 8.1. Market Analysis, Insights and Forecast - by End-user Industry
- 8.1.1. Mining
- 8.1.2. Chemical
- 8.1.3. Other End-user Industries
- 8.1. Market Analysis, Insights and Forecast - by End-user Industry
- 9. Tanzania Africa Sodium Cyanide Industry Analysis, Insights and Forecast, 2019-2031
- 9.1. Market Analysis, Insights and Forecast - by End-user Industry
- 9.1.1. Mining
- 9.1.2. Chemical
- 9.1.3. Other End-user Industries
- 9.1. Market Analysis, Insights and Forecast - by End-user Industry
- 10. Zimbabwe Africa Sodium Cyanide Industry Analysis, Insights and Forecast, 2019-2031
- 10.1. Market Analysis, Insights and Forecast - by End-user Industry
- 10.1.1. Mining
- 10.1.2. Chemical
- 10.1.3. Other End-user Industries
- 10.1. Market Analysis, Insights and Forecast - by End-user Industry
- 11. Mali Africa Sodium Cyanide Industry Analysis, Insights and Forecast, 2019-2031
- 11.1. Market Analysis, Insights and Forecast - by End-user Industry
- 11.1.1. Mining
- 11.1.2. Chemical
- 11.1.3. Other End-user Industries
- 11.1. Market Analysis, Insights and Forecast - by End-user Industry
- 12. Democratic Republic of Congo Africa Sodium Cyanide Industry Analysis, Insights and Forecast, 2019-2031
- 12.1. Market Analysis, Insights and Forecast - by End-user Industry
- 12.1.1. Mining
- 12.1.2. Chemical
- 12.1.3. Other End-user Industries
- 12.1. Market Analysis, Insights and Forecast - by End-user Industry
- 13. Sudan Africa Sodium Cyanide Industry Analysis, Insights and Forecast, 2019-2031
- 13.1. Market Analysis, Insights and Forecast - by End-user Industry
- 13.1.1. Mining
- 13.1.2. Chemical
- 13.1.3. Other End-user Industries
- 13.1. Market Analysis, Insights and Forecast - by End-user Industry
- 14. Guinea Africa Sodium Cyanide Industry Analysis, Insights and Forecast, 2019-2031
- 14.1. Market Analysis, Insights and Forecast - by End-user Industry
- 14.1.1. Mining
- 14.1.2. Chemical
- 14.1.3. Other End-user Industries
- 14.1. Market Analysis, Insights and Forecast - by End-user Industry
- 15. South Africa Africa Sodium Cyanide Industry Analysis, Insights and Forecast, 2019-2031
- 15.1. Market Analysis, Insights and Forecast - by End-user Industry
- 15.1.1. Mining
- 15.1.2. Chemical
- 15.1.3. Other End-user Industries
- 15.1. Market Analysis, Insights and Forecast - by End-user Industry
- 16. Rest of Africa Africa Sodium Cyanide Industry Analysis, Insights and Forecast, 2019-2031
- 16.1. Market Analysis, Insights and Forecast - by End-user Industry
- 16.1.1. Mining
- 16.1.2. Chemical
- 16.1.3. Other End-user Industries
- 16.1. Market Analysis, Insights and Forecast - by End-user Industry
- 17. South Africa Africa Sodium Cyanide Industry Analysis, Insights and Forecast, 2019-2031
- 18. Sudan Africa Sodium Cyanide Industry Analysis, Insights and Forecast, 2019-2031
- 19. Uganda Africa Sodium Cyanide Industry Analysis, Insights and Forecast, 2019-2031
- 20. Tanzania Africa Sodium Cyanide Industry Analysis, Insights and Forecast, 2019-2031
- 21. Kenya Africa Sodium Cyanide Industry Analysis, Insights and Forecast, 2019-2031
- 22. Rest of Africa Africa Sodium Cyanide Industry Analysis, Insights and Forecast, 2019-2031
- 23. Competitive Analysis
- 23.1. Market Share Analysis 2024
- 23.2. Company Profiles
- 23.2.1 Honeywell International Inc
- 23.2.1.1. Overview
- 23.2.1.2. Products
- 23.2.1.3. SWOT Analysis
- 23.2.1.4. Recent Developments
- 23.2.1.5. Financials (Based on Availability)
- 23.2.2 TAEKWANG INDUSTRIAL CO LTD
- 23.2.2.1. Overview
- 23.2.2.2. Products
- 23.2.2.3. SWOT Analysis
- 23.2.2.4. Recent Developments
- 23.2.2.5. Financials (Based on Availability)
- 23.2.3 Australian Gold Reagents Pty Ltd
- 23.2.3.1. Overview
- 23.2.3.2. Products
- 23.2.3.3. SWOT Analysis
- 23.2.3.4. Recent Developments
- 23.2.3.5. Financials (Based on Availability)
- 23.2.4 Evonik Industries AG
- 23.2.4.1. Overview
- 23.2.4.2. Products
- 23.2.4.3. SWOT Analysis
- 23.2.4.4. Recent Developments
- 23.2.4.5. Financials (Based on Availability)
- 23.2.5 The Chemours Company
- 23.2.5.1. Overview
- 23.2.5.2. Products
- 23.2.5.3. SWOT Analysis
- 23.2.5.4. Recent Developments
- 23.2.5.5. Financials (Based on Availability)
- 23.2.6 Sasol
- 23.2.6.1. Overview
- 23.2.6.2. Products
- 23.2.6.3. SWOT Analysis
- 23.2.6.4. Recent Developments
- 23.2.6.5. Financials (Based on Availability)
- 23.2.7 HeBei ChengXin
- 23.2.7.1. Overview
- 23.2.7.2. Products
- 23.2.7.3. SWOT Analysis
- 23.2.7.4. Recent Developments
- 23.2.7.5. Financials (Based on Availability)
- 23.2.8 TSPC
- 23.2.8.1. Overview
- 23.2.8.2. Products
- 23.2.8.3. SWOT Analysis
- 23.2.8.4. Recent Developments
- 23.2.8.5. Financials (Based on Availability)
- 23.2.9 Orica Limited
- 23.2.9.1. Overview
- 23.2.9.2. Products
- 23.2.9.3. SWOT Analysis
- 23.2.9.4. Recent Developments
- 23.2.9.5. Financials (Based on Availability)
- 23.2.1 Honeywell International Inc
List of Figures
- Figure 1: Africa Sodium Cyanide Industry Revenue Breakdown (Million, %) by Product 2024 & 2032
- Figure 2: Africa Sodium Cyanide Industry Share (%) by Company 2024
List of Tables
- Table 1: Africa Sodium Cyanide Industry Revenue Million Forecast, by Region 2019 & 2032
- Table 2: Africa Sodium Cyanide Industry Volume K Tons Forecast, by Region 2019 & 2032
- Table 3: Africa Sodium Cyanide Industry Revenue Million Forecast, by End-user Industry 2019 & 2032
- Table 4: Africa Sodium Cyanide Industry Volume K Tons Forecast, by End-user Industry 2019 & 2032
- Table 5: Africa Sodium Cyanide Industry Revenue Million Forecast, by Region 2019 & 2032
- Table 6: Africa Sodium Cyanide Industry Volume K Tons Forecast, by Region 2019 & 2032
- Table 7: Africa Sodium Cyanide Industry Revenue Million Forecast, by Country 2019 & 2032
- Table 8: Africa Sodium Cyanide Industry Volume K Tons Forecast, by Country 2019 & 2032
- Table 9: South Africa Africa Sodium Cyanide Industry Revenue (Million) Forecast, by Application 2019 & 2032
- Table 10: South Africa Africa Sodium Cyanide Industry Volume (K Tons) Forecast, by Application 2019 & 2032
- Table 11: Sudan Africa Sodium Cyanide Industry Revenue (Million) Forecast, by Application 2019 & 2032
- Table 12: Sudan Africa Sodium Cyanide Industry Volume (K Tons) Forecast, by Application 2019 & 2032
- Table 13: Uganda Africa Sodium Cyanide Industry Revenue (Million) Forecast, by Application 2019 & 2032
- Table 14: Uganda Africa Sodium Cyanide Industry Volume (K Tons) Forecast, by Application 2019 & 2032
- Table 15: Tanzania Africa Sodium Cyanide Industry Revenue (Million) Forecast, by Application 2019 & 2032
- Table 16: Tanzania Africa Sodium Cyanide Industry Volume (K Tons) Forecast, by Application 2019 & 2032
- Table 17: Kenya Africa Sodium Cyanide Industry Revenue (Million) Forecast, by Application 2019 & 2032
- Table 18: Kenya Africa Sodium Cyanide Industry Volume (K Tons) Forecast, by Application 2019 & 2032
- Table 19: Rest of Africa Africa Sodium Cyanide Industry Revenue (Million) Forecast, by Application 2019 & 2032
- Table 20: Rest of Africa Africa Sodium Cyanide Industry Volume (K Tons) Forecast, by Application 2019 & 2032
- Table 21: Africa Sodium Cyanide Industry Revenue Million Forecast, by End-user Industry 2019 & 2032
- Table 22: Africa Sodium Cyanide Industry Volume K Tons Forecast, by End-user Industry 2019 & 2032
- Table 23: Africa Sodium Cyanide Industry Revenue Million Forecast, by Country 2019 & 2032
- Table 24: Africa Sodium Cyanide Industry Volume K Tons Forecast, by Country 2019 & 2032
- Table 25: Africa Sodium Cyanide Industry Revenue Million Forecast, by End-user Industry 2019 & 2032
- Table 26: Africa Sodium Cyanide Industry Volume K Tons Forecast, by End-user Industry 2019 & 2032
- Table 27: Africa Sodium Cyanide Industry Revenue Million Forecast, by Country 2019 & 2032
- Table 28: Africa Sodium Cyanide Industry Volume K Tons Forecast, by Country 2019 & 2032
- Table 29: Africa Sodium Cyanide Industry Revenue Million Forecast, by End-user Industry 2019 & 2032
- Table 30: Africa Sodium Cyanide Industry Volume K Tons Forecast, by End-user Industry 2019 & 2032
- Table 31: Africa Sodium Cyanide Industry Revenue Million Forecast, by Country 2019 & 2032
- Table 32: Africa Sodium Cyanide Industry Volume K Tons Forecast, by Country 2019 & 2032
- Table 33: Africa Sodium Cyanide Industry Revenue Million Forecast, by End-user Industry 2019 & 2032
- Table 34: Africa Sodium Cyanide Industry Volume K Tons Forecast, by End-user Industry 2019 & 2032
- Table 35: Africa Sodium Cyanide Industry Revenue Million Forecast, by Country 2019 & 2032
- Table 36: Africa Sodium Cyanide Industry Volume K Tons Forecast, by Country 2019 & 2032
- Table 37: Africa Sodium Cyanide Industry Revenue Million Forecast, by End-user Industry 2019 & 2032
- Table 38: Africa Sodium Cyanide Industry Volume K Tons Forecast, by End-user Industry 2019 & 2032
- Table 39: Africa Sodium Cyanide Industry Revenue Million Forecast, by Country 2019 & 2032
- Table 40: Africa Sodium Cyanide Industry Volume K Tons Forecast, by Country 2019 & 2032
- Table 41: Africa Sodium Cyanide Industry Revenue Million Forecast, by End-user Industry 2019 & 2032
- Table 42: Africa Sodium Cyanide Industry Volume K Tons Forecast, by End-user Industry 2019 & 2032
- Table 43: Africa Sodium Cyanide Industry Revenue Million Forecast, by Country 2019 & 2032
- Table 44: Africa Sodium Cyanide Industry Volume K Tons Forecast, by Country 2019 & 2032
- Table 45: Africa Sodium Cyanide Industry Revenue Million Forecast, by End-user Industry 2019 & 2032
- Table 46: Africa Sodium Cyanide Industry Volume K Tons Forecast, by End-user Industry 2019 & 2032
- Table 47: Africa Sodium Cyanide Industry Revenue Million Forecast, by Country 2019 & 2032
- Table 48: Africa Sodium Cyanide Industry Volume K Tons Forecast, by Country 2019 & 2032
- Table 49: Africa Sodium Cyanide Industry Revenue Million Forecast, by End-user Industry 2019 & 2032
- Table 50: Africa Sodium Cyanide Industry Volume K Tons Forecast, by End-user Industry 2019 & 2032
- Table 51: Africa Sodium Cyanide Industry Revenue Million Forecast, by Country 2019 & 2032
- Table 52: Africa Sodium Cyanide Industry Volume K Tons Forecast, by Country 2019 & 2032
- Table 53: Africa Sodium Cyanide Industry Revenue Million Forecast, by End-user Industry 2019 & 2032
- Table 54: Africa Sodium Cyanide Industry Volume K Tons Forecast, by End-user Industry 2019 & 2032
- Table 55: Africa Sodium Cyanide Industry Revenue Million Forecast, by Country 2019 & 2032
- Table 56: Africa Sodium Cyanide Industry Volume K Tons Forecast, by Country 2019 & 2032
- Table 57: Africa Sodium Cyanide Industry Revenue Million Forecast, by End-user Industry 2019 & 2032
- Table 58: Africa Sodium Cyanide Industry Volume K Tons Forecast, by End-user Industry 2019 & 2032
- Table 59: Africa Sodium Cyanide Industry Revenue Million Forecast, by Country 2019 & 2032
- Table 60: Africa Sodium Cyanide Industry Volume K Tons Forecast, by Country 2019 & 2032
- Table 61: Africa Sodium Cyanide Industry Revenue Million Forecast, by End-user Industry 2019 & 2032
- Table 62: Africa Sodium Cyanide Industry Volume K Tons Forecast, by End-user Industry 2019 & 2032
- Table 63: Africa Sodium Cyanide Industry Revenue Million Forecast, by Country 2019 & 2032
- Table 64: Africa Sodium Cyanide Industry Volume K Tons Forecast, by Country 2019 & 2032
Frequently Asked Questions
1. What is the projected Compound Annual Growth Rate (CAGR) of the Africa Sodium Cyanide Industry?
The projected CAGR is approximately > 3.00%.
2. Which companies are prominent players in the Africa Sodium Cyanide Industry?
Key companies in the market include Honeywell International Inc, TAEKWANG INDUSTRIAL CO LTD, Australian Gold Reagents Pty Ltd, Evonik Industries AG, The Chemours Company, Sasol, HeBei ChengXin, TSPC, Orica Limited.
3. What are the main segments of the Africa Sodium Cyanide Industry?
The market segments include End-user Industry.
4. Can you provide details about the market size?
The market size is estimated to be USD XX Million as of 2022.
5. What are some drivers contributing to market growth?
Increasing Demand from the Gold Mining Activities; Increasing Demand for Use in Chemical and Polymer Synthesis.
6. What are the notable trends driving market growth?
Increasing Demand from Mining Industry.
7. Are there any restraints impacting market growth?
Toxicity of Sodium Cyanide.
8. Can you provide examples of recent developments in the market?
January 2023: Shortages of sodium cyanide in Tanzania has hampered the country's large and medium sclae miners.
9. What pricing options are available for accessing the report?
Pricing options include single-user, multi-user, and enterprise licenses priced at USD 4750, USD 5250, and USD 8750 respectively.
10. Is the market size provided in terms of value or volume?
The market size is provided in terms of value, measured in Million and volume, measured in K Tons.
11. Are there any specific market keywords associated with the report?
Yes, the market keyword associated with the report is "Africa Sodium Cyanide Industry," which aids in identifying and referencing the specific market segment covered.
12. How do I determine which pricing option suits my needs best?
The pricing options vary based on user requirements and access needs. Individual users may opt for single-user licenses, while businesses requiring broader access may choose multi-user or enterprise licenses for cost-effective access to the report.
13. Are there any additional resources or data provided in the Africa Sodium Cyanide Industry report?
While the report offers comprehensive insights, it's advisable to review the specific contents or supplementary materials provided to ascertain if additional resources or data are available.
14. How can I stay updated on further developments or reports in the Africa Sodium Cyanide Industry?
To stay informed about further developments, trends, and reports in the Africa Sodium Cyanide Industry, consider subscribing to industry newsletters, following relevant companies and organizations, or regularly checking reputable industry news sources and publications.
Methodology
Step 1 - Identification of Relevant Samples Size from Population Database


Step 2 - Approaches for Defining Global Market Size (Value, Volume* & Price*)

Note*: In applicable scenarios
Step 3 - Data Sources
Primary Research
- Web Analytics
- Survey Reports
- Research Institute
- Latest Research Reports
- Opinion Leaders
Secondary Research
- Annual Reports
- White Paper
- Latest Press Release
- Industry Association
- Paid Database
- Investor Presentations

Step 4 - Data Triangulation
Involves using different sources of information in order to increase the validity of a study
These sources are likely to be stakeholders in a program - participants, other researchers, program staff, other community members, and so on.
Then we put all data in single framework & apply various statistical tools to find out the dynamic on the market.
During the analysis stage, feedback from the stakeholder groups would be compared to determine areas of agreement as well as areas of divergence
