

Key Insights
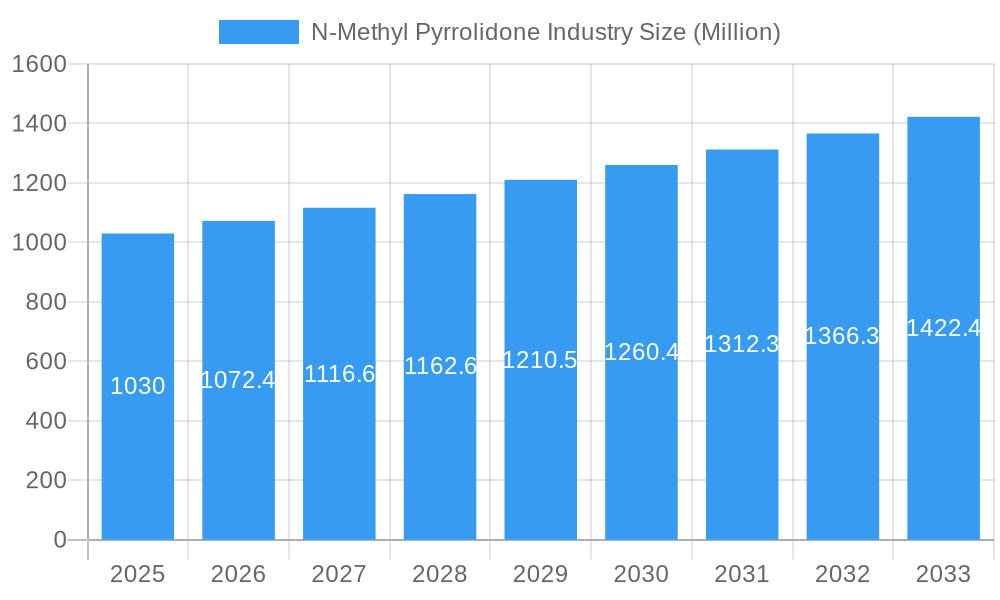
The N-Methyl Pyrrolidone (NMP) market, valued at $1.03 billion in 2025, is projected to experience robust growth, exceeding a 4% CAGR from 2025 to 2033. This expansion is driven by increasing demand across diverse applications, particularly in the oil and gas sector for enhanced oil recovery and in the pharmaceuticals industry as a solvent in various manufacturing processes. The paints and coatings segment also contributes significantly, leveraging NMP's excellent solvent properties for superior film formation and adhesion. Growth is further fueled by advancements in electronics manufacturing, requiring high-purity NMP for specialized cleaning and processing. However, stringent environmental regulations regarding NMP's volatile organic compound (VOC) emissions present a significant restraint, necessitating the development and adoption of more sustainable production methods and alternative solvents. The Asia-Pacific region, led by China and India, is expected to dominate the market due to rapid industrialization and increasing demand from burgeoning sectors like agrochemicals and construction. Key players such as BASF SE, Mitsubishi Chemical Corporation, and Ashland are strategically investing in capacity expansion and R&D to capitalize on the market's growth potential while simultaneously addressing environmental concerns. The competitive landscape is characterized by both large multinational corporations and regional players, creating a dynamic market with opportunities for both established players and emerging businesses focusing on innovative and sustainable NMP solutions.
N-Methyl Pyrrolidone Industry Market Size (In Billion)
The forecast period (2025-2033) will see continued market penetration in emerging economies, alongside a greater focus on sustainable practices within established markets. This balance requires a strategic approach from market participants – balancing cost-effective production with the adoption of environmentally friendly processes. The diversification of applications, including the potential growth in renewable energy sectors that utilize NMP in battery production, will be a crucial factor shaping future market trends. Technological innovations aimed at reducing VOC emissions, alongside advancements in recycling and recovery methods, will play a significant role in mitigating environmental concerns and ensuring the long-term sustainability of the NMP market. The continuous development of high-purity NMP grades for specific applications will also contribute to market growth, creating a niche for specialized manufacturers and suppliers.
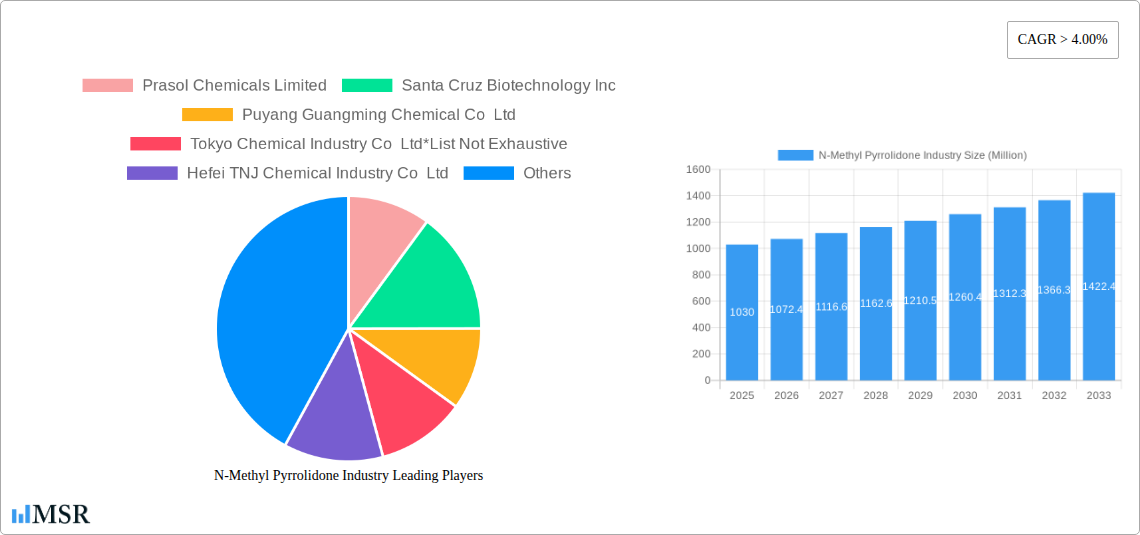
N-Methyl Pyrrolidone Industry Company Market Share
N-Methyl Pyrrolidone (NMP) Industry Report: 2019-2033
This comprehensive report provides an in-depth analysis of the N-Methyl Pyrrolidone (NMP) industry, offering crucial insights for stakeholders seeking to navigate this dynamic market. Covering the period 2019-2033, with a base year of 2025 and a forecast period of 2025-2033, this report meticulously examines market dynamics, trends, leading players, and future opportunities within the NMP sector. Expect detailed analysis of market size (in Millions), CAGR, and key market segments.
N-Methyl Pyrrolidone Industry Market Concentration & Dynamics
The N-Methyl Pyrrolidone (NMP) market exhibits a moderately concentrated structure, with several major players commanding significant market share. The global market size reached xx Million in 2024 and is projected to reach xx Million by 2033, exhibiting a CAGR of xx%. Innovation within the NMP industry is driven by the ongoing development of more sustainable and efficient production processes, alongside the exploration of novel applications. Regulatory frameworks, particularly concerning environmental regulations and safety standards, play a vital role in shaping industry practices. Substitute products pose a moderate competitive threat, while end-user trends, particularly in the electronics and pharmaceuticals sectors, significantly impact demand. M&A activity within the sector has been relatively moderate, with xx major deals recorded between 2019 and 2024. Key players are constantly seeking ways to improve efficiency and expand their market share.
- Market Share: Top 5 players hold approximately xx% of the market share.
- M&A Deal Count (2019-2024): xx
- Key Regulatory Factors: Environmental regulations, safety standards, and import/export restrictions.
- Substitute Products: Alternative solvents and chemicals.
N-Methyl Pyrrolidone Industry Insights & Trends
The NMP market is experiencing robust growth driven by several key factors. Increasing demand from diverse sectors, such as pharmaceuticals, electronics, and paints and coatings, fuels market expansion. Technological advancements leading to improved production efficiency and the development of more specialized NMP variants are also crucial drivers. Evolving consumer preferences towards sustainable and environmentally friendly products are prompting companies to adopt eco-conscious practices in NMP production and application. The market is witnessing a steady increase in the adoption of NMP in high-growth sectors, leading to a significant rise in demand. The global market size is projected to experience substantial growth, reaching xx Million by 2033.
Key Markets & Segments Leading N-Methyl Pyrrolidone Industry
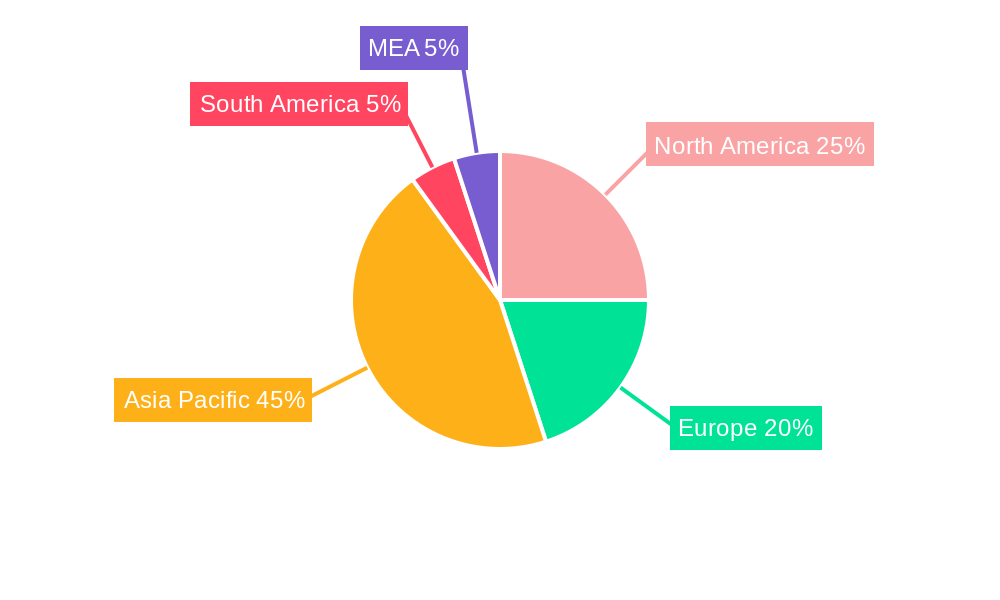
The Asia-Pacific region currently dominates the global NMP market, driven by rapid industrialization and substantial economic growth in countries like China and India. The paints and coatings segment shows exceptional growth, fueled by rising construction activities and the growing demand for high-performance coatings.
Dominant Segment: Paints and Coatings
Drivers:
- Economic Growth: Rapid industrialization and infrastructure development in Asia-Pacific.
- Construction Boom: Increased demand for paints and coatings.
- Technological Advancements: Development of novel coatings with improved properties.
- Automotive Industry: Growing demand for high-quality automotive paints.
Detailed Dominance Analysis: The dominance of the Asia-Pacific region is primarily attributed to the robust growth of its manufacturing and construction sectors, which are significant consumers of NMP. China's substantial market size and significant production capacity further contribute to this dominance. Furthermore, the rapidly expanding electronics industry in the region also significantly impacts NMP demand.
N-Methyl Pyrrolidone Industry Product Developments
Recent product innovations focus on developing high-purity NMP variants for specific applications, such as pharmaceuticals and electronics. These innovations often leverage advancements in purification technologies, ensuring enhanced product quality and performance. This focus on specialized NMP applications creates a competitive edge, allowing manufacturers to cater to the needs of niche markets. Furthermore, the industry is exploring greener production methods to address growing environmental concerns.
Challenges in the N-Methyl Pyrrolidone Industry Market
The NMP industry faces challenges, including stringent environmental regulations, potential supply chain disruptions due to raw material price volatility, and intense competition from substitute products. These factors can significantly impact production costs and profitability, potentially slowing down market growth. The industry's vulnerability to fluctuating raw material costs poses a substantial risk, requiring manufacturers to optimize their supply chains and explore cost-effective sourcing strategies.
Forces Driving N-Methyl Pyrrolidone Industry Growth
Several factors drive the growth of the NMP industry: rising demand across various application areas, technological innovations in production processes that improve efficiency and sustainability, and supportive government policies fostering industrial growth in key markets. The increasing adoption of NMP in high-growth sectors like electronics and pharmaceuticals further fuels market expansion.
Challenges in the N-Methyl Pyrrolidone Industry Market
Long-term growth will depend on the industry's ability to address environmental concerns, develop sustainable production methods, and innovate new applications for NMP. Collaborations and partnerships focused on research and development will be essential to driving long-term growth. Furthermore, expanding into new and emerging markets will be crucial to sustaining market momentum.
Emerging Opportunities in N-Methyl Pyrrolidone Industry
Emerging opportunities exist in the development of bio-based NMP alternatives, the expansion into new applications (e.g., renewable energy), and the exploration of new markets, especially in developing economies with burgeoning industrial sectors. The increasing demand for sustainable solutions presents a significant opportunity for companies to develop and market eco-friendly NMP alternatives.
Leading Players in the N-Methyl Pyrrolidone Industry Sector
- Prasol Chemicals Limited
- Santa Cruz Biotechnology Inc
- Puyang Guangming Chemical Co Ltd
- Tokyo Chemical Industry Co Ltd
- Hefei TNJ Chemical Industry Co Ltd
- BALAJI AMINES
- Mitsubishi Chemical Corporation
- BYN Chemical Co Ltd
- Ashland
- Binzhou City Zhanhua District Ruian Chemical Co Ltd
- BASF SE
- Ganzhou Zhongneng Industrial Co Ltd
- Eastman Chemical Company
- Shandong Qingyun Changxin Chemical Science-Tech Co Ltd
- LyondellBasell Industries Holdings BV
Key Milestones in N-Methyl Pyrrolidone Industry Industry
- August 2022: BASF SE announced increased specialty pyrrolidone production in North America to meet rising demand in digital inks, coatings, automotive, and agricultural sectors.
- March 2024: Ganzhou Zhongneng Industrial Co. Ltd. announced a planned expansion project, including a 150,000-ton NMP production line, impacting market supply and competition.
Strategic Outlook for N-Methyl Pyrrolidone Industry Market
The NMP market shows significant promise, driven by ongoing technological advancements, expanding applications across diverse sectors, and the increasing adoption of sustainable manufacturing practices. Strategic opportunities include focusing on high-value applications, optimizing supply chains for greater efficiency, and investing in research and development for innovative NMP variants and production methods. The market’s future hinges on successfully navigating environmental regulations and fostering collaborations for technological progress.
N-Methyl Pyrrolidone Industry Segmentation
-
1. Application
- 1.1. Oil and Gas
- 1.2. Pharmaceuticals
- 1.3. Paints and Coatings
- 1.4. Electronics
- 1.5. Agrochemicals
- 1.6. Other Applications
N-Methyl Pyrrolidone Industry Segmentation By Geography
-
1. Asia Pacific
- 1.1. China
- 1.2. India
- 1.3. Japan
- 1.4. South Korea
- 1.5. Malaysia
- 1.6. Thailand
- 1.7. Indonesia
- 1.8. Vietnam
- 1.9. Rest of Asia Pacific
-
2. North America
- 2.1. United States
- 2.2. Canada
- 2.3. Mexico
-
3. Europe
- 3.1. Germany
- 3.2. United Kingdom
- 3.3. Italy
- 3.4. France
- 3.5. Spain
- 3.6. Nordic Countries
- 3.7. Russia
- 3.8. Rest of Europe
-
4. South America
- 4.1. Brazil
- 4.2. Argentina
- 4.3. Colombia
- 4.4. Rest of South America
-
5. Middle East and Africa
- 5.1. Saudi Arabia
- 5.2. Qatar
- 5.3. United Arab Emirates
- 5.4. Nigeria
- 5.5. South Africa
- 5.6. Rest of MEA
N-Methyl Pyrrolidone Industry Regional Market Share
Geographic Coverage of N-Methyl Pyrrolidone Industry
N-Methyl Pyrrolidone Industry REPORT HIGHLIGHTS
| Aspects | Details |
|---|---|
| Study Period | 2020-2034 |
| Base Year | 2025 |
| Estimated Year | 2026 |
| Forecast Period | 2026-2034 |
| Historical Period | 2020-2025 |
| Growth Rate | CAGR of > 4.00% from 2020-2034 |
| Segmentation |
|
Table of Contents
- 1. Introduction
- 1.1. Research Scope
- 1.2. Market Segmentation
- 1.3. Research Objective
- 1.4. Definitions and Assumptions
- 2. Executive Summary
- 2.1. Market Snapshot
- 3. Market Dynamics
- 3.1. Market Drivers
- 3.2. Market Restrains
- 3.3. Market Trends
- 3.4. Market Opportunities
- 4. Market Factor Analysis
- 4.1. Porters Five Forces
- 4.1.1. Bargaining Power of Suppliers
- 4.1.2. Bargaining Power of Buyers
- 4.1.3. Threat of New Entrants
- 4.1.4. Threat of Substitutes
- 4.1.5. Competitive Rivalry
- 4.2. PESTEL analysis
- 4.3. BCG Analysis
- 4.3.1. Stars (High Growth, High Market Share)
- 4.3.2. Cash Cows (Low Growth, High Market Share)
- 4.3.3. Question Mark (High Growth, Low Market Share)
- 4.3.4. Dogs (Low Growth, Low Market Share)
- 4.4. Ansoff Matrix Analysis
- 4.5. Supply Chain Analysis
- 4.6. Regulatory Landscape
- 4.7. Current Market Potential and Opportunity Assessment (TAM–SAM–SOM Framework)
- 4.8. MSR Analyst Note
- 4.1. Porters Five Forces
- 5. Market Analysis, Insights and Forecast 2021-2033
- 5.1. Market Analysis, Insights and Forecast - by Application
- 5.1.1. Oil and Gas
- 5.1.2. Pharmaceuticals
- 5.1.3. Paints and Coatings
- 5.1.4. Electronics
- 5.1.5. Agrochemicals
- 5.1.6. Other Applications
- 5.2. Market Analysis, Insights and Forecast - by Region
- 5.2.1. Asia Pacific
- 5.2.2. North America
- 5.2.3. Europe
- 5.2.4. South America
- 5.2.5. Middle East and Africa
- 5.1. Market Analysis, Insights and Forecast - by Application
- 6. Global N-Methyl Pyrrolidone Industry Analysis, Insights and Forecast, 2021-2033
- 6.1. Market Analysis, Insights and Forecast - by Application
- 6.1.1. Oil and Gas
- 6.1.2. Pharmaceuticals
- 6.1.3. Paints and Coatings
- 6.1.4. Electronics
- 6.1.5. Agrochemicals
- 6.1.6. Other Applications
- 6.1. Market Analysis, Insights and Forecast - by Application
- 7. Asia Pacific N-Methyl Pyrrolidone Industry Analysis, Insights and Forecast, 2020-2032
- 7.1. Market Analysis, Insights and Forecast - by Application
- 7.1.1. Oil and Gas
- 7.1.2. Pharmaceuticals
- 7.1.3. Paints and Coatings
- 7.1.4. Electronics
- 7.1.5. Agrochemicals
- 7.1.6. Other Applications
- 7.1. Market Analysis, Insights and Forecast - by Application
- 8. North America N-Methyl Pyrrolidone Industry Analysis, Insights and Forecast, 2020-2032
- 8.1. Market Analysis, Insights and Forecast - by Application
- 8.1.1. Oil and Gas
- 8.1.2. Pharmaceuticals
- 8.1.3. Paints and Coatings
- 8.1.4. Electronics
- 8.1.5. Agrochemicals
- 8.1.6. Other Applications
- 8.1. Market Analysis, Insights and Forecast - by Application
- 9. Europe N-Methyl Pyrrolidone Industry Analysis, Insights and Forecast, 2020-2032
- 9.1. Market Analysis, Insights and Forecast - by Application
- 9.1.1. Oil and Gas
- 9.1.2. Pharmaceuticals
- 9.1.3. Paints and Coatings
- 9.1.4. Electronics
- 9.1.5. Agrochemicals
- 9.1.6. Other Applications
- 9.1. Market Analysis, Insights and Forecast - by Application
- 10. South America N-Methyl Pyrrolidone Industry Analysis, Insights and Forecast, 2020-2032
- 10.1. Market Analysis, Insights and Forecast - by Application
- 10.1.1. Oil and Gas
- 10.1.2. Pharmaceuticals
- 10.1.3. Paints and Coatings
- 10.1.4. Electronics
- 10.1.5. Agrochemicals
- 10.1.6. Other Applications
- 10.1. Market Analysis, Insights and Forecast - by Application
- 11. Middle East and Africa N-Methyl Pyrrolidone Industry Analysis, Insights and Forecast, 2020-2032
- 11.1. Market Analysis, Insights and Forecast - by Application
- 11.1.1. Oil and Gas
- 11.1.2. Pharmaceuticals
- 11.1.3. Paints and Coatings
- 11.1.4. Electronics
- 11.1.5. Agrochemicals
- 11.1.6. Other Applications
- 11.1. Market Analysis, Insights and Forecast - by Application
- 12. Competitive Analysis
- 12.1. Company Profiles
- 12.1.1 Prasol Chemicals Limited
- 12.1.1.1. Company Overview
- 12.1.1.2. Products
- 12.1.1.3. Company Financials
- 12.1.1.4. SWOT Analysis
- 12.1.2 Santa Cruz Biotechnology Inc
- 12.1.2.1. Company Overview
- 12.1.2.2. Products
- 12.1.2.3. Company Financials
- 12.1.2.4. SWOT Analysis
- 12.1.3 Puyang Guangming Chemical Co Ltd
- 12.1.3.1. Company Overview
- 12.1.3.2. Products
- 12.1.3.3. Company Financials
- 12.1.3.4. SWOT Analysis
- 12.1.4 Tokyo Chemical Industry Co Ltd*List Not Exhaustive
- 12.1.4.1. Company Overview
- 12.1.4.2. Products
- 12.1.4.3. Company Financials
- 12.1.4.4. SWOT Analysis
- 12.1.5 Hefei TNJ Chemical Industry Co Ltd
- 12.1.5.1. Company Overview
- 12.1.5.2. Products
- 12.1.5.3. Company Financials
- 12.1.5.4. SWOT Analysis
- 12.1.6 BALAJI AMINES
- 12.1.6.1. Company Overview
- 12.1.6.2. Products
- 12.1.6.3. Company Financials
- 12.1.6.4. SWOT Analysis
- 12.1.7 Mitsubishi Chemical Corporation
- 12.1.7.1. Company Overview
- 12.1.7.2. Products
- 12.1.7.3. Company Financials
- 12.1.7.4. SWOT Analysis
- 12.1.8 BYN Chemical Co Ltd
- 12.1.8.1. Company Overview
- 12.1.8.2. Products
- 12.1.8.3. Company Financials
- 12.1.8.4. SWOT Analysis
- 12.1.9 Ashland
- 12.1.9.1. Company Overview
- 12.1.9.2. Products
- 12.1.9.3. Company Financials
- 12.1.9.4. SWOT Analysis
- 12.1.10 Binzhou City Zhanhua District Ruian Chemical Co Ltd
- 12.1.10.1. Company Overview
- 12.1.10.2. Products
- 12.1.10.3. Company Financials
- 12.1.10.4. SWOT Analysis
- 12.1.11 BASF SE
- 12.1.11.1. Company Overview
- 12.1.11.2. Products
- 12.1.11.3. Company Financials
- 12.1.11.4. SWOT Analysis
- 12.1.12 Ganzhou Zhongneng Industrial Co Ltd
- 12.1.12.1. Company Overview
- 12.1.12.2. Products
- 12.1.12.3. Company Financials
- 12.1.12.4. SWOT Analysis
- 12.1.13 Eastman Chemical Company
- 12.1.13.1. Company Overview
- 12.1.13.2. Products
- 12.1.13.3. Company Financials
- 12.1.13.4. SWOT Analysis
- 12.1.14 Shandong Qingyun Changxin Chemical Science-Tech Co Ltd
- 12.1.14.1. Company Overview
- 12.1.14.2. Products
- 12.1.14.3. Company Financials
- 12.1.14.4. SWOT Analysis
- 12.1.15 LyondellBasell Industries Holdings BV
- 12.1.15.1. Company Overview
- 12.1.15.2. Products
- 12.1.15.3. Company Financials
- 12.1.15.4. SWOT Analysis
- 12.1.1 Prasol Chemicals Limited
- 12.2. Market Entropy
- 12.2.1 Company's Key Areas Served
- 12.2.2 Recent Developments
- 12.3. Company Market Share Analysis 2025
- 12.3.1 Top 5 Companies Market Share Analysis
- 12.3.2 Top 3 Companies Market Share Analysis
- 12.4. List of Potential Customers
- 13. Research Methodology
List of Figures
- Figure 1: Global N-Methyl Pyrrolidone Industry Revenue Breakdown (Million, %) by Region 2025 & 2033
- Figure 2: Global N-Methyl Pyrrolidone Industry Volume Breakdown (K Tons, %) by Region 2025 & 2033
- Figure 3: Asia Pacific N-Methyl Pyrrolidone Industry Revenue (Million), by Application 2025 & 2033
- Figure 4: Asia Pacific N-Methyl Pyrrolidone Industry Volume (K Tons), by Application 2025 & 2033
- Figure 5: Asia Pacific N-Methyl Pyrrolidone Industry Revenue Share (%), by Application 2025 & 2033
- Figure 6: Asia Pacific N-Methyl Pyrrolidone Industry Volume Share (%), by Application 2025 & 2033
- Figure 7: Asia Pacific N-Methyl Pyrrolidone Industry Revenue (Million), by Country 2025 & 2033
- Figure 8: Asia Pacific N-Methyl Pyrrolidone Industry Volume (K Tons), by Country 2025 & 2033
- Figure 9: Asia Pacific N-Methyl Pyrrolidone Industry Revenue Share (%), by Country 2025 & 2033
- Figure 10: Asia Pacific N-Methyl Pyrrolidone Industry Volume Share (%), by Country 2025 & 2033
- Figure 11: North America N-Methyl Pyrrolidone Industry Revenue (Million), by Application 2025 & 2033
- Figure 12: North America N-Methyl Pyrrolidone Industry Volume (K Tons), by Application 2025 & 2033
- Figure 13: North America N-Methyl Pyrrolidone Industry Revenue Share (%), by Application 2025 & 2033
- Figure 14: North America N-Methyl Pyrrolidone Industry Volume Share (%), by Application 2025 & 2033
- Figure 15: North America N-Methyl Pyrrolidone Industry Revenue (Million), by Country 2025 & 2033
- Figure 16: North America N-Methyl Pyrrolidone Industry Volume (K Tons), by Country 2025 & 2033
- Figure 17: North America N-Methyl Pyrrolidone Industry Revenue Share (%), by Country 2025 & 2033
- Figure 18: North America N-Methyl Pyrrolidone Industry Volume Share (%), by Country 2025 & 2033
- Figure 19: Europe N-Methyl Pyrrolidone Industry Revenue (Million), by Application 2025 & 2033
- Figure 20: Europe N-Methyl Pyrrolidone Industry Volume (K Tons), by Application 2025 & 2033
- Figure 21: Europe N-Methyl Pyrrolidone Industry Revenue Share (%), by Application 2025 & 2033
- Figure 22: Europe N-Methyl Pyrrolidone Industry Volume Share (%), by Application 2025 & 2033
- Figure 23: Europe N-Methyl Pyrrolidone Industry Revenue (Million), by Country 2025 & 2033
- Figure 24: Europe N-Methyl Pyrrolidone Industry Volume (K Tons), by Country 2025 & 2033
- Figure 25: Europe N-Methyl Pyrrolidone Industry Revenue Share (%), by Country 2025 & 2033
- Figure 26: Europe N-Methyl Pyrrolidone Industry Volume Share (%), by Country 2025 & 2033
- Figure 27: South America N-Methyl Pyrrolidone Industry Revenue (Million), by Application 2025 & 2033
- Figure 28: South America N-Methyl Pyrrolidone Industry Volume (K Tons), by Application 2025 & 2033
- Figure 29: South America N-Methyl Pyrrolidone Industry Revenue Share (%), by Application 2025 & 2033
- Figure 30: South America N-Methyl Pyrrolidone Industry Volume Share (%), by Application 2025 & 2033
- Figure 31: South America N-Methyl Pyrrolidone Industry Revenue (Million), by Country 2025 & 2033
- Figure 32: South America N-Methyl Pyrrolidone Industry Volume (K Tons), by Country 2025 & 2033
- Figure 33: South America N-Methyl Pyrrolidone Industry Revenue Share (%), by Country 2025 & 2033
- Figure 34: South America N-Methyl Pyrrolidone Industry Volume Share (%), by Country 2025 & 2033
- Figure 35: Middle East and Africa N-Methyl Pyrrolidone Industry Revenue (Million), by Application 2025 & 2033
- Figure 36: Middle East and Africa N-Methyl Pyrrolidone Industry Volume (K Tons), by Application 2025 & 2033
- Figure 37: Middle East and Africa N-Methyl Pyrrolidone Industry Revenue Share (%), by Application 2025 & 2033
- Figure 38: Middle East and Africa N-Methyl Pyrrolidone Industry Volume Share (%), by Application 2025 & 2033
- Figure 39: Middle East and Africa N-Methyl Pyrrolidone Industry Revenue (Million), by Country 2025 & 2033
- Figure 40: Middle East and Africa N-Methyl Pyrrolidone Industry Volume (K Tons), by Country 2025 & 2033
- Figure 41: Middle East and Africa N-Methyl Pyrrolidone Industry Revenue Share (%), by Country 2025 & 2033
- Figure 42: Middle East and Africa N-Methyl Pyrrolidone Industry Volume Share (%), by Country 2025 & 2033
List of Tables
- Table 1: Global N-Methyl Pyrrolidone Industry Revenue Million Forecast, by Application 2020 & 2033
- Table 2: Global N-Methyl Pyrrolidone Industry Volume K Tons Forecast, by Application 2020 & 2033
- Table 3: Global N-Methyl Pyrrolidone Industry Revenue Million Forecast, by Region 2020 & 2033
- Table 4: Global N-Methyl Pyrrolidone Industry Volume K Tons Forecast, by Region 2020 & 2033
- Table 5: Global N-Methyl Pyrrolidone Industry Revenue Million Forecast, by Application 2020 & 2033
- Table 6: Global N-Methyl Pyrrolidone Industry Volume K Tons Forecast, by Application 2020 & 2033
- Table 7: Global N-Methyl Pyrrolidone Industry Revenue Million Forecast, by Country 2020 & 2033
- Table 8: Global N-Methyl Pyrrolidone Industry Volume K Tons Forecast, by Country 2020 & 2033
- Table 9: China N-Methyl Pyrrolidone Industry Revenue (Million) Forecast, by Application 2020 & 2033
- Table 10: China N-Methyl Pyrrolidone Industry Volume (K Tons) Forecast, by Application 2020 & 2033
- Table 11: India N-Methyl Pyrrolidone Industry Revenue (Million) Forecast, by Application 2020 & 2033
- Table 12: India N-Methyl Pyrrolidone Industry Volume (K Tons) Forecast, by Application 2020 & 2033
- Table 13: Japan N-Methyl Pyrrolidone Industry Revenue (Million) Forecast, by Application 2020 & 2033
- Table 14: Japan N-Methyl Pyrrolidone Industry Volume (K Tons) Forecast, by Application 2020 & 2033
- Table 15: South Korea N-Methyl Pyrrolidone Industry Revenue (Million) Forecast, by Application 2020 & 2033
- Table 16: South Korea N-Methyl Pyrrolidone Industry Volume (K Tons) Forecast, by Application 2020 & 2033
- Table 17: Malaysia N-Methyl Pyrrolidone Industry Revenue (Million) Forecast, by Application 2020 & 2033
- Table 18: Malaysia N-Methyl Pyrrolidone Industry Volume (K Tons) Forecast, by Application 2020 & 2033
- Table 19: Thailand N-Methyl Pyrrolidone Industry Revenue (Million) Forecast, by Application 2020 & 2033
- Table 20: Thailand N-Methyl Pyrrolidone Industry Volume (K Tons) Forecast, by Application 2020 & 2033
- Table 21: Indonesia N-Methyl Pyrrolidone Industry Revenue (Million) Forecast, by Application 2020 & 2033
- Table 22: Indonesia N-Methyl Pyrrolidone Industry Volume (K Tons) Forecast, by Application 2020 & 2033
- Table 23: Vietnam N-Methyl Pyrrolidone Industry Revenue (Million) Forecast, by Application 2020 & 2033
- Table 24: Vietnam N-Methyl Pyrrolidone Industry Volume (K Tons) Forecast, by Application 2020 & 2033
- Table 25: Rest of Asia Pacific N-Methyl Pyrrolidone Industry Revenue (Million) Forecast, by Application 2020 & 2033
- Table 26: Rest of Asia Pacific N-Methyl Pyrrolidone Industry Volume (K Tons) Forecast, by Application 2020 & 2033
- Table 27: Global N-Methyl Pyrrolidone Industry Revenue Million Forecast, by Application 2020 & 2033
- Table 28: Global N-Methyl Pyrrolidone Industry Volume K Tons Forecast, by Application 2020 & 2033
- Table 29: Global N-Methyl Pyrrolidone Industry Revenue Million Forecast, by Country 2020 & 2033
- Table 30: Global N-Methyl Pyrrolidone Industry Volume K Tons Forecast, by Country 2020 & 2033
- Table 31: United States N-Methyl Pyrrolidone Industry Revenue (Million) Forecast, by Application 2020 & 2033
- Table 32: United States N-Methyl Pyrrolidone Industry Volume (K Tons) Forecast, by Application 2020 & 2033
- Table 33: Canada N-Methyl Pyrrolidone Industry Revenue (Million) Forecast, by Application 2020 & 2033
- Table 34: Canada N-Methyl Pyrrolidone Industry Volume (K Tons) Forecast, by Application 2020 & 2033
- Table 35: Mexico N-Methyl Pyrrolidone Industry Revenue (Million) Forecast, by Application 2020 & 2033
- Table 36: Mexico N-Methyl Pyrrolidone Industry Volume (K Tons) Forecast, by Application 2020 & 2033
- Table 37: Global N-Methyl Pyrrolidone Industry Revenue Million Forecast, by Application 2020 & 2033
- Table 38: Global N-Methyl Pyrrolidone Industry Volume K Tons Forecast, by Application 2020 & 2033
- Table 39: Global N-Methyl Pyrrolidone Industry Revenue Million Forecast, by Country 2020 & 2033
- Table 40: Global N-Methyl Pyrrolidone Industry Volume K Tons Forecast, by Country 2020 & 2033
- Table 41: Germany N-Methyl Pyrrolidone Industry Revenue (Million) Forecast, by Application 2020 & 2033
- Table 42: Germany N-Methyl Pyrrolidone Industry Volume (K Tons) Forecast, by Application 2020 & 2033
- Table 43: United Kingdom N-Methyl Pyrrolidone Industry Revenue (Million) Forecast, by Application 2020 & 2033
- Table 44: United Kingdom N-Methyl Pyrrolidone Industry Volume (K Tons) Forecast, by Application 2020 & 2033
- Table 45: Italy N-Methyl Pyrrolidone Industry Revenue (Million) Forecast, by Application 2020 & 2033
- Table 46: Italy N-Methyl Pyrrolidone Industry Volume (K Tons) Forecast, by Application 2020 & 2033
- Table 47: France N-Methyl Pyrrolidone Industry Revenue (Million) Forecast, by Application 2020 & 2033
- Table 48: France N-Methyl Pyrrolidone Industry Volume (K Tons) Forecast, by Application 2020 & 2033
- Table 49: Spain N-Methyl Pyrrolidone Industry Revenue (Million) Forecast, by Application 2020 & 2033
- Table 50: Spain N-Methyl Pyrrolidone Industry Volume (K Tons) Forecast, by Application 2020 & 2033
- Table 51: Nordic Countries N-Methyl Pyrrolidone Industry Revenue (Million) Forecast, by Application 2020 & 2033
- Table 52: Nordic Countries N-Methyl Pyrrolidone Industry Volume (K Tons) Forecast, by Application 2020 & 2033
- Table 53: Russia N-Methyl Pyrrolidone Industry Revenue (Million) Forecast, by Application 2020 & 2033
- Table 54: Russia N-Methyl Pyrrolidone Industry Volume (K Tons) Forecast, by Application 2020 & 2033
- Table 55: Rest of Europe N-Methyl Pyrrolidone Industry Revenue (Million) Forecast, by Application 2020 & 2033
- Table 56: Rest of Europe N-Methyl Pyrrolidone Industry Volume (K Tons) Forecast, by Application 2020 & 2033
- Table 57: Global N-Methyl Pyrrolidone Industry Revenue Million Forecast, by Application 2020 & 2033
- Table 58: Global N-Methyl Pyrrolidone Industry Volume K Tons Forecast, by Application 2020 & 2033
- Table 59: Global N-Methyl Pyrrolidone Industry Revenue Million Forecast, by Country 2020 & 2033
- Table 60: Global N-Methyl Pyrrolidone Industry Volume K Tons Forecast, by Country 2020 & 2033
- Table 61: Brazil N-Methyl Pyrrolidone Industry Revenue (Million) Forecast, by Application 2020 & 2033
- Table 62: Brazil N-Methyl Pyrrolidone Industry Volume (K Tons) Forecast, by Application 2020 & 2033
- Table 63: Argentina N-Methyl Pyrrolidone Industry Revenue (Million) Forecast, by Application 2020 & 2033
- Table 64: Argentina N-Methyl Pyrrolidone Industry Volume (K Tons) Forecast, by Application 2020 & 2033
- Table 65: Colombia N-Methyl Pyrrolidone Industry Revenue (Million) Forecast, by Application 2020 & 2033
- Table 66: Colombia N-Methyl Pyrrolidone Industry Volume (K Tons) Forecast, by Application 2020 & 2033
- Table 67: Rest of South America N-Methyl Pyrrolidone Industry Revenue (Million) Forecast, by Application 2020 & 2033
- Table 68: Rest of South America N-Methyl Pyrrolidone Industry Volume (K Tons) Forecast, by Application 2020 & 2033
- Table 69: Global N-Methyl Pyrrolidone Industry Revenue Million Forecast, by Application 2020 & 2033
- Table 70: Global N-Methyl Pyrrolidone Industry Volume K Tons Forecast, by Application 2020 & 2033
- Table 71: Global N-Methyl Pyrrolidone Industry Revenue Million Forecast, by Country 2020 & 2033
- Table 72: Global N-Methyl Pyrrolidone Industry Volume K Tons Forecast, by Country 2020 & 2033
- Table 73: Saudi Arabia N-Methyl Pyrrolidone Industry Revenue (Million) Forecast, by Application 2020 & 2033
- Table 74: Saudi Arabia N-Methyl Pyrrolidone Industry Volume (K Tons) Forecast, by Application 2020 & 2033
- Table 75: Qatar N-Methyl Pyrrolidone Industry Revenue (Million) Forecast, by Application 2020 & 2033
- Table 76: Qatar N-Methyl Pyrrolidone Industry Volume (K Tons) Forecast, by Application 2020 & 2033
- Table 77: United Arab Emirates N-Methyl Pyrrolidone Industry Revenue (Million) Forecast, by Application 2020 & 2033
- Table 78: United Arab Emirates N-Methyl Pyrrolidone Industry Volume (K Tons) Forecast, by Application 2020 & 2033
- Table 79: Nigeria N-Methyl Pyrrolidone Industry Revenue (Million) Forecast, by Application 2020 & 2033
- Table 80: Nigeria N-Methyl Pyrrolidone Industry Volume (K Tons) Forecast, by Application 2020 & 2033
- Table 81: South Africa N-Methyl Pyrrolidone Industry Revenue (Million) Forecast, by Application 2020 & 2033
- Table 82: South Africa N-Methyl Pyrrolidone Industry Volume (K Tons) Forecast, by Application 2020 & 2033
- Table 83: Rest of MEA N-Methyl Pyrrolidone Industry Revenue (Million) Forecast, by Application 2020 & 2033
- Table 84: Rest of MEA N-Methyl Pyrrolidone Industry Volume (K Tons) Forecast, by Application 2020 & 2033
Frequently Asked Questions
1. What is the projected Compound Annual Growth Rate (CAGR) of the N-Methyl Pyrrolidone Industry?
The projected CAGR is approximately > 4.00%.
2. Which companies are prominent players in the N-Methyl Pyrrolidone Industry?
Key companies in the market include Prasol Chemicals Limited, Santa Cruz Biotechnology Inc, Puyang Guangming Chemical Co Ltd, Tokyo Chemical Industry Co Ltd*List Not Exhaustive, Hefei TNJ Chemical Industry Co Ltd, BALAJI AMINES, Mitsubishi Chemical Corporation, BYN Chemical Co Ltd, Ashland, Binzhou City Zhanhua District Ruian Chemical Co Ltd, BASF SE, Ganzhou Zhongneng Industrial Co Ltd, Eastman Chemical Company, Shandong Qingyun Changxin Chemical Science-Tech Co Ltd, LyondellBasell Industries Holdings BV.
3. What are the main segments of the N-Methyl Pyrrolidone Industry?
The market segments include Application.
4. Can you provide details about the market size?
The market size is estimated to be USD 1.03 Million as of 2022.
5. What are some drivers contributing to market growth?
Growing Demand From the Electronics Industry; Increasing Usage in the Pharmaceutical Industry.
6. What are the notable trends driving market growth?
Increasing Demand from Electronics Segment.
7. Are there any restraints impacting market growth?
N-methyl Pyrrolidone Hazards and Its Greener Alternatives.
8. Can you provide examples of recent developments in the market?
March 2024: Ganzhou Municipal Administration for Industry and Commerce announced the planned acceptance of the environmental impact assessment file for Ganzhou Zhongneng Industrial Co. Ltd, including the planned 150,000-ton NMP, 30,000-ton GBL, and 20,000-ton 2P expansion project. The company is expected to build a 50,000-ton NMP synthetic production line and a 50,000-ton NMP recovery refining production line.
9. What pricing options are available for accessing the report?
Pricing options include single-user, multi-user, and enterprise licenses priced at USD 4750, USD 5250, and USD 8750 respectively.
10. Is the market size provided in terms of value or volume?
The market size is provided in terms of value, measured in Million and volume, measured in K Tons.
11. Are there any specific market keywords associated with the report?
Yes, the market keyword associated with the report is "N-Methyl Pyrrolidone Industry," which aids in identifying and referencing the specific market segment covered.
12. How do I determine which pricing option suits my needs best?
The pricing options vary based on user requirements and access needs. Individual users may opt for single-user licenses, while businesses requiring broader access may choose multi-user or enterprise licenses for cost-effective access to the report.
13. Are there any additional resources or data provided in the N-Methyl Pyrrolidone Industry report?
While the report offers comprehensive insights, it's advisable to review the specific contents or supplementary materials provided to ascertain if additional resources or data are available.
14. How can I stay updated on further developments or reports in the N-Methyl Pyrrolidone Industry?
To stay informed about further developments, trends, and reports in the N-Methyl Pyrrolidone Industry, consider subscribing to industry newsletters, following relevant companies and organizations, or regularly checking reputable industry news sources and publications.
Methodology
Step 1 - Identification of Relevant Samples Size from Population Database


Step 2 - Approaches for Defining Global Market Size (Value, Volume* & Price*)

Note*: In applicable scenarios
Step 3 - Data Sources
Primary Research
- Web Analytics
- Survey Reports
- Research Institute
- Latest Research Reports
- Opinion Leaders
Secondary Research
- Annual Reports
- White Paper
- Latest Press Release
- Industry Association
- Paid Database
- Investor Presentations

Step 4 - Data Triangulation
Involves using different sources of information in order to increase the validity of a study
These sources are likely to be stakeholders in a program - participants, other researchers, program staff, other community members, and so on.
Then we put all data in single framework & apply various statistical tools to find out the dynamic on the market.
During the analysis stage, feedback from the stakeholder groups would be compared to determine areas of agreement as well as areas of divergence