

Key Insights
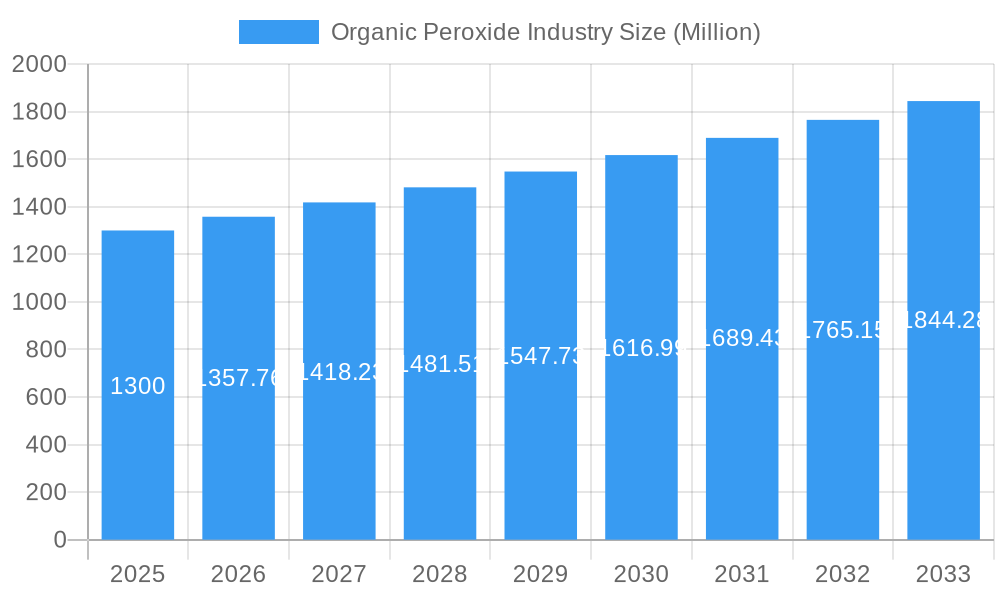
The global organic peroxide market, valued at $1.30 billion in 2025, is projected to experience robust growth, driven by a Compound Annual Growth Rate (CAGR) of 4.44% from 2025 to 2033. This expansion is fueled by increasing demand across diverse applications, particularly in the polymers and rubber industry, where organic peroxides act as crucial initiators in polymerization processes. The rising construction and automotive sectors, which are significant consumers of polymers and rubber, further bolster market growth. Simultaneously, the growing popularity of coatings and adhesives, another key application segment, contributes to the market's positive trajectory. Technological advancements leading to the development of more efficient and environmentally friendly organic peroxides are also contributing factors. However, stringent regulations concerning the handling and storage of these potentially hazardous chemicals present a key restraint, necessitating the adoption of advanced safety measures and impacting overall market expansion. Furthermore, price fluctuations in raw materials can influence production costs and affect market dynamics. The market is segmented by application (polymers and rubber, coatings and adhesives, paper and textile, cosmetics, healthcare, others) and type (diacyl peroxides, ketone peroxides, percarbonates, benzoyl peroxide, dialkyl peroxides, hydro-peroxides, peroxyesters, others), offering diverse opportunities for market players. Geographical analysis reveals strong growth potential in Asia-Pacific, driven primarily by increasing industrialization and economic growth in major economies like China and India.
Organic Peroxide Industry Market Size (In Billion)
The competitive landscape is relatively fragmented, with several key players vying for market share. Companies such as Nouryon, Arkema Group, and NOF Corporation are established players leveraging their technological expertise and extensive distribution networks. However, the market also presents opportunities for smaller companies specializing in niche applications or geographic regions. The forecast period (2025-2033) suggests a continued expansion of the market, driven by the factors mentioned above, but also contingent on factors such as global economic stability and technological breakthroughs within the chemical industry. Successfully navigating regulatory hurdles and effectively managing raw material costs will be crucial for companies seeking sustained success in this dynamic market.
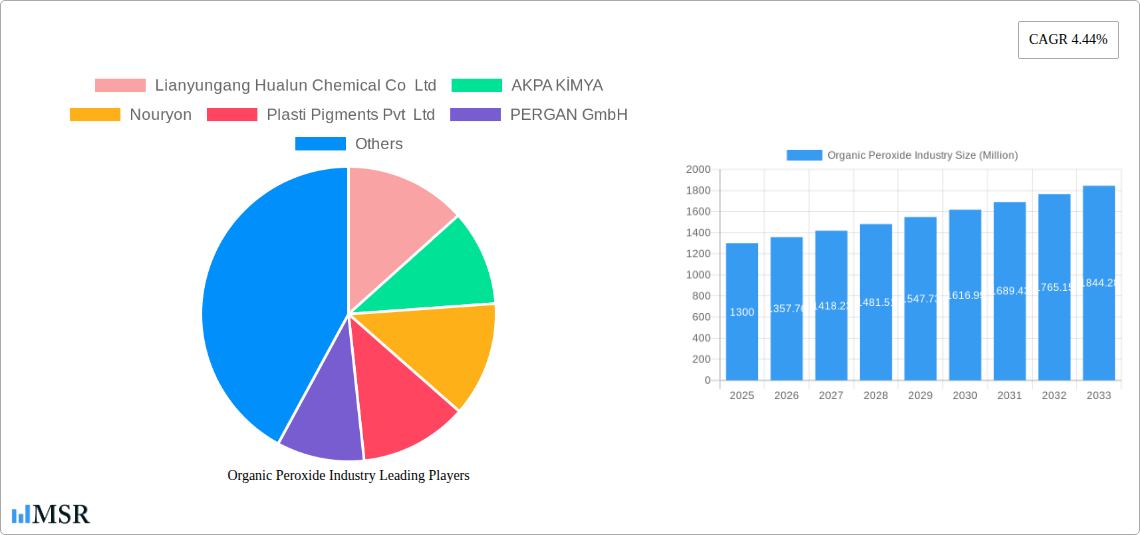
Organic Peroxide Industry Company Market Share
Organic Peroxide Industry Market Report: 2019-2033
This comprehensive report provides a detailed analysis of the global organic peroxide industry, covering market size, segmentation, key players, and future trends. With a study period spanning 2019-2033, a base year of 2025, and a forecast period of 2025-2033, this report offers actionable insights for industry stakeholders, investors, and businesses seeking to navigate this dynamic market. The report's value surpasses $xx Million in 2025 and is projected to reach $xx Million by 2033, exhibiting a CAGR of xx%.
Organic Peroxide Industry Market Concentration & Dynamics
The organic peroxide market exhibits a moderately concentrated structure, with several major players holding significant market share. Key players such as Arkema Group, Nouryon, and United Initiators dominate the landscape, while regional players like Lianyungang Hualun Chemical Co Ltd and Chinasun Specialty Products Co Ltd hold substantial shares in their respective markets. The industry is characterized by a dynamic innovation ecosystem, with ongoing R&D efforts focused on developing new product types and applications.
- Market Share: Arkema Group holds approximately xx% market share, followed by Nouryon at xx%, and United Initiators at xx%. The remaining share is distributed among other players listed above, with many holding a smaller percentage individually.
- M&A Activity: The industry has witnessed xx M&A deals in the historical period (2019-2024), primarily focused on expanding product portfolios and geographic reach. The average deal value stands at approximately $xx Million.
- Regulatory Landscape: Stringent regulations concerning the handling and transportation of organic peroxides pose a challenge, but also drive innovation in safer handling technologies. This includes adherence to GHS (Globally Harmonized System of Classification and Labelling of Chemicals) and other regional regulations.
- Substitute Products: The industry faces competition from alternative curing agents and initiators, but the unique properties of organic peroxides in specific applications ensure sustained demand.
- End-User Trends: Growing demand from the polymers and rubber industry, coupled with expanding applications in coatings and adhesives, is a primary growth driver. The healthcare and cosmetics sectors are also showing increased usage.
Organic Peroxide Industry Industry Insights & Trends
The organic peroxide market is experiencing robust growth driven by expanding applications in various end-use industries. The global market size was valued at $xx Million in 2024 and is projected to reach $xx Million by 2033. Key factors driving this growth include increasing demand from the construction, automotive, and packaging industries, as well as advancements in technology leading to the development of high-performance organic peroxides. The market shows a steady CAGR of xx% during the forecast period (2025-2033). Technological advancements like the development of more efficient and environmentally friendly production processes, coupled with stringent safety regulations, are influencing market trends. Furthermore, evolving consumer preferences for sustainable and high-performance products are also shaping the industry's trajectory.
Key Markets & Segments Leading Organic Peroxide Industry
The Polymers and Rubber segment represents the largest application segment, accounting for approximately xx% of the market. Geographically, Asia-Pacific dominates the global market, driven by rapid industrialization and infrastructure development in countries like China and India.
Application Segment Drivers:
- Polymers and Rubber: Rapid growth in the automotive and construction sectors fuels demand.
- Coatings and Adhesives: Increasing use in construction, packaging, and industrial applications drives growth.
- Paper and Textile: Demand is influenced by rising consumption of paper products and textiles.
- Cosmetics: Growing demand for high-quality cosmetics with improved performance and stability.
- Healthcare: Increased demand for specialized organic peroxides in medical devices and pharmaceuticals.
Type Segment Dominance: Benzoyl peroxide and dialkyl peroxides are the leading product types due to their wide range of applications and established market presence. However, increasing demand for environmentally friendly alternatives is driving innovation in percarbonates and other peroxide types.
Organic Peroxide Industry Product Developments
Recent product innovations focus on developing organic peroxides with enhanced performance characteristics, such as improved thermal stability, lower toxicity, and better efficiency. This includes the introduction of novel formulations designed for specific applications, leading to improved product quality and reduced environmental impact. Companies are actively investing in R&D to develop sustainable and high-performance organic peroxides to meet the evolving needs of the market.
Challenges in the Organic Peroxide Industry Market
The organic peroxide industry faces several challenges, including stringent safety regulations, volatile raw material prices, and the inherent hazardous nature of the products, leading to high production and transportation costs. Supply chain disruptions and intense competition from alternative curing agents also impact market dynamics. These factors can significantly affect profitability and market growth.
Forces Driving Organic Peroxide Industry Growth
Key growth drivers include increasing demand from various end-use industries, particularly the construction and automotive sectors, coupled with ongoing technological advancements in product development and production processes. Government initiatives promoting industrial growth in emerging economies, coupled with increasing investments in research and development activities, contribute to the market expansion. Additionally, the rising demand for high-performance materials across several industrial sectors is a significant growth catalyst.
Long-Term Growth Catalysts in the Organic Peroxide Industry
Long-term growth will be fueled by continuous innovation in product development, strategic partnerships to expand market reach, and exploration of new applications in emerging markets. Companies are focusing on developing specialized organic peroxides tailored to specific industry needs, thereby improving market penetration and product differentiation.
Emerging Opportunities in Organic Peroxide Industry
Emerging opportunities lie in developing environmentally friendly and sustainable organic peroxides, expanding into new applications, and penetrating emerging markets. The focus on bio-based and renewable raw materials, coupled with increased demand for higher-performance and more sustainable products, presents attractive opportunities for growth.
Leading Players in the Organic Peroxide Industry Sector
- Lianyungang Hualun Chemical Co Ltd
- AKPA KİMYA
- Nouryon
- Plasti Pigments Pvt Ltd
- PERGAN GmbH
- Novichem Spzoo
- United Initiators
- Kawaguchi Chemical Co Ltd
- MPI Chemie BV
- ACE CHEMICAL CORP
- Arkema Group
- NOF CORPORATION
- Chinasun Specialty Products Co Ltd
Key Milestones in Organic Peroxide Industry Industry
- October 2022: Arkema reorganizes the distribution of its Luperox and Retic organic peroxides in several European countries. This strategic move aims to enhance market reach and customer service.
- July 2022: United Initiators completes a new TBHP-TBA facility in China, expanding its production capacity and product portfolio. This marks a significant step in strengthening the company's presence in the Asian market.
Strategic Outlook for Organic Peroxide Industry Market
The organic peroxide industry is poised for continued growth, driven by strong demand from key end-use sectors and ongoing technological advancements. Strategic opportunities lie in developing innovative products, expanding into new applications, and forming strategic partnerships to enhance market reach and profitability. The focus on sustainability and environmental concerns will also shape future market dynamics.
Organic Peroxide Industry Segmentation
-
1. Type
- 1.1. Diacyl Peroxides
- 1.2. Ketone Peroxides
- 1.3. Percarbonates
- 1.4. Benzoyl Peroxide
- 1.5. Dialkyl Peroxides
- 1.6. Hydro-Peroxides
- 1.7. Peroxyesters
- 1.8. Other Types
-
2. Application
- 2.1. Polymers and Rubber
- 2.2. Coatings and Adhesives
- 2.3. Paper and Textile
- 2.4. Cosmetics
- 2.5. Healthcare
- 2.6. Other Applications
Organic Peroxide Industry Segmentation By Geography
-
1. Asia Pacific
- 1.1. China
- 1.2. India
- 1.3. Japan
- 1.4. South Korea
- 1.5. Rest of Asia Pacific
-
2. North America
- 2.1. United States
- 2.2. Canada
- 2.3. Mexico
-
3. Europe
- 3.1. Germany
- 3.2. United Kingdom
- 3.3. Italy
- 3.4. France
- 3.5. Spain
- 3.6. Rest of Europe
-
4. South America
- 4.1. Brazil
- 4.2. Argentina
- 4.3. Rest of South America
-
5. Middle East and Africa
- 5.1. Saudi Arabia
- 5.2. South Africa
- 5.3. Rest of Middle East and Africa
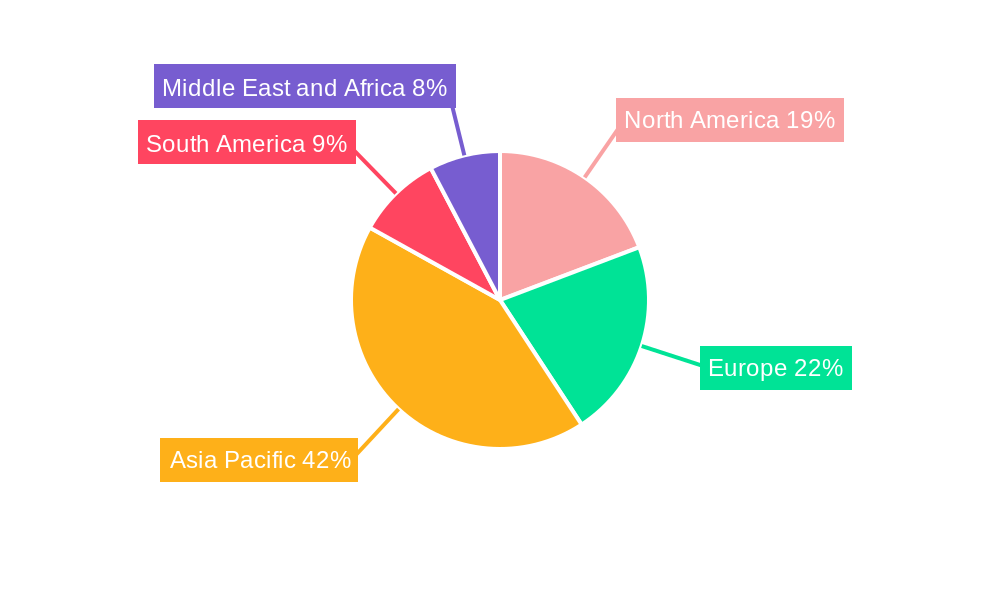
Organic Peroxide Industry Regional Market Share
Geographic Coverage of Organic Peroxide Industry
Organic Peroxide Industry REPORT HIGHLIGHTS
| Aspects | Details |
|---|---|
| Study Period | 2020-2034 |
| Base Year | 2025 |
| Estimated Year | 2026 |
| Forecast Period | 2026-2034 |
| Historical Period | 2020-2025 |
| Growth Rate | CAGR of 4.44% from 2020-2034 |
| Segmentation |
|
Table of Contents
- 1. Introduction
- 1.1. Research Scope
- 1.2. Market Segmentation
- 1.3. Research Objective
- 1.4. Definitions and Assumptions
- 2. Executive Summary
- 2.1. Market Snapshot
- 3. Market Dynamics
- 3.1. Market Drivers
- 3.2. Market Restrains
- 3.3. Market Trends
- 3.4. Market Opportunities
- 4. Market Factor Analysis
- 4.1. Porters Five Forces
- 4.1.1. Bargaining Power of Suppliers
- 4.1.2. Bargaining Power of Buyers
- 4.1.3. Threat of New Entrants
- 4.1.4. Threat of Substitutes
- 4.1.5. Competitive Rivalry
- 4.2. PESTEL analysis
- 4.3. BCG Analysis
- 4.3.1. Stars (High Growth, High Market Share)
- 4.3.2. Cash Cows (Low Growth, High Market Share)
- 4.3.3. Question Mark (High Growth, Low Market Share)
- 4.3.4. Dogs (Low Growth, Low Market Share)
- 4.4. Ansoff Matrix Analysis
- 4.5. Supply Chain Analysis
- 4.6. Regulatory Landscape
- 4.7. Current Market Potential and Opportunity Assessment (TAM–SAM–SOM Framework)
- 4.8. MSR Analyst Note
- 4.1. Porters Five Forces
- 5. Market Analysis, Insights and Forecast 2021-2033
- 5.1. Market Analysis, Insights and Forecast - by Type
- 5.1.1. Diacyl Peroxides
- 5.1.2. Ketone Peroxides
- 5.1.3. Percarbonates
- 5.1.4. Benzoyl Peroxide
- 5.1.5. Dialkyl Peroxides
- 5.1.6. Hydro-Peroxides
- 5.1.7. Peroxyesters
- 5.1.8. Other Types
- 5.2. Market Analysis, Insights and Forecast - by Application
- 5.2.1. Polymers and Rubber
- 5.2.2. Coatings and Adhesives
- 5.2.3. Paper and Textile
- 5.2.4. Cosmetics
- 5.2.5. Healthcare
- 5.2.6. Other Applications
- 5.3. Market Analysis, Insights and Forecast - by Region
- 5.3.1. Asia Pacific
- 5.3.2. North America
- 5.3.3. Europe
- 5.3.4. South America
- 5.3.5. Middle East and Africa
- 5.1. Market Analysis, Insights and Forecast - by Type
- 6. Global Organic Peroxide Industry Analysis, Insights and Forecast, 2021-2033
- 6.1. Market Analysis, Insights and Forecast - by Type
- 6.1.1. Diacyl Peroxides
- 6.1.2. Ketone Peroxides
- 6.1.3. Percarbonates
- 6.1.4. Benzoyl Peroxide
- 6.1.5. Dialkyl Peroxides
- 6.1.6. Hydro-Peroxides
- 6.1.7. Peroxyesters
- 6.1.8. Other Types
- 6.2. Market Analysis, Insights and Forecast - by Application
- 6.2.1. Polymers and Rubber
- 6.2.2. Coatings and Adhesives
- 6.2.3. Paper and Textile
- 6.2.4. Cosmetics
- 6.2.5. Healthcare
- 6.2.6. Other Applications
- 6.1. Market Analysis, Insights and Forecast - by Type
- 7. Asia Pacific Organic Peroxide Industry Analysis, Insights and Forecast, 2020-2032
- 7.1. Market Analysis, Insights and Forecast - by Type
- 7.1.1. Diacyl Peroxides
- 7.1.2. Ketone Peroxides
- 7.1.3. Percarbonates
- 7.1.4. Benzoyl Peroxide
- 7.1.5. Dialkyl Peroxides
- 7.1.6. Hydro-Peroxides
- 7.1.7. Peroxyesters
- 7.1.8. Other Types
- 7.2. Market Analysis, Insights and Forecast - by Application
- 7.2.1. Polymers and Rubber
- 7.2.2. Coatings and Adhesives
- 7.2.3. Paper and Textile
- 7.2.4. Cosmetics
- 7.2.5. Healthcare
- 7.2.6. Other Applications
- 7.1. Market Analysis, Insights and Forecast - by Type
- 8. North America Organic Peroxide Industry Analysis, Insights and Forecast, 2020-2032
- 8.1. Market Analysis, Insights and Forecast - by Type
- 8.1.1. Diacyl Peroxides
- 8.1.2. Ketone Peroxides
- 8.1.3. Percarbonates
- 8.1.4. Benzoyl Peroxide
- 8.1.5. Dialkyl Peroxides
- 8.1.6. Hydro-Peroxides
- 8.1.7. Peroxyesters
- 8.1.8. Other Types
- 8.2. Market Analysis, Insights and Forecast - by Application
- 8.2.1. Polymers and Rubber
- 8.2.2. Coatings and Adhesives
- 8.2.3. Paper and Textile
- 8.2.4. Cosmetics
- 8.2.5. Healthcare
- 8.2.6. Other Applications
- 8.1. Market Analysis, Insights and Forecast - by Type
- 9. Europe Organic Peroxide Industry Analysis, Insights and Forecast, 2020-2032
- 9.1. Market Analysis, Insights and Forecast - by Type
- 9.1.1. Diacyl Peroxides
- 9.1.2. Ketone Peroxides
- 9.1.3. Percarbonates
- 9.1.4. Benzoyl Peroxide
- 9.1.5. Dialkyl Peroxides
- 9.1.6. Hydro-Peroxides
- 9.1.7. Peroxyesters
- 9.1.8. Other Types
- 9.2. Market Analysis, Insights and Forecast - by Application
- 9.2.1. Polymers and Rubber
- 9.2.2. Coatings and Adhesives
- 9.2.3. Paper and Textile
- 9.2.4. Cosmetics
- 9.2.5. Healthcare
- 9.2.6. Other Applications
- 9.1. Market Analysis, Insights and Forecast - by Type
- 10. South America Organic Peroxide Industry Analysis, Insights and Forecast, 2020-2032
- 10.1. Market Analysis, Insights and Forecast - by Type
- 10.1.1. Diacyl Peroxides
- 10.1.2. Ketone Peroxides
- 10.1.3. Percarbonates
- 10.1.4. Benzoyl Peroxide
- 10.1.5. Dialkyl Peroxides
- 10.1.6. Hydro-Peroxides
- 10.1.7. Peroxyesters
- 10.1.8. Other Types
- 10.2. Market Analysis, Insights and Forecast - by Application
- 10.2.1. Polymers and Rubber
- 10.2.2. Coatings and Adhesives
- 10.2.3. Paper and Textile
- 10.2.4. Cosmetics
- 10.2.5. Healthcare
- 10.2.6. Other Applications
- 10.1. Market Analysis, Insights and Forecast - by Type
- 11. Middle East and Africa Organic Peroxide Industry Analysis, Insights and Forecast, 2020-2032
- 11.1. Market Analysis, Insights and Forecast - by Type
- 11.1.1. Diacyl Peroxides
- 11.1.2. Ketone Peroxides
- 11.1.3. Percarbonates
- 11.1.4. Benzoyl Peroxide
- 11.1.5. Dialkyl Peroxides
- 11.1.6. Hydro-Peroxides
- 11.1.7. Peroxyesters
- 11.1.8. Other Types
- 11.2. Market Analysis, Insights and Forecast - by Application
- 11.2.1. Polymers and Rubber
- 11.2.2. Coatings and Adhesives
- 11.2.3. Paper and Textile
- 11.2.4. Cosmetics
- 11.2.5. Healthcare
- 11.2.6. Other Applications
- 11.1. Market Analysis, Insights and Forecast - by Type
- 12. Competitive Analysis
- 12.1. Company Profiles
- 12.1.1 Lianyungang Hualun Chemical Co Ltd
- 12.1.1.1. Company Overview
- 12.1.1.2. Products
- 12.1.1.3. Company Financials
- 12.1.1.4. SWOT Analysis
- 12.1.2 AKPA KİMYA
- 12.1.2.1. Company Overview
- 12.1.2.2. Products
- 12.1.2.3. Company Financials
- 12.1.2.4. SWOT Analysis
- 12.1.3 Nouryon
- 12.1.3.1. Company Overview
- 12.1.3.2. Products
- 12.1.3.3. Company Financials
- 12.1.3.4. SWOT Analysis
- 12.1.4 Plasti Pigments Pvt Ltd
- 12.1.4.1. Company Overview
- 12.1.4.2. Products
- 12.1.4.3. Company Financials
- 12.1.4.4. SWOT Analysis
- 12.1.5 PERGAN GmbH
- 12.1.5.1. Company Overview
- 12.1.5.2. Products
- 12.1.5.3. Company Financials
- 12.1.5.4. SWOT Analysis
- 12.1.6 Novichem Spzoo
- 12.1.6.1. Company Overview
- 12.1.6.2. Products
- 12.1.6.3. Company Financials
- 12.1.6.4. SWOT Analysis
- 12.1.7 United Initiators*List Not Exhaustive
- 12.1.7.1. Company Overview
- 12.1.7.2. Products
- 12.1.7.3. Company Financials
- 12.1.7.4. SWOT Analysis
- 12.1.8 Kawaguchi Chemical Co Ltd
- 12.1.8.1. Company Overview
- 12.1.8.2. Products
- 12.1.8.3. Company Financials
- 12.1.8.4. SWOT Analysis
- 12.1.9 MPI Chemie BV
- 12.1.9.1. Company Overview
- 12.1.9.2. Products
- 12.1.9.3. Company Financials
- 12.1.9.4. SWOT Analysis
- 12.1.10 ACE CHEMICAL CORP
- 12.1.10.1. Company Overview
- 12.1.10.2. Products
- 12.1.10.3. Company Financials
- 12.1.10.4. SWOT Analysis
- 12.1.11 Arkema Group
- 12.1.11.1. Company Overview
- 12.1.11.2. Products
- 12.1.11.3. Company Financials
- 12.1.11.4. SWOT Analysis
- 12.1.12 NOF CORPORATION
- 12.1.12.1. Company Overview
- 12.1.12.2. Products
- 12.1.12.3. Company Financials
- 12.1.12.4. SWOT Analysis
- 12.1.13 Chinasun Specialty Products Co Ltd
- 12.1.13.1. Company Overview
- 12.1.13.2. Products
- 12.1.13.3. Company Financials
- 12.1.13.4. SWOT Analysis
- 12.1.1 Lianyungang Hualun Chemical Co Ltd
- 12.2. Market Entropy
- 12.2.1 Company's Key Areas Served
- 12.2.2 Recent Developments
- 12.3. Company Market Share Analysis 2025
- 12.3.1 Top 5 Companies Market Share Analysis
- 12.3.2 Top 3 Companies Market Share Analysis
- 12.4. List of Potential Customers
- 13. Research Methodology
List of Figures
- Figure 1: Global Organic Peroxide Industry Revenue Breakdown (Million, %) by Region 2025 & 2033
- Figure 2: Asia Pacific Organic Peroxide Industry Revenue (Million), by Type 2025 & 2033
- Figure 3: Asia Pacific Organic Peroxide Industry Revenue Share (%), by Type 2025 & 2033
- Figure 4: Asia Pacific Organic Peroxide Industry Revenue (Million), by Application 2025 & 2033
- Figure 5: Asia Pacific Organic Peroxide Industry Revenue Share (%), by Application 2025 & 2033
- Figure 6: Asia Pacific Organic Peroxide Industry Revenue (Million), by Country 2025 & 2033
- Figure 7: Asia Pacific Organic Peroxide Industry Revenue Share (%), by Country 2025 & 2033
- Figure 8: North America Organic Peroxide Industry Revenue (Million), by Type 2025 & 2033
- Figure 9: North America Organic Peroxide Industry Revenue Share (%), by Type 2025 & 2033
- Figure 10: North America Organic Peroxide Industry Revenue (Million), by Application 2025 & 2033
- Figure 11: North America Organic Peroxide Industry Revenue Share (%), by Application 2025 & 2033
- Figure 12: North America Organic Peroxide Industry Revenue (Million), by Country 2025 & 2033
- Figure 13: North America Organic Peroxide Industry Revenue Share (%), by Country 2025 & 2033
- Figure 14: Europe Organic Peroxide Industry Revenue (Million), by Type 2025 & 2033
- Figure 15: Europe Organic Peroxide Industry Revenue Share (%), by Type 2025 & 2033
- Figure 16: Europe Organic Peroxide Industry Revenue (Million), by Application 2025 & 2033
- Figure 17: Europe Organic Peroxide Industry Revenue Share (%), by Application 2025 & 2033
- Figure 18: Europe Organic Peroxide Industry Revenue (Million), by Country 2025 & 2033
- Figure 19: Europe Organic Peroxide Industry Revenue Share (%), by Country 2025 & 2033
- Figure 20: South America Organic Peroxide Industry Revenue (Million), by Type 2025 & 2033
- Figure 21: South America Organic Peroxide Industry Revenue Share (%), by Type 2025 & 2033
- Figure 22: South America Organic Peroxide Industry Revenue (Million), by Application 2025 & 2033
- Figure 23: South America Organic Peroxide Industry Revenue Share (%), by Application 2025 & 2033
- Figure 24: South America Organic Peroxide Industry Revenue (Million), by Country 2025 & 2033
- Figure 25: South America Organic Peroxide Industry Revenue Share (%), by Country 2025 & 2033
- Figure 26: Middle East and Africa Organic Peroxide Industry Revenue (Million), by Type 2025 & 2033
- Figure 27: Middle East and Africa Organic Peroxide Industry Revenue Share (%), by Type 2025 & 2033
- Figure 28: Middle East and Africa Organic Peroxide Industry Revenue (Million), by Application 2025 & 2033
- Figure 29: Middle East and Africa Organic Peroxide Industry Revenue Share (%), by Application 2025 & 2033
- Figure 30: Middle East and Africa Organic Peroxide Industry Revenue (Million), by Country 2025 & 2033
- Figure 31: Middle East and Africa Organic Peroxide Industry Revenue Share (%), by Country 2025 & 2033
List of Tables
- Table 1: Global Organic Peroxide Industry Revenue Million Forecast, by Type 2020 & 2033
- Table 2: Global Organic Peroxide Industry Revenue Million Forecast, by Application 2020 & 2033
- Table 3: Global Organic Peroxide Industry Revenue Million Forecast, by Region 2020 & 2033
- Table 4: Global Organic Peroxide Industry Revenue Million Forecast, by Type 2020 & 2033
- Table 5: Global Organic Peroxide Industry Revenue Million Forecast, by Application 2020 & 2033
- Table 6: Global Organic Peroxide Industry Revenue Million Forecast, by Country 2020 & 2033
- Table 7: China Organic Peroxide Industry Revenue (Million) Forecast, by Application 2020 & 2033
- Table 8: India Organic Peroxide Industry Revenue (Million) Forecast, by Application 2020 & 2033
- Table 9: Japan Organic Peroxide Industry Revenue (Million) Forecast, by Application 2020 & 2033
- Table 10: South Korea Organic Peroxide Industry Revenue (Million) Forecast, by Application 2020 & 2033
- Table 11: Rest of Asia Pacific Organic Peroxide Industry Revenue (Million) Forecast, by Application 2020 & 2033
- Table 12: Global Organic Peroxide Industry Revenue Million Forecast, by Type 2020 & 2033
- Table 13: Global Organic Peroxide Industry Revenue Million Forecast, by Application 2020 & 2033
- Table 14: Global Organic Peroxide Industry Revenue Million Forecast, by Country 2020 & 2033
- Table 15: United States Organic Peroxide Industry Revenue (Million) Forecast, by Application 2020 & 2033
- Table 16: Canada Organic Peroxide Industry Revenue (Million) Forecast, by Application 2020 & 2033
- Table 17: Mexico Organic Peroxide Industry Revenue (Million) Forecast, by Application 2020 & 2033
- Table 18: Global Organic Peroxide Industry Revenue Million Forecast, by Type 2020 & 2033
- Table 19: Global Organic Peroxide Industry Revenue Million Forecast, by Application 2020 & 2033
- Table 20: Global Organic Peroxide Industry Revenue Million Forecast, by Country 2020 & 2033
- Table 21: Germany Organic Peroxide Industry Revenue (Million) Forecast, by Application 2020 & 2033
- Table 22: United Kingdom Organic Peroxide Industry Revenue (Million) Forecast, by Application 2020 & 2033
- Table 23: Italy Organic Peroxide Industry Revenue (Million) Forecast, by Application 2020 & 2033
- Table 24: France Organic Peroxide Industry Revenue (Million) Forecast, by Application 2020 & 2033
- Table 25: Spain Organic Peroxide Industry Revenue (Million) Forecast, by Application 2020 & 2033
- Table 26: Rest of Europe Organic Peroxide Industry Revenue (Million) Forecast, by Application 2020 & 2033
- Table 27: Global Organic Peroxide Industry Revenue Million Forecast, by Type 2020 & 2033
- Table 28: Global Organic Peroxide Industry Revenue Million Forecast, by Application 2020 & 2033
- Table 29: Global Organic Peroxide Industry Revenue Million Forecast, by Country 2020 & 2033
- Table 30: Brazil Organic Peroxide Industry Revenue (Million) Forecast, by Application 2020 & 2033
- Table 31: Argentina Organic Peroxide Industry Revenue (Million) Forecast, by Application 2020 & 2033
- Table 32: Rest of South America Organic Peroxide Industry Revenue (Million) Forecast, by Application 2020 & 2033
- Table 33: Global Organic Peroxide Industry Revenue Million Forecast, by Type 2020 & 2033
- Table 34: Global Organic Peroxide Industry Revenue Million Forecast, by Application 2020 & 2033
- Table 35: Global Organic Peroxide Industry Revenue Million Forecast, by Country 2020 & 2033
- Table 36: Saudi Arabia Organic Peroxide Industry Revenue (Million) Forecast, by Application 2020 & 2033
- Table 37: South Africa Organic Peroxide Industry Revenue (Million) Forecast, by Application 2020 & 2033
- Table 38: Rest of Middle East and Africa Organic Peroxide Industry Revenue (Million) Forecast, by Application 2020 & 2033
Frequently Asked Questions
1. What is the projected Compound Annual Growth Rate (CAGR) of the Organic Peroxide Industry?
The projected CAGR is approximately 4.44%.
2. Which companies are prominent players in the Organic Peroxide Industry?
Key companies in the market include Lianyungang Hualun Chemical Co Ltd, AKPA KİMYA, Nouryon, Plasti Pigments Pvt Ltd, PERGAN GmbH, Novichem Spzoo, United Initiators*List Not Exhaustive, Kawaguchi Chemical Co Ltd, MPI Chemie BV, ACE CHEMICAL CORP, Arkema Group, NOF CORPORATION, Chinasun Specialty Products Co Ltd.
3. What are the main segments of the Organic Peroxide Industry?
The market segments include Type, Application.
4. Can you provide details about the market size?
The market size is estimated to be USD 1.30 Million as of 2022.
5. What are some drivers contributing to market growth?
Increasing Demand for Polymers from Various End-user Industries; Surging Utilization in Coating Applications.
6. What are the notable trends driving market growth?
Polymers and Rubbers to Dominate the Market.
7. Are there any restraints impacting market growth?
Difficulty in Storage. Transport. and Handling Organic Peroxides.
8. Can you provide examples of recent developments in the market?
In October 2022, Arkema announced that the company will reorganize the distribution of its Luperox and Retic organic peroxides, with Weber and Schaer, The Dolder company, and Univar Solutions, for the crosslinking market in several European countries as of January 1st, 2023.
9. What pricing options are available for accessing the report?
Pricing options include single-user, multi-user, and enterprise licenses priced at USD 4750, USD 5250, and USD 8750 respectively.
10. Is the market size provided in terms of value or volume?
The market size is provided in terms of value, measured in Million.
11. Are there any specific market keywords associated with the report?
Yes, the market keyword associated with the report is "Organic Peroxide Industry," which aids in identifying and referencing the specific market segment covered.
12. How do I determine which pricing option suits my needs best?
The pricing options vary based on user requirements and access needs. Individual users may opt for single-user licenses, while businesses requiring broader access may choose multi-user or enterprise licenses for cost-effective access to the report.
13. Are there any additional resources or data provided in the Organic Peroxide Industry report?
While the report offers comprehensive insights, it's advisable to review the specific contents or supplementary materials provided to ascertain if additional resources or data are available.
14. How can I stay updated on further developments or reports in the Organic Peroxide Industry?
To stay informed about further developments, trends, and reports in the Organic Peroxide Industry, consider subscribing to industry newsletters, following relevant companies and organizations, or regularly checking reputable industry news sources and publications.
Methodology
Step 1 - Identification of Relevant Samples Size from Population Database


Step 2 - Approaches for Defining Global Market Size (Value, Volume* & Price*)

Note*: In applicable scenarios
Step 3 - Data Sources
Primary Research
- Web Analytics
- Survey Reports
- Research Institute
- Latest Research Reports
- Opinion Leaders
Secondary Research
- Annual Reports
- White Paper
- Latest Press Release
- Industry Association
- Paid Database
- Investor Presentations

Step 4 - Data Triangulation
Involves using different sources of information in order to increase the validity of a study
These sources are likely to be stakeholders in a program - participants, other researchers, program staff, other community members, and so on.
Then we put all data in single framework & apply various statistical tools to find out the dynamic on the market.
During the analysis stage, feedback from the stakeholder groups would be compared to determine areas of agreement as well as areas of divergence