

Key Insights
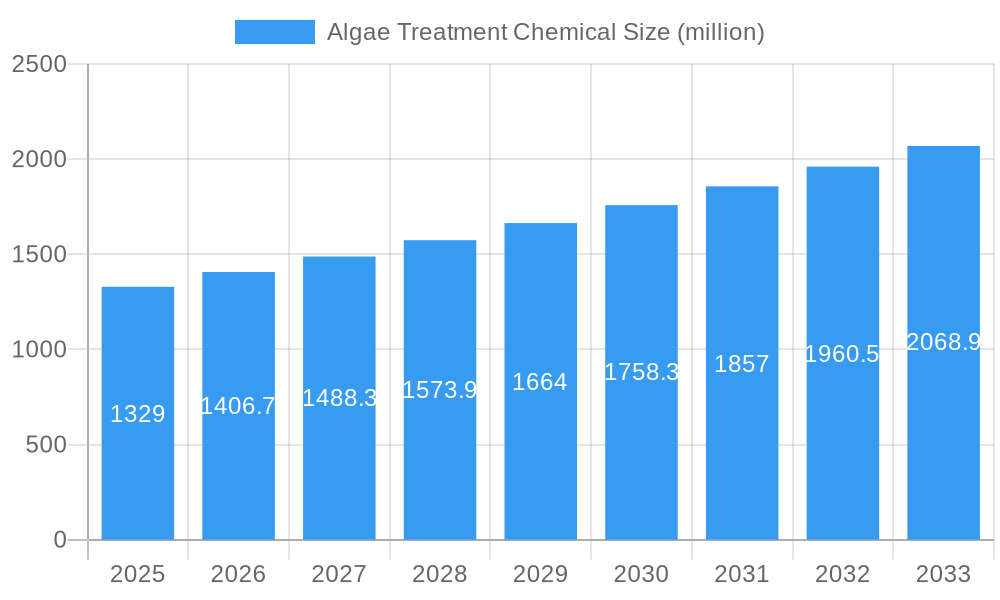
The global algae treatment chemical market, currently valued at approximately $1.33 billion in 2025, is projected to experience robust growth, driven by increasing concerns over harmful algal blooms (HABs) in water bodies and the escalating demand for clean water resources for various applications, including drinking water, industrial processes, and aquaculture. The market's Compound Annual Growth Rate (CAGR) of 5.4% from 2025 to 2033 signifies consistent expansion, primarily fueled by technological advancements in algae control solutions, stringent environmental regulations aimed at reducing water pollution, and rising awareness regarding the detrimental impacts of algae on aquatic ecosystems. Key factors contributing to market growth include the development of eco-friendly and sustainable algae treatment chemicals, increasing investments in water infrastructure projects, and the growing adoption of advanced treatment technologies such as bioaugmentation and ultrasound.
Algae Treatment Chemical Market Size (In Billion)
The market is segmented based on chemical type (e.g., copper-based algicides, chlorine-based algicides, non-chemical methods), application (drinking water treatment, industrial wastewater treatment, aquaculture), and geography. While precise segment-specific data is unavailable, it's reasonable to assume that the drinking water treatment segment holds a significant market share due to its large-scale applicability and the critical need for safe drinking water. Similarly, the industrial wastewater treatment sector is expected to see strong growth due to increasing industrialization and stricter effluent discharge standards. Major players such as BASF SE, Ecolab, and Kemira Oyj are driving innovation and competition through strategic partnerships, acquisitions, and the development of novel algae control solutions. The market is likely to witness increased consolidation in the coming years, with larger players acquiring smaller companies to enhance their product portfolios and market reach. The increasing adoption of sustainable and eco-friendly algae treatment solutions, coupled with government initiatives to promote water quality, will further propel market growth.
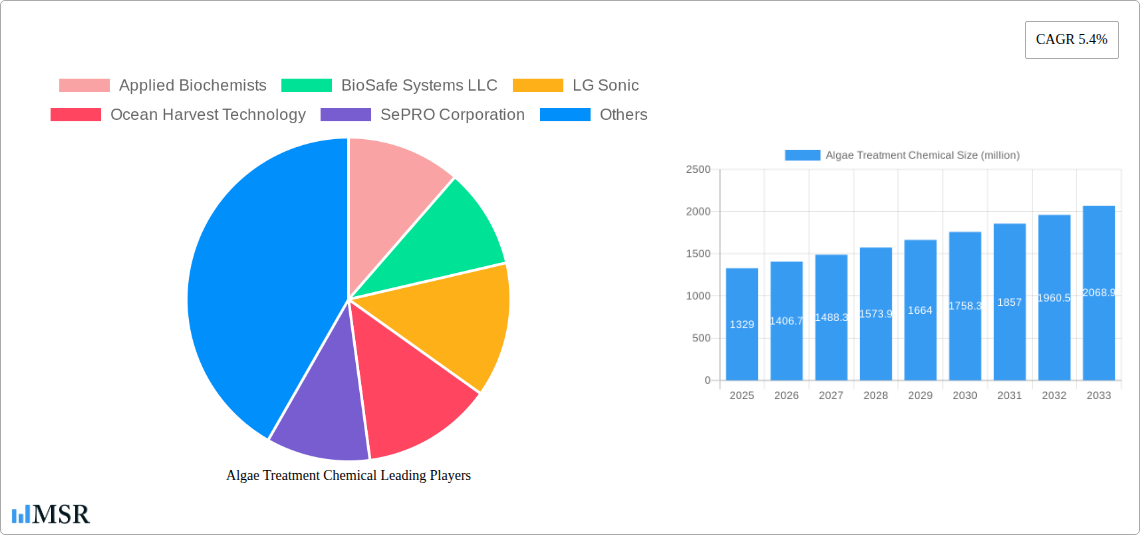
Algae Treatment Chemical Company Market Share
Algae Treatment Chemical Market Report: A Comprehensive Analysis (2019-2033)
This comprehensive report provides an in-depth analysis of the Algae Treatment Chemical market, offering invaluable insights for stakeholders across the industry. The study period covers 2019-2033, with a base year of 2025 and a forecast period of 2025-2033. We analyze market dynamics, key players, technological advancements, and emerging opportunities to provide a 360-degree view of this rapidly evolving sector. The global market size is projected to reach xx million USD by 2033, exhibiting a CAGR of xx% during the forecast period.
Algae Treatment Chemical Market Concentration & Dynamics
The Algae Treatment Chemical market is moderately concentrated, with several major players holding significant market share. In 2024, the top five companies, including BASF SE, Nalco Water (an Ecolab Company), Kemira Oyj, Solenis LLC, and Corteva Agriscience, collectively accounted for approximately xx% of the global market. However, the market displays a high degree of innovation, driven by continuous R&D efforts focusing on environmentally friendly and cost-effective solutions.
The regulatory landscape is evolving, with increasing emphasis on stringent environmental regulations to minimize the ecological impact of algae control. This drives the demand for eco-friendly algae treatment chemicals. Substitute products, such as physical and biological methods, pose a competitive threat, although chemical treatments often remain the most effective solution for large-scale applications. The market exhibits significant end-user trends toward sustainable and efficient algae control solutions in diverse sectors including water treatment, aquaculture, and industrial applications.
M&A activity in the Algae Treatment Chemical sector has been moderate, with approximately xx deals recorded between 2019 and 2024. These activities primarily focused on expanding product portfolios and geographical reach.
Algae Treatment Chemical Industry Insights & Trends
The Algae Treatment Chemical market is experiencing robust growth fueled by several factors. The increasing prevalence of harmful algal blooms (HABs) in water bodies due to eutrophication and climate change is a major driver, demanding efficient and effective control measures. Technological advancements, such as the development of novel chemical formulations with improved efficacy and reduced environmental impact, further accelerate market growth. Growing awareness regarding the negative consequences of unchecked algae growth in various sectors is another key driver. The market size is estimated to be xx million USD in 2025 and is projected to reach xx million USD by 2033. The increase in demand from various end-use industries such as water treatment, aquaculture, and industrial applications is also pushing the growth of the market. The expanding adoption of advanced technologies is influencing the market's growth.
Key Markets & Segments Leading Algae Treatment Chemical
The North American region currently dominates the Algae Treatment Chemical market, driven by stringent water quality regulations, a robust industrial base, and a high prevalence of HABs. European markets are also exhibiting significant growth, spurred by increasing environmental concerns and investments in water infrastructure.
Drivers for North American Dominance:
- Stringent environmental regulations
- High prevalence of harmful algal blooms (HABs)
- Significant investments in water infrastructure
- Strong industrial base
Drivers for European Market Growth:
- Growing environmental awareness
- Investments in water infrastructure modernization
- Government initiatives promoting sustainable water management
The water treatment segment holds the largest share within the market due to the widespread application of algae treatment chemicals in municipal and industrial water treatment plants.
Algae Treatment Chemical Product Developments
Recent innovations in Algae Treatment Chemical include the development of biodegradable and less toxic formulations, targeted delivery systems for improved efficacy, and advanced analytical tools for precise algae detection and monitoring. These advancements enhance the environmental sustainability and cost-effectiveness of algae control, thereby increasing market adoption. Companies are also focusing on developing customized solutions for specific algae species and environmental conditions, further enhancing their competitive advantage.
Challenges in the Algae Treatment Chemical Market
The Algae Treatment Chemical market faces several challenges, including stringent regulatory approvals for new chemical formulations, potential supply chain disruptions affecting the availability of raw materials, and intense competition among established players and emerging innovative companies. These factors can impact market growth and profitability, demanding effective risk management strategies from industry participants. Furthermore, the high cost of some advanced treatment technologies can limit adoption in certain market segments.
Forces Driving Algae Treatment Chemical Growth
Several factors drive the growth of the Algae Treatment Chemical market, including increasing government regulations mandating effective water treatment, growing industrial demand for effective algae control, technological advancements leading to more effective and sustainable solutions, and increased awareness of the negative environmental and economic consequences of algal blooms. The rising adoption of advanced technologies for algae treatment and control also contributes significantly to the growth of the market.
Long-Term Growth Catalysts in Algae Treatment Chemical
Long-term growth will be driven by the development of innovative and sustainable algae treatment solutions, strategic partnerships and collaborations among companies to expand market reach and product portfolio, and expansion into emerging markets with high growth potential, especially in regions experiencing increasing water scarcity and HAB prevalence.
Emerging Opportunities in Algae Treatment Chemical
Emerging opportunities lie in developing targeted treatment solutions for specific algae species, exploring bio-based and environmentally friendly alternatives, leveraging advanced monitoring and detection technologies to optimize treatment strategies, and tapping into the growing demand for algae control in aquaculture and other specialized industrial applications. The rise of precision agriculture and the focus on smart water management offer significant opportunities for algae treatment solutions.
Leading Players in the Algae Treatment Chemical Sector
- Applied Biochemists
- BioSafe Systems LLC
- LG Sonic
- Ocean Harvest Technology
- SePRO Corporation
- BASF SE
- Nalco Water (an Ecolab Company)
- Kemira Oyj
- Solenis LLC
- Corteva Agriscience
- USA Water Services Corporation
- BioPetroClean
- Algaecytes Ltd.
- Accepta
- Evoqua Water Technologies
Key Milestones in Algae Treatment Chemical Industry
- 2020: Launch of a novel biodegradable algaecide by BASF SE.
- 2021: Acquisition of a smaller algae treatment company by Nalco Water.
- 2022: Introduction of a new UV-based algae control technology by LG Sonic.
- 2023: Significant investment in R&D for sustainable algae treatment solutions by Corteva Agriscience.
Strategic Outlook for Algae Treatment Chemical Market
The Algae Treatment Chemical market presents significant long-term growth potential, driven by the increasing global demand for effective and sustainable algae control solutions. Strategic opportunities exist for companies focusing on innovation, sustainability, and strategic partnerships to capture market share and generate strong returns. The market is expected to see continued consolidation and growth, with increased emphasis on technological advancement and eco-friendly solutions.
Algae Treatment Chemical Segmentation
-
1. Application
- 1.1. Municipal Water Treatment
- 1.2. Industrial Water Treatment
- 1.3. Agriculture
- 1.4. Healthcare and Pharmaceuticals
- 1.5. Food and Beverage
- 1.6. Others
-
2. Types
- 2.1. Macroalgae
- 2.2. Microalgae
Algae Treatment Chemical Segmentation By Geography
-
1. North America
- 1.1. United States
- 1.2. Canada
- 1.3. Mexico
-
2. South America
- 2.1. Brazil
- 2.2. Argentina
- 2.3. Rest of South America
-
3. Europe
- 3.1. United Kingdom
- 3.2. Germany
- 3.3. France
- 3.4. Italy
- 3.5. Spain
- 3.6. Russia
- 3.7. Benelux
- 3.8. Nordics
- 3.9. Rest of Europe
-
4. Middle East & Africa
- 4.1. Turkey
- 4.2. Israel
- 4.3. GCC
- 4.4. North Africa
- 4.5. South Africa
- 4.6. Rest of Middle East & Africa
-
5. Asia Pacific
- 5.1. China
- 5.2. India
- 5.3. Japan
- 5.4. South Korea
- 5.5. ASEAN
- 5.6. Oceania
- 5.7. Rest of Asia Pacific
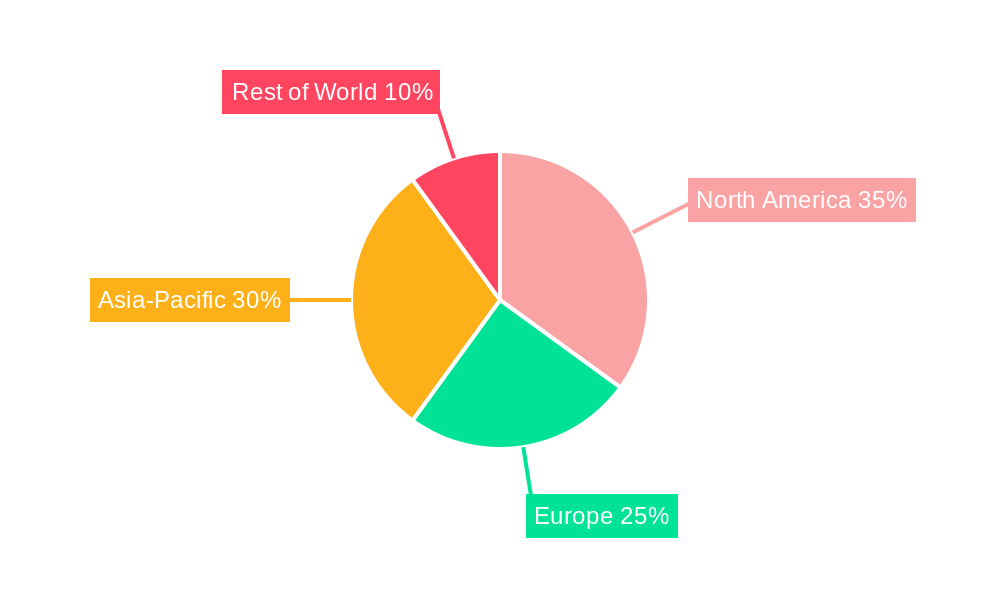
Algae Treatment Chemical Regional Market Share
Geographic Coverage of Algae Treatment Chemical
Algae Treatment Chemical REPORT HIGHLIGHTS
| Aspects | Details |
|---|---|
| Study Period | 2020-2034 |
| Base Year | 2025 |
| Estimated Year | 2026 |
| Forecast Period | 2026-2034 |
| Historical Period | 2020-2025 |
| Growth Rate | CAGR of 5.4% from 2020-2034 |
| Segmentation |
|
Table of Contents
- 1. Introduction
- 1.1. Research Scope
- 1.2. Market Segmentation
- 1.3. Research Methodology
- 1.4. Definitions and Assumptions
- 2. Executive Summary
- 2.1. Introduction
- 3. Market Dynamics
- 3.1. Introduction
- 3.2. Market Drivers
- 3.3. Market Restrains
- 3.4. Market Trends
- 4. Market Factor Analysis
- 4.1. Porters Five Forces
- 4.2. Supply/Value Chain
- 4.3. PESTEL analysis
- 4.4. Market Entropy
- 4.5. Patent/Trademark Analysis
- 5. Global Algae Treatment Chemical Analysis, Insights and Forecast, 2020-2032
- 5.1. Market Analysis, Insights and Forecast - by Application
- 5.1.1. Municipal Water Treatment
- 5.1.2. Industrial Water Treatment
- 5.1.3. Agriculture
- 5.1.4. Healthcare and Pharmaceuticals
- 5.1.5. Food and Beverage
- 5.1.6. Others
- 5.2. Market Analysis, Insights and Forecast - by Types
- 5.2.1. Macroalgae
- 5.2.2. Microalgae
- 5.3. Market Analysis, Insights and Forecast - by Region
- 5.3.1. North America
- 5.3.2. South America
- 5.3.3. Europe
- 5.3.4. Middle East & Africa
- 5.3.5. Asia Pacific
- 5.1. Market Analysis, Insights and Forecast - by Application
- 6. North America Algae Treatment Chemical Analysis, Insights and Forecast, 2020-2032
- 6.1. Market Analysis, Insights and Forecast - by Application
- 6.1.1. Municipal Water Treatment
- 6.1.2. Industrial Water Treatment
- 6.1.3. Agriculture
- 6.1.4. Healthcare and Pharmaceuticals
- 6.1.5. Food and Beverage
- 6.1.6. Others
- 6.2. Market Analysis, Insights and Forecast - by Types
- 6.2.1. Macroalgae
- 6.2.2. Microalgae
- 6.1. Market Analysis, Insights and Forecast - by Application
- 7. South America Algae Treatment Chemical Analysis, Insights and Forecast, 2020-2032
- 7.1. Market Analysis, Insights and Forecast - by Application
- 7.1.1. Municipal Water Treatment
- 7.1.2. Industrial Water Treatment
- 7.1.3. Agriculture
- 7.1.4. Healthcare and Pharmaceuticals
- 7.1.5. Food and Beverage
- 7.1.6. Others
- 7.2. Market Analysis, Insights and Forecast - by Types
- 7.2.1. Macroalgae
- 7.2.2. Microalgae
- 7.1. Market Analysis, Insights and Forecast - by Application
- 8. Europe Algae Treatment Chemical Analysis, Insights and Forecast, 2020-2032
- 8.1. Market Analysis, Insights and Forecast - by Application
- 8.1.1. Municipal Water Treatment
- 8.1.2. Industrial Water Treatment
- 8.1.3. Agriculture
- 8.1.4. Healthcare and Pharmaceuticals
- 8.1.5. Food and Beverage
- 8.1.6. Others
- 8.2. Market Analysis, Insights and Forecast - by Types
- 8.2.1. Macroalgae
- 8.2.2. Microalgae
- 8.1. Market Analysis, Insights and Forecast - by Application
- 9. Middle East & Africa Algae Treatment Chemical Analysis, Insights and Forecast, 2020-2032
- 9.1. Market Analysis, Insights and Forecast - by Application
- 9.1.1. Municipal Water Treatment
- 9.1.2. Industrial Water Treatment
- 9.1.3. Agriculture
- 9.1.4. Healthcare and Pharmaceuticals
- 9.1.5. Food and Beverage
- 9.1.6. Others
- 9.2. Market Analysis, Insights and Forecast - by Types
- 9.2.1. Macroalgae
- 9.2.2. Microalgae
- 9.1. Market Analysis, Insights and Forecast - by Application
- 10. Asia Pacific Algae Treatment Chemical Analysis, Insights and Forecast, 2020-2032
- 10.1. Market Analysis, Insights and Forecast - by Application
- 10.1.1. Municipal Water Treatment
- 10.1.2. Industrial Water Treatment
- 10.1.3. Agriculture
- 10.1.4. Healthcare and Pharmaceuticals
- 10.1.5. Food and Beverage
- 10.1.6. Others
- 10.2. Market Analysis, Insights and Forecast - by Types
- 10.2.1. Macroalgae
- 10.2.2. Microalgae
- 10.1. Market Analysis, Insights and Forecast - by Application
- 11. Competitive Analysis
- 11.1. Global Market Share Analysis 2025
- 11.2. Company Profiles
- 11.2.1 Applied Biochemists
- 11.2.1.1. Overview
- 11.2.1.2. Products
- 11.2.1.3. SWOT Analysis
- 11.2.1.4. Recent Developments
- 11.2.1.5. Financials (Based on Availability)
- 11.2.2 BioSafe Systems LLC
- 11.2.2.1. Overview
- 11.2.2.2. Products
- 11.2.2.3. SWOT Analysis
- 11.2.2.4. Recent Developments
- 11.2.2.5. Financials (Based on Availability)
- 11.2.3 LG Sonic
- 11.2.3.1. Overview
- 11.2.3.2. Products
- 11.2.3.3. SWOT Analysis
- 11.2.3.4. Recent Developments
- 11.2.3.5. Financials (Based on Availability)
- 11.2.4 Ocean Harvest Technology
- 11.2.4.1. Overview
- 11.2.4.2. Products
- 11.2.4.3. SWOT Analysis
- 11.2.4.4. Recent Developments
- 11.2.4.5. Financials (Based on Availability)
- 11.2.5 SePRO Corporation
- 11.2.5.1. Overview
- 11.2.5.2. Products
- 11.2.5.3. SWOT Analysis
- 11.2.5.4. Recent Developments
- 11.2.5.5. Financials (Based on Availability)
- 11.2.6 BASF SE
- 11.2.6.1. Overview
- 11.2.6.2. Products
- 11.2.6.3. SWOT Analysis
- 11.2.6.4. Recent Developments
- 11.2.6.5. Financials (Based on Availability)
- 11.2.7 Nalco Water (an Ecolab Company)
- 11.2.7.1. Overview
- 11.2.7.2. Products
- 11.2.7.3. SWOT Analysis
- 11.2.7.4. Recent Developments
- 11.2.7.5. Financials (Based on Availability)
- 11.2.8 Kemira Oyj
- 11.2.8.1. Overview
- 11.2.8.2. Products
- 11.2.8.3. SWOT Analysis
- 11.2.8.4. Recent Developments
- 11.2.8.5. Financials (Based on Availability)
- 11.2.9 Solenis LLC
- 11.2.9.1. Overview
- 11.2.9.2. Products
- 11.2.9.3. SWOT Analysis
- 11.2.9.4. Recent Developments
- 11.2.9.5. Financials (Based on Availability)
- 11.2.10 Corteva Agriscience
- 11.2.10.1. Overview
- 11.2.10.2. Products
- 11.2.10.3. SWOT Analysis
- 11.2.10.4. Recent Developments
- 11.2.10.5. Financials (Based on Availability)
- 11.2.11 USA Water Services Corporation
- 11.2.11.1. Overview
- 11.2.11.2. Products
- 11.2.11.3. SWOT Analysis
- 11.2.11.4. Recent Developments
- 11.2.11.5. Financials (Based on Availability)
- 11.2.12 BioPetroClean
- 11.2.12.1. Overview
- 11.2.12.2. Products
- 11.2.12.3. SWOT Analysis
- 11.2.12.4. Recent Developments
- 11.2.12.5. Financials (Based on Availability)
- 11.2.13 Algaecytes Ltd.
- 11.2.13.1. Overview
- 11.2.13.2. Products
- 11.2.13.3. SWOT Analysis
- 11.2.13.4. Recent Developments
- 11.2.13.5. Financials (Based on Availability)
- 11.2.14 Accepta
- 11.2.14.1. Overview
- 11.2.14.2. Products
- 11.2.14.3. SWOT Analysis
- 11.2.14.4. Recent Developments
- 11.2.14.5. Financials (Based on Availability)
- 11.2.15 Evoqua Water Technologies
- 11.2.15.1. Overview
- 11.2.15.2. Products
- 11.2.15.3. SWOT Analysis
- 11.2.15.4. Recent Developments
- 11.2.15.5. Financials (Based on Availability)
- 11.2.1 Applied Biochemists
List of Figures
- Figure 1: Global Algae Treatment Chemical Revenue Breakdown (million, %) by Region 2025 & 2033
- Figure 2: Global Algae Treatment Chemical Volume Breakdown (K, %) by Region 2025 & 2033
- Figure 3: North America Algae Treatment Chemical Revenue (million), by Application 2025 & 2033
- Figure 4: North America Algae Treatment Chemical Volume (K), by Application 2025 & 2033
- Figure 5: North America Algae Treatment Chemical Revenue Share (%), by Application 2025 & 2033
- Figure 6: North America Algae Treatment Chemical Volume Share (%), by Application 2025 & 2033
- Figure 7: North America Algae Treatment Chemical Revenue (million), by Types 2025 & 2033
- Figure 8: North America Algae Treatment Chemical Volume (K), by Types 2025 & 2033
- Figure 9: North America Algae Treatment Chemical Revenue Share (%), by Types 2025 & 2033
- Figure 10: North America Algae Treatment Chemical Volume Share (%), by Types 2025 & 2033
- Figure 11: North America Algae Treatment Chemical Revenue (million), by Country 2025 & 2033
- Figure 12: North America Algae Treatment Chemical Volume (K), by Country 2025 & 2033
- Figure 13: North America Algae Treatment Chemical Revenue Share (%), by Country 2025 & 2033
- Figure 14: North America Algae Treatment Chemical Volume Share (%), by Country 2025 & 2033
- Figure 15: South America Algae Treatment Chemical Revenue (million), by Application 2025 & 2033
- Figure 16: South America Algae Treatment Chemical Volume (K), by Application 2025 & 2033
- Figure 17: South America Algae Treatment Chemical Revenue Share (%), by Application 2025 & 2033
- Figure 18: South America Algae Treatment Chemical Volume Share (%), by Application 2025 & 2033
- Figure 19: South America Algae Treatment Chemical Revenue (million), by Types 2025 & 2033
- Figure 20: South America Algae Treatment Chemical Volume (K), by Types 2025 & 2033
- Figure 21: South America Algae Treatment Chemical Revenue Share (%), by Types 2025 & 2033
- Figure 22: South America Algae Treatment Chemical Volume Share (%), by Types 2025 & 2033
- Figure 23: South America Algae Treatment Chemical Revenue (million), by Country 2025 & 2033
- Figure 24: South America Algae Treatment Chemical Volume (K), by Country 2025 & 2033
- Figure 25: South America Algae Treatment Chemical Revenue Share (%), by Country 2025 & 2033
- Figure 26: South America Algae Treatment Chemical Volume Share (%), by Country 2025 & 2033
- Figure 27: Europe Algae Treatment Chemical Revenue (million), by Application 2025 & 2033
- Figure 28: Europe Algae Treatment Chemical Volume (K), by Application 2025 & 2033
- Figure 29: Europe Algae Treatment Chemical Revenue Share (%), by Application 2025 & 2033
- Figure 30: Europe Algae Treatment Chemical Volume Share (%), by Application 2025 & 2033
- Figure 31: Europe Algae Treatment Chemical Revenue (million), by Types 2025 & 2033
- Figure 32: Europe Algae Treatment Chemical Volume (K), by Types 2025 & 2033
- Figure 33: Europe Algae Treatment Chemical Revenue Share (%), by Types 2025 & 2033
- Figure 34: Europe Algae Treatment Chemical Volume Share (%), by Types 2025 & 2033
- Figure 35: Europe Algae Treatment Chemical Revenue (million), by Country 2025 & 2033
- Figure 36: Europe Algae Treatment Chemical Volume (K), by Country 2025 & 2033
- Figure 37: Europe Algae Treatment Chemical Revenue Share (%), by Country 2025 & 2033
- Figure 38: Europe Algae Treatment Chemical Volume Share (%), by Country 2025 & 2033
- Figure 39: Middle East & Africa Algae Treatment Chemical Revenue (million), by Application 2025 & 2033
- Figure 40: Middle East & Africa Algae Treatment Chemical Volume (K), by Application 2025 & 2033
- Figure 41: Middle East & Africa Algae Treatment Chemical Revenue Share (%), by Application 2025 & 2033
- Figure 42: Middle East & Africa Algae Treatment Chemical Volume Share (%), by Application 2025 & 2033
- Figure 43: Middle East & Africa Algae Treatment Chemical Revenue (million), by Types 2025 & 2033
- Figure 44: Middle East & Africa Algae Treatment Chemical Volume (K), by Types 2025 & 2033
- Figure 45: Middle East & Africa Algae Treatment Chemical Revenue Share (%), by Types 2025 & 2033
- Figure 46: Middle East & Africa Algae Treatment Chemical Volume Share (%), by Types 2025 & 2033
- Figure 47: Middle East & Africa Algae Treatment Chemical Revenue (million), by Country 2025 & 2033
- Figure 48: Middle East & Africa Algae Treatment Chemical Volume (K), by Country 2025 & 2033
- Figure 49: Middle East & Africa Algae Treatment Chemical Revenue Share (%), by Country 2025 & 2033
- Figure 50: Middle East & Africa Algae Treatment Chemical Volume Share (%), by Country 2025 & 2033
- Figure 51: Asia Pacific Algae Treatment Chemical Revenue (million), by Application 2025 & 2033
- Figure 52: Asia Pacific Algae Treatment Chemical Volume (K), by Application 2025 & 2033
- Figure 53: Asia Pacific Algae Treatment Chemical Revenue Share (%), by Application 2025 & 2033
- Figure 54: Asia Pacific Algae Treatment Chemical Volume Share (%), by Application 2025 & 2033
- Figure 55: Asia Pacific Algae Treatment Chemical Revenue (million), by Types 2025 & 2033
- Figure 56: Asia Pacific Algae Treatment Chemical Volume (K), by Types 2025 & 2033
- Figure 57: Asia Pacific Algae Treatment Chemical Revenue Share (%), by Types 2025 & 2033
- Figure 58: Asia Pacific Algae Treatment Chemical Volume Share (%), by Types 2025 & 2033
- Figure 59: Asia Pacific Algae Treatment Chemical Revenue (million), by Country 2025 & 2033
- Figure 60: Asia Pacific Algae Treatment Chemical Volume (K), by Country 2025 & 2033
- Figure 61: Asia Pacific Algae Treatment Chemical Revenue Share (%), by Country 2025 & 2033
- Figure 62: Asia Pacific Algae Treatment Chemical Volume Share (%), by Country 2025 & 2033
List of Tables
- Table 1: Global Algae Treatment Chemical Revenue million Forecast, by Application 2020 & 2033
- Table 2: Global Algae Treatment Chemical Volume K Forecast, by Application 2020 & 2033
- Table 3: Global Algae Treatment Chemical Revenue million Forecast, by Types 2020 & 2033
- Table 4: Global Algae Treatment Chemical Volume K Forecast, by Types 2020 & 2033
- Table 5: Global Algae Treatment Chemical Revenue million Forecast, by Region 2020 & 2033
- Table 6: Global Algae Treatment Chemical Volume K Forecast, by Region 2020 & 2033
- Table 7: Global Algae Treatment Chemical Revenue million Forecast, by Application 2020 & 2033
- Table 8: Global Algae Treatment Chemical Volume K Forecast, by Application 2020 & 2033
- Table 9: Global Algae Treatment Chemical Revenue million Forecast, by Types 2020 & 2033
- Table 10: Global Algae Treatment Chemical Volume K Forecast, by Types 2020 & 2033
- Table 11: Global Algae Treatment Chemical Revenue million Forecast, by Country 2020 & 2033
- Table 12: Global Algae Treatment Chemical Volume K Forecast, by Country 2020 & 2033
- Table 13: United States Algae Treatment Chemical Revenue (million) Forecast, by Application 2020 & 2033
- Table 14: United States Algae Treatment Chemical Volume (K) Forecast, by Application 2020 & 2033
- Table 15: Canada Algae Treatment Chemical Revenue (million) Forecast, by Application 2020 & 2033
- Table 16: Canada Algae Treatment Chemical Volume (K) Forecast, by Application 2020 & 2033
- Table 17: Mexico Algae Treatment Chemical Revenue (million) Forecast, by Application 2020 & 2033
- Table 18: Mexico Algae Treatment Chemical Volume (K) Forecast, by Application 2020 & 2033
- Table 19: Global Algae Treatment Chemical Revenue million Forecast, by Application 2020 & 2033
- Table 20: Global Algae Treatment Chemical Volume K Forecast, by Application 2020 & 2033
- Table 21: Global Algae Treatment Chemical Revenue million Forecast, by Types 2020 & 2033
- Table 22: Global Algae Treatment Chemical Volume K Forecast, by Types 2020 & 2033
- Table 23: Global Algae Treatment Chemical Revenue million Forecast, by Country 2020 & 2033
- Table 24: Global Algae Treatment Chemical Volume K Forecast, by Country 2020 & 2033
- Table 25: Brazil Algae Treatment Chemical Revenue (million) Forecast, by Application 2020 & 2033
- Table 26: Brazil Algae Treatment Chemical Volume (K) Forecast, by Application 2020 & 2033
- Table 27: Argentina Algae Treatment Chemical Revenue (million) Forecast, by Application 2020 & 2033
- Table 28: Argentina Algae Treatment Chemical Volume (K) Forecast, by Application 2020 & 2033
- Table 29: Rest of South America Algae Treatment Chemical Revenue (million) Forecast, by Application 2020 & 2033
- Table 30: Rest of South America Algae Treatment Chemical Volume (K) Forecast, by Application 2020 & 2033
- Table 31: Global Algae Treatment Chemical Revenue million Forecast, by Application 2020 & 2033
- Table 32: Global Algae Treatment Chemical Volume K Forecast, by Application 2020 & 2033
- Table 33: Global Algae Treatment Chemical Revenue million Forecast, by Types 2020 & 2033
- Table 34: Global Algae Treatment Chemical Volume K Forecast, by Types 2020 & 2033
- Table 35: Global Algae Treatment Chemical Revenue million Forecast, by Country 2020 & 2033
- Table 36: Global Algae Treatment Chemical Volume K Forecast, by Country 2020 & 2033
- Table 37: United Kingdom Algae Treatment Chemical Revenue (million) Forecast, by Application 2020 & 2033
- Table 38: United Kingdom Algae Treatment Chemical Volume (K) Forecast, by Application 2020 & 2033
- Table 39: Germany Algae Treatment Chemical Revenue (million) Forecast, by Application 2020 & 2033
- Table 40: Germany Algae Treatment Chemical Volume (K) Forecast, by Application 2020 & 2033
- Table 41: France Algae Treatment Chemical Revenue (million) Forecast, by Application 2020 & 2033
- Table 42: France Algae Treatment Chemical Volume (K) Forecast, by Application 2020 & 2033
- Table 43: Italy Algae Treatment Chemical Revenue (million) Forecast, by Application 2020 & 2033
- Table 44: Italy Algae Treatment Chemical Volume (K) Forecast, by Application 2020 & 2033
- Table 45: Spain Algae Treatment Chemical Revenue (million) Forecast, by Application 2020 & 2033
- Table 46: Spain Algae Treatment Chemical Volume (K) Forecast, by Application 2020 & 2033
- Table 47: Russia Algae Treatment Chemical Revenue (million) Forecast, by Application 2020 & 2033
- Table 48: Russia Algae Treatment Chemical Volume (K) Forecast, by Application 2020 & 2033
- Table 49: Benelux Algae Treatment Chemical Revenue (million) Forecast, by Application 2020 & 2033
- Table 50: Benelux Algae Treatment Chemical Volume (K) Forecast, by Application 2020 & 2033
- Table 51: Nordics Algae Treatment Chemical Revenue (million) Forecast, by Application 2020 & 2033
- Table 52: Nordics Algae Treatment Chemical Volume (K) Forecast, by Application 2020 & 2033
- Table 53: Rest of Europe Algae Treatment Chemical Revenue (million) Forecast, by Application 2020 & 2033
- Table 54: Rest of Europe Algae Treatment Chemical Volume (K) Forecast, by Application 2020 & 2033
- Table 55: Global Algae Treatment Chemical Revenue million Forecast, by Application 2020 & 2033
- Table 56: Global Algae Treatment Chemical Volume K Forecast, by Application 2020 & 2033
- Table 57: Global Algae Treatment Chemical Revenue million Forecast, by Types 2020 & 2033
- Table 58: Global Algae Treatment Chemical Volume K Forecast, by Types 2020 & 2033
- Table 59: Global Algae Treatment Chemical Revenue million Forecast, by Country 2020 & 2033
- Table 60: Global Algae Treatment Chemical Volume K Forecast, by Country 2020 & 2033
- Table 61: Turkey Algae Treatment Chemical Revenue (million) Forecast, by Application 2020 & 2033
- Table 62: Turkey Algae Treatment Chemical Volume (K) Forecast, by Application 2020 & 2033
- Table 63: Israel Algae Treatment Chemical Revenue (million) Forecast, by Application 2020 & 2033
- Table 64: Israel Algae Treatment Chemical Volume (K) Forecast, by Application 2020 & 2033
- Table 65: GCC Algae Treatment Chemical Revenue (million) Forecast, by Application 2020 & 2033
- Table 66: GCC Algae Treatment Chemical Volume (K) Forecast, by Application 2020 & 2033
- Table 67: North Africa Algae Treatment Chemical Revenue (million) Forecast, by Application 2020 & 2033
- Table 68: North Africa Algae Treatment Chemical Volume (K) Forecast, by Application 2020 & 2033
- Table 69: South Africa Algae Treatment Chemical Revenue (million) Forecast, by Application 2020 & 2033
- Table 70: South Africa Algae Treatment Chemical Volume (K) Forecast, by Application 2020 & 2033
- Table 71: Rest of Middle East & Africa Algae Treatment Chemical Revenue (million) Forecast, by Application 2020 & 2033
- Table 72: Rest of Middle East & Africa Algae Treatment Chemical Volume (K) Forecast, by Application 2020 & 2033
- Table 73: Global Algae Treatment Chemical Revenue million Forecast, by Application 2020 & 2033
- Table 74: Global Algae Treatment Chemical Volume K Forecast, by Application 2020 & 2033
- Table 75: Global Algae Treatment Chemical Revenue million Forecast, by Types 2020 & 2033
- Table 76: Global Algae Treatment Chemical Volume K Forecast, by Types 2020 & 2033
- Table 77: Global Algae Treatment Chemical Revenue million Forecast, by Country 2020 & 2033
- Table 78: Global Algae Treatment Chemical Volume K Forecast, by Country 2020 & 2033
- Table 79: China Algae Treatment Chemical Revenue (million) Forecast, by Application 2020 & 2033
- Table 80: China Algae Treatment Chemical Volume (K) Forecast, by Application 2020 & 2033
- Table 81: India Algae Treatment Chemical Revenue (million) Forecast, by Application 2020 & 2033
- Table 82: India Algae Treatment Chemical Volume (K) Forecast, by Application 2020 & 2033
- Table 83: Japan Algae Treatment Chemical Revenue (million) Forecast, by Application 2020 & 2033
- Table 84: Japan Algae Treatment Chemical Volume (K) Forecast, by Application 2020 & 2033
- Table 85: South Korea Algae Treatment Chemical Revenue (million) Forecast, by Application 2020 & 2033
- Table 86: South Korea Algae Treatment Chemical Volume (K) Forecast, by Application 2020 & 2033
- Table 87: ASEAN Algae Treatment Chemical Revenue (million) Forecast, by Application 2020 & 2033
- Table 88: ASEAN Algae Treatment Chemical Volume (K) Forecast, by Application 2020 & 2033
- Table 89: Oceania Algae Treatment Chemical Revenue (million) Forecast, by Application 2020 & 2033
- Table 90: Oceania Algae Treatment Chemical Volume (K) Forecast, by Application 2020 & 2033
- Table 91: Rest of Asia Pacific Algae Treatment Chemical Revenue (million) Forecast, by Application 2020 & 2033
- Table 92: Rest of Asia Pacific Algae Treatment Chemical Volume (K) Forecast, by Application 2020 & 2033
Frequently Asked Questions
1. What is the projected Compound Annual Growth Rate (CAGR) of the Algae Treatment Chemical?
The projected CAGR is approximately 5.4%.
2. Which companies are prominent players in the Algae Treatment Chemical?
Key companies in the market include Applied Biochemists, BioSafe Systems LLC, LG Sonic, Ocean Harvest Technology, SePRO Corporation, BASF SE, Nalco Water (an Ecolab Company), Kemira Oyj, Solenis LLC, Corteva Agriscience, USA Water Services Corporation, BioPetroClean, Algaecytes Ltd., Accepta, Evoqua Water Technologies.
3. What are the main segments of the Algae Treatment Chemical?
The market segments include Application, Types.
4. Can you provide details about the market size?
The market size is estimated to be USD 1329 million as of 2022.
5. What are some drivers contributing to market growth?
N/A
6. What are the notable trends driving market growth?
N/A
7. Are there any restraints impacting market growth?
N/A
8. Can you provide examples of recent developments in the market?
N/A
9. What pricing options are available for accessing the report?
Pricing options include single-user, multi-user, and enterprise licenses priced at USD 4350.00, USD 6525.00, and USD 8700.00 respectively.
10. Is the market size provided in terms of value or volume?
The market size is provided in terms of value, measured in million and volume, measured in K.
11. Are there any specific market keywords associated with the report?
Yes, the market keyword associated with the report is "Algae Treatment Chemical," which aids in identifying and referencing the specific market segment covered.
12. How do I determine which pricing option suits my needs best?
The pricing options vary based on user requirements and access needs. Individual users may opt for single-user licenses, while businesses requiring broader access may choose multi-user or enterprise licenses for cost-effective access to the report.
13. Are there any additional resources or data provided in the Algae Treatment Chemical report?
While the report offers comprehensive insights, it's advisable to review the specific contents or supplementary materials provided to ascertain if additional resources or data are available.
14. How can I stay updated on further developments or reports in the Algae Treatment Chemical?
To stay informed about further developments, trends, and reports in the Algae Treatment Chemical, consider subscribing to industry newsletters, following relevant companies and organizations, or regularly checking reputable industry news sources and publications.
Methodology
Step 1 - Identification of Relevant Samples Size from Population Database


Step 2 - Approaches for Defining Global Market Size (Value, Volume* & Price*)

Note*: In applicable scenarios
Step 3 - Data Sources
Primary Research
- Web Analytics
- Survey Reports
- Research Institute
- Latest Research Reports
- Opinion Leaders
Secondary Research
- Annual Reports
- White Paper
- Latest Press Release
- Industry Association
- Paid Database
- Investor Presentations

Step 4 - Data Triangulation
Involves using different sources of information in order to increase the validity of a study
These sources are likely to be stakeholders in a program - participants, other researchers, program staff, other community members, and so on.
Then we put all data in single framework & apply various statistical tools to find out the dynamic on the market.
During the analysis stage, feedback from the stakeholder groups would be compared to determine areas of agreement as well as areas of divergence