

Key Insights
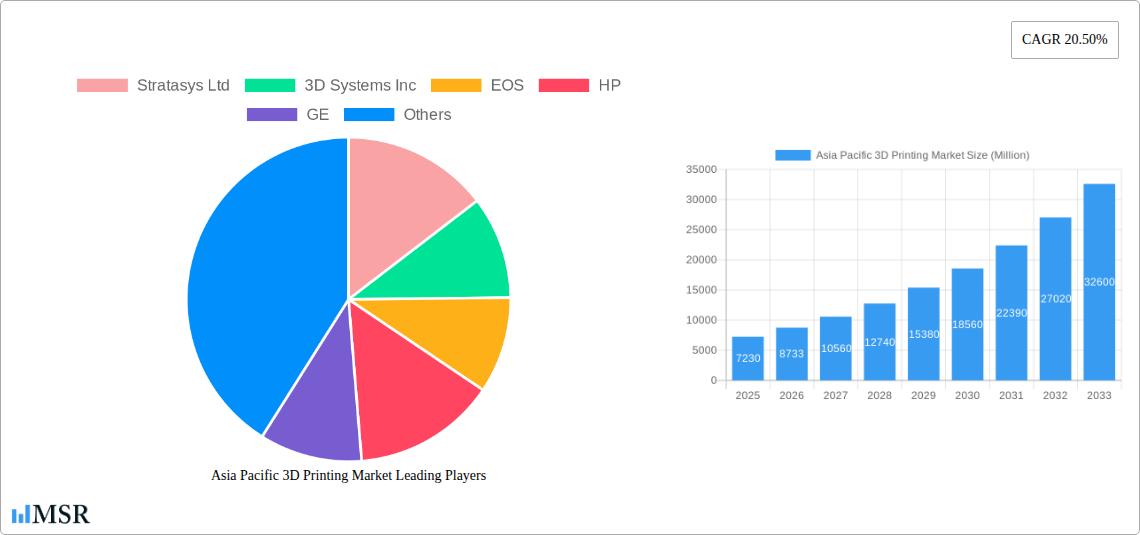
The Asia Pacific 3D printing market is experiencing robust growth, driven by increasing adoption across diverse sectors like healthcare, automotive, and aerospace. The market, valued at approximately $7.23 billion in 2025, is projected to witness a Compound Annual Growth Rate (CAGR) of 20.50% from 2025 to 2033. This significant expansion is fueled by several key factors. Firstly, the region's burgeoning manufacturing sector is increasingly leveraging 3D printing for rapid prototyping, customized production, and on-demand manufacturing, enhancing efficiency and reducing lead times. Secondly, government initiatives promoting technological advancements and digital manufacturing in several Asia-Pacific nations are creating a favorable regulatory environment. Thirdly, the decreasing cost of 3D printing technology and the wider availability of materials are making it accessible to a broader range of businesses, from large enterprises to small and medium-sized enterprises (SMEs). Furthermore, advancements in additive manufacturing techniques, such as multi-material printing and improved resolution, are expanding the applications and potential of 3D printing.
However, challenges remain. The market faces constraints related to the high initial investment costs for advanced 3D printing systems, particularly for SMEs. Skill gaps in operating and maintaining these technologies also pose a hurdle. Despite these limitations, the overall positive trajectory is undeniable, driven by the strong demand for customized products, increasing digitalization, and the region's overall economic growth. The continued development of innovative materials and software solutions, along with strategic partnerships and investments, will further contribute to shaping the future of the Asia Pacific 3D printing landscape. Key players like Stratasys, 3D Systems, and HP are well-positioned to capitalize on this growth, alongside a rapidly evolving ecosystem of regional players and material suppliers.
Asia Pacific 3D Printing Market: A Comprehensive Report (2019-2033)
This in-depth report provides a comprehensive analysis of the Asia Pacific 3D printing market, covering market dynamics, industry trends, key players, and future growth prospects. With a study period spanning 2019-2033, a base year of 2025, and a forecast period of 2025-2033, this report offers invaluable insights for businesses, investors, and industry stakeholders seeking to navigate this rapidly evolving sector. The report incorporates detailed analysis of market size and CAGR, as well as granular data on key segments and leading companies such as Stratasys Ltd, 3D Systems Inc, EOS, HP, and many more. Prepare to gain a competitive edge with this data-rich resource.
Asia Pacific 3D Printing Market Market Concentration & Dynamics
The Asia Pacific 3D printing market exhibits a moderately concentrated landscape, with a few major players holding significant market share. However, the presence of numerous smaller companies and startups indicates a dynamic and competitive environment. Innovation ecosystems are thriving, particularly in countries like China, South Korea, and Japan, fostering technological advancements and new product development. Regulatory frameworks vary across the region, impacting market growth in different nations. Substitute products, like traditional manufacturing methods, pose a competitive challenge, while end-user trends toward customized and on-demand production drive market expansion. Mergers and acquisitions (M&A) activity has been moderate, with approximately xx M&A deals recorded in the historical period (2019-2024), indicating consolidation and strategic expansion within the sector.
- Market Share: Top 5 players hold approximately xx% of the market share in 2024.
- M&A Activity: xx deals were recorded between 2019 and 2024.
- Innovation Ecosystems: Concentrated in China, South Korea, and Japan.
- Regulatory Frameworks: Vary significantly across countries in the Asia-Pacific region.
Asia Pacific 3D Printing Market Industry Insights & Trends
The Asia Pacific 3D printing market is experiencing robust growth, driven by increasing adoption across various industries. The market size reached xx Million in 2024 and is projected to reach xx Million by 2033, exhibiting a CAGR of xx% during the forecast period (2025-2033). Technological advancements, such as the development of more efficient and cost-effective 3D printing technologies, are significantly contributing to this growth. Evolving consumer preferences towards personalized products and rapid prototyping are also boosting market expansion. The increasing demand for additive manufacturing in sectors like aerospace, healthcare, and automotive is fueling this trend. Technological disruptions, such as advancements in materials science and software solutions, are revolutionizing 3D printing capabilities, creating new market opportunities.

Key Markets & Segments Leading Asia Pacific 3D Printing Market
China dominates the Asia Pacific 3D printing market, followed by Japan, South Korea, and India. Several factors contribute to this dominance:
- China: Strong government support for technological advancement, a large manufacturing base, and a growing demand for customized products.
- Japan: Advanced technological capabilities, a well-established industrial sector, and a focus on innovation.
- South Korea: High technological proficiency and adoption of 3D printing in various sectors.
- India: Growing industrialization, government initiatives promoting technological growth, and a cost-advantage in manufacturing.
The key segments driving market growth include aerospace, healthcare, automotive, and consumer goods. Rapid technological advancements are making 3D printing more accessible and cost-effective, thereby facilitating its wider adoption across diverse sectors.
Asia Pacific 3D Printing Market Product Developments
Significant product innovations are shaping the Asia Pacific 3D printing market. Advances in materials science are leading to the development of new polymers, metals, and ceramics, enabling 3D printing of more complex and high-performance components. Software advancements are simplifying the design and manufacturing processes, further increasing the accessibility and affordability of 3D printing. These innovations are providing manufacturers with increased design flexibility, reduced production costs, and shorter lead times, giving them a significant competitive edge.
Challenges in the Asia Pacific 3D Printing Market Market
The Asia Pacific 3D printing market faces several challenges. Regulatory hurdles related to safety and standardization vary across different countries, hindering market expansion. Supply chain disruptions and increased material costs can negatively impact profitability. Intense competition among established players and new entrants creates pressure on pricing and margins. Furthermore, the lack of skilled labor and specialized training limits the widespread adoption of 3D printing technology. These challenges collectively reduce market growth by an estimated xx% annually.
Forces Driving Asia Pacific 3D Printing Market Growth
Several factors are driving the growth of the Asia Pacific 3D printing market. Technological advancements, such as the development of faster, more precise, and cost-effective 3D printing technologies, are opening up new possibilities. Economic growth and increasing industrialization in many Asian countries are creating a strong demand for advanced manufacturing solutions. Government initiatives and supportive policies in several countries are encouraging the adoption of 3D printing across various sectors.
Challenges in the Asia Pacific 3D Printing Market Market
Long-term growth in the Asia Pacific 3D printing market will be driven by sustained innovation, strategic partnerships between technology providers and end-users, and expansion into new markets. Collaborative efforts to overcome regulatory hurdles, develop industry standards, and address skilled labor shortages are crucial for realizing this potential. Further investments in research and development to improve materials, processes, and software will unlock further market opportunities.
Emerging Opportunities in Asia Pacific 3D Printing Market
Emerging opportunities lie in the adoption of 3D printing in new markets, such as personalized medicine, construction, and consumer electronics. The development of new materials, such as biocompatible polymers and high-strength metals, is expanding the range of applications. The increasing use of artificial intelligence (AI) and machine learning (ML) in 3D printing design and manufacturing processes is also creating new opportunities for efficiency and customization.
Leading Players in the Asia Pacific 3D Printing Market Sector
- Stratasys Ltd
- 3D Systems Inc
- EOS
- HP
- GE
- Formlabs
- Optec
- Carbon
- Renishaw
- Desktop Printer Manufacturers
- Ultimaker
- Materialise NV
- Sandvik AB
- Hoganas AB
- Evonik Industries AG
- BASF SE
- ExOne Operating LLC
- Markforged
*List Not Exhaustive
Key Milestones in Asia Pacific 3D Printing Market Industry
- August 2023: AddUp's Magic 800 DED machine purchased by ISRO, expanding aerospace 3D printing capabilities in India. This signals significant investment in advanced 3D printing technologies within the aerospace sector.
- January 2024: STPL3D launches its "Made in India" SLS 3D printer, boosting domestic manufacturing and potentially increasing market competition. This highlights a shift toward localized production within the region.
Strategic Outlook for Asia Pacific 3D Printing Market Market
The Asia Pacific 3D printing market is poised for significant growth over the next decade. Strategic investments in research and development, fostering collaborative partnerships, and expanding into new applications will be crucial for realizing this potential. Addressing regulatory challenges and developing a skilled workforce will also play a significant role in unlocking future market opportunities. The market’s potential for growth is immense, driven by technological advancements, industrial expansion, and a shift toward personalized and on-demand manufacturing.
Asia Pacific 3D Printing Market Segmentation
-
1. Hardware
- 1.1. Material Extrusion/FDM
- 1.2. Vat Photopolymerization (SLA, DLP, and CLIP)
- 1.3. Power Bed Fusion (SLS, EBM, SLM etc.)
- 1.4. Material Jetting
- 1.5. DED
- 1.6. Binder Jetting
-
2. End-user Industries
- 2.1. Aerospace and Defense
- 2.2. Healthcare
- 2.3. Automotive
- 2.4. Electronics/Electro-mechanics/Consumer Products
- 2.5. Construction
- 2.6. Education
- 2.7. Art and Fashion
- 2.8. Other End-user Industries
-
3. Application
- 3.1. Prototyping
- 3.2. Tooling
- 3.3. Manufacturing
- 3.4. Other Applications
-
4. Materials
- 4.1. Metals (
- 4.2. Polymers (Resin, Powder, Filament, and Pellets)
- 4.3. Ceramics
- 4.4. Construc
-
5. Form Factor
- 5.1. Solid (Filaments and Pellets)
- 5.2. Powder
Asia Pacific 3D Printing Market Segmentation By Geography
-
1. Asia Pacific
- 1.1. China
- 1.2. Japan
- 1.3. South Korea
- 1.4. India
- 1.5. Australia
- 1.6. New Zealand
- 1.7. Indonesia
- 1.8. Malaysia
- 1.9. Singapore
- 1.10. Thailand
- 1.11. Vietnam
- 1.12. Philippines

Asia Pacific 3D Printing Market REPORT HIGHLIGHTS
| Aspects | Details |
|---|---|
| Study Period | 2019-2033 |
| Base Year | 2024 |
| Estimated Year | 2025 |
| Forecast Period | 2025-2033 |
| Historical Period | 2019-2024 |
| Growth Rate | CAGR of 20.50% from 2019-2033 |
| Segmentation |
|
Table of Contents
- 1. Introduction
- 1.1. Research Scope
- 1.2. Market Segmentation
- 1.3. Research Methodology
- 1.4. Definitions and Assumptions
- 2. Executive Summary
- 2.1. Introduction
- 3. Market Dynamics
- 3.1. Introduction
- 3.2. Market Drivers
- 3.2.1. Increased Focus on High-volume Production using 3D Printing and Advancements in 3D Printing Software; Deployment of Advanced 3D Printing Materials
- 3.3. Market Restrains
- 3.3.1. Increased Focus on High-volume Production using 3D Printing and Advancements in 3D Printing Software; Deployment of Advanced 3D Printing Materials
- 3.4. Market Trends
- 3.4.1. The Automotive Segment is Expected to Drive the Market's Growth
- 4. Market Factor Analysis
- 4.1. Porters Five Forces
- 4.2. Supply/Value Chain
- 4.3. PESTEL analysis
- 4.4. Market Entropy
- 4.5. Patent/Trademark Analysis
- 5. Asia Pacific 3D Printing Market Analysis, Insights and Forecast, 2019-2031
- 5.1. Market Analysis, Insights and Forecast - by Hardware
- 5.1.1. Material Extrusion/FDM
- 5.1.2. Vat Photopolymerization (SLA, DLP, and CLIP)
- 5.1.3. Power Bed Fusion (SLS, EBM, SLM etc.)
- 5.1.4. Material Jetting
- 5.1.5. DED
- 5.1.6. Binder Jetting
- 5.2. Market Analysis, Insights and Forecast - by End-user Industries
- 5.2.1. Aerospace and Defense
- 5.2.2. Healthcare
- 5.2.3. Automotive
- 5.2.4. Electronics/Electro-mechanics/Consumer Products
- 5.2.5. Construction
- 5.2.6. Education
- 5.2.7. Art and Fashion
- 5.2.8. Other End-user Industries
- 5.3. Market Analysis, Insights and Forecast - by Application
- 5.3.1. Prototyping
- 5.3.2. Tooling
- 5.3.3. Manufacturing
- 5.3.4. Other Applications
- 5.4. Market Analysis, Insights and Forecast - by Materials
- 5.4.1. Metals (
- 5.4.2. Polymers (Resin, Powder, Filament, and Pellets)
- 5.4.3. Ceramics
- 5.4.4. Construc
- 5.5. Market Analysis, Insights and Forecast - by Form Factor
- 5.5.1. Solid (Filaments and Pellets)
- 5.5.2. Powder
- 5.6. Market Analysis, Insights and Forecast - by Region
- 5.6.1. Asia Pacific
- 5.1. Market Analysis, Insights and Forecast - by Hardware
- 6. Competitive Analysis
- 6.1. Market Share Analysis 2024
- 6.2. Company Profiles
- 6.2.1 Stratasys Ltd
- 6.2.1.1. Overview
- 6.2.1.2. Products
- 6.2.1.3. SWOT Analysis
- 6.2.1.4. Recent Developments
- 6.2.1.5. Financials (Based on Availability)
- 6.2.2 3D Systems Inc
- 6.2.2.1. Overview
- 6.2.2.2. Products
- 6.2.2.3. SWOT Analysis
- 6.2.2.4. Recent Developments
- 6.2.2.5. Financials (Based on Availability)
- 6.2.3 EOS
- 6.2.3.1. Overview
- 6.2.3.2. Products
- 6.2.3.3. SWOT Analysis
- 6.2.3.4. Recent Developments
- 6.2.3.5. Financials (Based on Availability)
- 6.2.4 HP
- 6.2.4.1. Overview
- 6.2.4.2. Products
- 6.2.4.3. SWOT Analysis
- 6.2.4.4. Recent Developments
- 6.2.4.5. Financials (Based on Availability)
- 6.2.5 GE
- 6.2.5.1. Overview
- 6.2.5.2. Products
- 6.2.5.3. SWOT Analysis
- 6.2.5.4. Recent Developments
- 6.2.5.5. Financials (Based on Availability)
- 6.2.6 Formlabs
- 6.2.6.1. Overview
- 6.2.6.2. Products
- 6.2.6.3. SWOT Analysis
- 6.2.6.4. Recent Developments
- 6.2.6.5. Financials (Based on Availability)
- 6.2.7 Optec
- 6.2.7.1. Overview
- 6.2.7.2. Products
- 6.2.7.3. SWOT Analysis
- 6.2.7.4. Recent Developments
- 6.2.7.5. Financials (Based on Availability)
- 6.2.8 Carbon
- 6.2.8.1. Overview
- 6.2.8.2. Products
- 6.2.8.3. SWOT Analysis
- 6.2.8.4. Recent Developments
- 6.2.8.5. Financials (Based on Availability)
- 6.2.9 Renishaw
- 6.2.9.1. Overview
- 6.2.9.2. Products
- 6.2.9.3. SWOT Analysis
- 6.2.9.4. Recent Developments
- 6.2.9.5. Financials (Based on Availability)
- 6.2.10 Desktop Printer Manufacturers
- 6.2.10.1. Overview
- 6.2.10.2. Products
- 6.2.10.3. SWOT Analysis
- 6.2.10.4. Recent Developments
- 6.2.10.5. Financials (Based on Availability)
- 6.2.11 Ultimaker
- 6.2.11.1. Overview
- 6.2.11.2. Products
- 6.2.11.3. SWOT Analysis
- 6.2.11.4. Recent Developments
- 6.2.11.5. Financials (Based on Availability)
- 6.2.12 Materialise NV
- 6.2.12.1. Overview
- 6.2.12.2. Products
- 6.2.12.3. SWOT Analysis
- 6.2.12.4. Recent Developments
- 6.2.12.5. Financials (Based on Availability)
- 6.2.13 Sandvik AB
- 6.2.13.1. Overview
- 6.2.13.2. Products
- 6.2.13.3. SWOT Analysis
- 6.2.13.4. Recent Developments
- 6.2.13.5. Financials (Based on Availability)
- 6.2.14 Hoganas AB
- 6.2.14.1. Overview
- 6.2.14.2. Products
- 6.2.14.3. SWOT Analysis
- 6.2.14.4. Recent Developments
- 6.2.14.5. Financials (Based on Availability)
- 6.2.15 Evonik Industries AG
- 6.2.15.1. Overview
- 6.2.15.2. Products
- 6.2.15.3. SWOT Analysis
- 6.2.15.4. Recent Developments
- 6.2.15.5. Financials (Based on Availability)
- 6.2.16 BASF SE
- 6.2.16.1. Overview
- 6.2.16.2. Products
- 6.2.16.3. SWOT Analysis
- 6.2.16.4. Recent Developments
- 6.2.16.5. Financials (Based on Availability)
- 6.2.17 ExOne Operating LLC
- 6.2.17.1. Overview
- 6.2.17.2. Products
- 6.2.17.3. SWOT Analysis
- 6.2.17.4. Recent Developments
- 6.2.17.5. Financials (Based on Availability)
- 6.2.18 Markforged*List Not Exhaustive
- 6.2.18.1. Overview
- 6.2.18.2. Products
- 6.2.18.3. SWOT Analysis
- 6.2.18.4. Recent Developments
- 6.2.18.5. Financials (Based on Availability)
- 6.2.1 Stratasys Ltd
List of Figures
- Figure 1: Asia Pacific 3D Printing Market Revenue Breakdown (Million, %) by Product 2024 & 2032
- Figure 2: Asia Pacific 3D Printing Market Share (%) by Company 2024
List of Tables
- Table 1: Asia Pacific 3D Printing Market Revenue Million Forecast, by Region 2019 & 2032
- Table 2: Asia Pacific 3D Printing Market Volume Billion Forecast, by Region 2019 & 2032
- Table 3: Asia Pacific 3D Printing Market Revenue Million Forecast, by Hardware 2019 & 2032
- Table 4: Asia Pacific 3D Printing Market Volume Billion Forecast, by Hardware 2019 & 2032
- Table 5: Asia Pacific 3D Printing Market Revenue Million Forecast, by End-user Industries 2019 & 2032
- Table 6: Asia Pacific 3D Printing Market Volume Billion Forecast, by End-user Industries 2019 & 2032
- Table 7: Asia Pacific 3D Printing Market Revenue Million Forecast, by Application 2019 & 2032
- Table 8: Asia Pacific 3D Printing Market Volume Billion Forecast, by Application 2019 & 2032
- Table 9: Asia Pacific 3D Printing Market Revenue Million Forecast, by Materials 2019 & 2032
- Table 10: Asia Pacific 3D Printing Market Volume Billion Forecast, by Materials 2019 & 2032
- Table 11: Asia Pacific 3D Printing Market Revenue Million Forecast, by Form Factor 2019 & 2032
- Table 12: Asia Pacific 3D Printing Market Volume Billion Forecast, by Form Factor 2019 & 2032
- Table 13: Asia Pacific 3D Printing Market Revenue Million Forecast, by Region 2019 & 2032
- Table 14: Asia Pacific 3D Printing Market Volume Billion Forecast, by Region 2019 & 2032
- Table 15: Asia Pacific 3D Printing Market Revenue Million Forecast, by Hardware 2019 & 2032
- Table 16: Asia Pacific 3D Printing Market Volume Billion Forecast, by Hardware 2019 & 2032
- Table 17: Asia Pacific 3D Printing Market Revenue Million Forecast, by End-user Industries 2019 & 2032
- Table 18: Asia Pacific 3D Printing Market Volume Billion Forecast, by End-user Industries 2019 & 2032
- Table 19: Asia Pacific 3D Printing Market Revenue Million Forecast, by Application 2019 & 2032
- Table 20: Asia Pacific 3D Printing Market Volume Billion Forecast, by Application 2019 & 2032
- Table 21: Asia Pacific 3D Printing Market Revenue Million Forecast, by Materials 2019 & 2032
- Table 22: Asia Pacific 3D Printing Market Volume Billion Forecast, by Materials 2019 & 2032
- Table 23: Asia Pacific 3D Printing Market Revenue Million Forecast, by Form Factor 2019 & 2032
- Table 24: Asia Pacific 3D Printing Market Volume Billion Forecast, by Form Factor 2019 & 2032
- Table 25: Asia Pacific 3D Printing Market Revenue Million Forecast, by Country 2019 & 2032
- Table 26: Asia Pacific 3D Printing Market Volume Billion Forecast, by Country 2019 & 2032
- Table 27: China Asia Pacific 3D Printing Market Revenue (Million) Forecast, by Application 2019 & 2032
- Table 28: China Asia Pacific 3D Printing Market Volume (Billion) Forecast, by Application 2019 & 2032
- Table 29: Japan Asia Pacific 3D Printing Market Revenue (Million) Forecast, by Application 2019 & 2032
- Table 30: Japan Asia Pacific 3D Printing Market Volume (Billion) Forecast, by Application 2019 & 2032
- Table 31: South Korea Asia Pacific 3D Printing Market Revenue (Million) Forecast, by Application 2019 & 2032
- Table 32: South Korea Asia Pacific 3D Printing Market Volume (Billion) Forecast, by Application 2019 & 2032
- Table 33: India Asia Pacific 3D Printing Market Revenue (Million) Forecast, by Application 2019 & 2032
- Table 34: India Asia Pacific 3D Printing Market Volume (Billion) Forecast, by Application 2019 & 2032
- Table 35: Australia Asia Pacific 3D Printing Market Revenue (Million) Forecast, by Application 2019 & 2032
- Table 36: Australia Asia Pacific 3D Printing Market Volume (Billion) Forecast, by Application 2019 & 2032
- Table 37: New Zealand Asia Pacific 3D Printing Market Revenue (Million) Forecast, by Application 2019 & 2032
- Table 38: New Zealand Asia Pacific 3D Printing Market Volume (Billion) Forecast, by Application 2019 & 2032
- Table 39: Indonesia Asia Pacific 3D Printing Market Revenue (Million) Forecast, by Application 2019 & 2032
- Table 40: Indonesia Asia Pacific 3D Printing Market Volume (Billion) Forecast, by Application 2019 & 2032
- Table 41: Malaysia Asia Pacific 3D Printing Market Revenue (Million) Forecast, by Application 2019 & 2032
- Table 42: Malaysia Asia Pacific 3D Printing Market Volume (Billion) Forecast, by Application 2019 & 2032
- Table 43: Singapore Asia Pacific 3D Printing Market Revenue (Million) Forecast, by Application 2019 & 2032
- Table 44: Singapore Asia Pacific 3D Printing Market Volume (Billion) Forecast, by Application 2019 & 2032
- Table 45: Thailand Asia Pacific 3D Printing Market Revenue (Million) Forecast, by Application 2019 & 2032
- Table 46: Thailand Asia Pacific 3D Printing Market Volume (Billion) Forecast, by Application 2019 & 2032
- Table 47: Vietnam Asia Pacific 3D Printing Market Revenue (Million) Forecast, by Application 2019 & 2032
- Table 48: Vietnam Asia Pacific 3D Printing Market Volume (Billion) Forecast, by Application 2019 & 2032
- Table 49: Philippines Asia Pacific 3D Printing Market Revenue (Million) Forecast, by Application 2019 & 2032
- Table 50: Philippines Asia Pacific 3D Printing Market Volume (Billion) Forecast, by Application 2019 & 2032
Frequently Asked Questions
1. What is the projected Compound Annual Growth Rate (CAGR) of the Asia Pacific 3D Printing Market?
The projected CAGR is approximately 20.50%.
2. Which companies are prominent players in the Asia Pacific 3D Printing Market?
Key companies in the market include Stratasys Ltd, 3D Systems Inc, EOS, HP, GE, Formlabs, Optec, Carbon, Renishaw, Desktop Printer Manufacturers, Ultimaker, Materialise NV, Sandvik AB, Hoganas AB, Evonik Industries AG, BASF SE, ExOne Operating LLC, Markforged*List Not Exhaustive.
3. What are the main segments of the Asia Pacific 3D Printing Market?
The market segments include Hardware, End-user Industries, Application, Materials, Form Factor.
4. Can you provide details about the market size?
The market size is estimated to be USD 7.23 Million as of 2022.
5. What are some drivers contributing to market growth?
Increased Focus on High-volume Production using 3D Printing and Advancements in 3D Printing Software; Deployment of Advanced 3D Printing Materials.
6. What are the notable trends driving market growth?
The Automotive Segment is Expected to Drive the Market's Growth.
7. Are there any restraints impacting market growth?
Increased Focus on High-volume Production using 3D Printing and Advancements in 3D Printing Software; Deployment of Advanced 3D Printing Materials.
8. Can you provide examples of recent developments in the market?
January 2024: STPL3D, a segment of Sahajanand Technologies Pvt. Ltd made expansions to its 3D printing portfolio, showcasing the introduction of its Made in India SLS 3D Printer, which claimed to be designed to elevate the precision, scale, and efficiency of 3D printing. This machine includes a 500 x 500 x 500 mm build volume and a Co2 laser with 100 W power.August 2023: AddUp announced that the Indian Space Research Organisation (ISRO) expanded its aerospace and 3D printing abilities by purchasing a Magic 800 Directed Energy Deposition (DED) machine. AddUp launched the Magic 800 in early 2023, and it is one of its portfolio's largest 5-axis, CNC, blown powder DED machines. The system also has two exchangeable heads, a 2-kW laser, and a build volume of 1,800 x 1,000 x 1,000 mm. It is based on an enclosure inverted design, which facilitates working with reactive powders.
9. What pricing options are available for accessing the report?
Pricing options include single-user, multi-user, and enterprise licenses priced at USD 4750, USD 4950, and USD 6800 respectively.
10. Is the market size provided in terms of value or volume?
The market size is provided in terms of value, measured in Million and volume, measured in Billion.
11. Are there any specific market keywords associated with the report?
Yes, the market keyword associated with the report is "Asia Pacific 3D Printing Market," which aids in identifying and referencing the specific market segment covered.
12. How do I determine which pricing option suits my needs best?
The pricing options vary based on user requirements and access needs. Individual users may opt for single-user licenses, while businesses requiring broader access may choose multi-user or enterprise licenses for cost-effective access to the report.
13. Are there any additional resources or data provided in the Asia Pacific 3D Printing Market report?
While the report offers comprehensive insights, it's advisable to review the specific contents or supplementary materials provided to ascertain if additional resources or data are available.
14. How can I stay updated on further developments or reports in the Asia Pacific 3D Printing Market?
To stay informed about further developments, trends, and reports in the Asia Pacific 3D Printing Market, consider subscribing to industry newsletters, following relevant companies and organizations, or regularly checking reputable industry news sources and publications.
Methodology
Step 1 - Identification of Relevant Samples Size from Population Database


Step 2 - Approaches for Defining Global Market Size (Value, Volume* & Price*)

Note*: In applicable scenarios
Step 3 - Data Sources
Primary Research
- Web Analytics
- Survey Reports
- Research Institute
- Latest Research Reports
- Opinion Leaders
Secondary Research
- Annual Reports
- White Paper
- Latest Press Release
- Industry Association
- Paid Database
- Investor Presentations

Step 4 - Data Triangulation
Involves using different sources of information in order to increase the validity of a study
These sources are likely to be stakeholders in a program - participants, other researchers, program staff, other community members, and so on.
Then we put all data in single framework & apply various statistical tools to find out the dynamic on the market.
During the analysis stage, feedback from the stakeholder groups would be compared to determine areas of agreement as well as areas of divergence
