

Key Insights
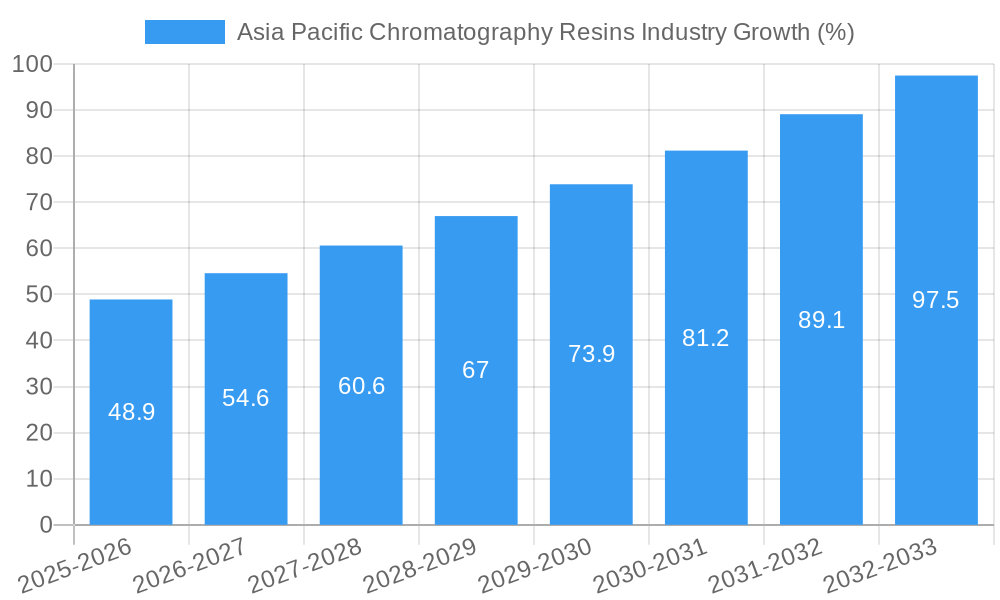
The Asia-Pacific chromatography resins market, valued at $646.7 million in 2025, is projected for robust growth, exhibiting a Compound Annual Growth Rate (CAGR) exceeding 7.00% from 2025 to 2033. This expansion is fueled by several key factors. The burgeoning pharmaceutical industry in the region, particularly in China, India, and Japan, significantly drives demand for high-purity compounds requiring advanced separation techniques. Increased investment in research and development across various sectors, including food and beverages and environmental monitoring, further contributes to market growth. The rising adoption of sophisticated chromatography technologies, such as ion exchange and affinity chromatography resins, is also a major contributing factor. Within the Asia-Pacific region, China's substantial pharmaceutical manufacturing capacity and expanding biotechnology sector are expected to be major contributors to market expansion. Furthermore, the growing awareness of food safety and quality control within the food and beverage industry is also driving demand for advanced purification techniques utilizing chromatography resins. Government initiatives promoting technological advancements and infrastructure development in various industries across the region are also supportive of this growth trajectory.
However, challenges exist. Price fluctuations in raw materials used in resin production could impact profitability. Competition from established global players might also influence pricing strategies. The market's growth will also depend on sustained investments in research and development and the continued adoption of advanced chromatography techniques by end-user industries across the region. Nevertheless, the long-term outlook for the Asia-Pacific chromatography resins market remains positive, given the region's robust economic growth and the growing need for advanced purification and separation technologies across diverse sectors. The diversification of the market across segments such as drug production, food and beverage, and environmental agencies signifies a robust and resilient industry positioned for continuous expansion.

Asia Pacific Chromatography Resins Industry: A Comprehensive Market Report (2019-2033)
This comprehensive report provides an in-depth analysis of the Asia Pacific Chromatography Resins industry, offering invaluable insights for stakeholders, investors, and industry professionals. The study covers the period 2019-2033, with a base year of 2025 and a forecast period of 2025-2033. The report meticulously examines market dynamics, key segments, leading players, and future growth opportunities, utilizing robust data and projections. Expect detailed breakdowns of market size (in Millions), CAGR, and market share, alongside identification of key trends and challenges shaping this dynamic sector.
Asia Pacific Chromatography Resins Industry Market Concentration & Dynamics
The Asia Pacific Chromatography Resins market exhibits a moderately concentrated landscape, with key players such as General Electric, Bio-Rad Laboratories Inc, Merck KGaA, Mitsubishi Chemical Corporation, DuPont, Pall Corporation, Tosoh Bioscience LLC, Purolite, Agilent Technologies, Avantor Inc, and Thermo Fisher Scientific holding significant market share. The exact market share distribution is dynamic and varies across segments. However, the combined market share of the top five players is estimated to be around xx%.
Market Dynamics:
- Innovation Ecosystems: Significant R&D investments are driving innovation in resin technologies, particularly in areas like high-throughput screening and customized resin development. The emergence of novel chromatographic techniques further fuels this dynamism.
- Regulatory Frameworks: Stringent regulatory requirements related to product safety and quality standards, particularly within the pharmaceutical and food & beverage sectors, influence market growth and adoption of advanced technologies.
- Substitute Products: The market faces competition from alternative separation technologies, albeit limited due to the high specificity and efficiency of chromatography resins in specific applications.
- End-User Trends: Growing demand for high-purity products in various applications, including pharmaceuticals, biotechnology, and environmental monitoring, fuels market expansion. Increased adoption of advanced analytical techniques also contributes to demand.
- M&A Activities: The last five years (2019-2024) have witnessed xx M&A deals in the Asia Pacific Chromatography Resins industry, primarily driven by strategic acquisitions aimed at expanding product portfolios and market reach. The majority of deals involved smaller companies being acquired by larger industry players.
Asia Pacific Chromatography Resins Industry Insights & Trends
The Asia Pacific Chromatography Resins market is experiencing robust growth, driven by factors such as increasing demand from the pharmaceutical and biotechnology industries, rising environmental concerns, and growing adoption of advanced analytical techniques. The market size in 2025 is estimated at $xx Million and is projected to reach $xx Million by 2033, exhibiting a CAGR of xx%.
Several factors contribute to this growth, including:
- Technological Advancements: The development of novel resin materials with enhanced selectivity, efficiency, and stability is propelling market expansion. Improvements in resin design and manufacturing processes are also driving growth.
- Rising Demand from Pharmaceuticals: The increasing demand for biopharmaceuticals and the growing emphasis on purification processes are significant growth drivers. This is especially evident in emerging economies within the Asia Pacific region.
- Government Initiatives: Environmental regulations and initiatives aimed at improving water and air quality are stimulating growth in the environmental monitoring segment.
- Economic Growth: The overall economic growth across several Asian countries fuels investment in advanced analytical technologies, further enhancing market prospects.
Key Markets & Segments Leading Asia Pacific Chromatography Resins Industry
The pharmaceutical segment dominates the Asia Pacific Chromatography Resins market, accounting for approximately xx% of total market revenue in 2025. China and India are the leading countries in the region, driven by their significant pharmaceutical industries and growing investments in healthcare infrastructure.
Key Growth Drivers:
- Pharmaceuticals:
- High demand for high-purity APIs (Active Pharmaceutical Ingredients).
- Increasing investments in biotechnology and biopharmaceutical production.
- Stringent regulatory requirements leading to higher quality control.
- Water and Environmental Agencies:
- Rising concerns about water pollution and contamination.
- Government regulations promoting efficient water treatment technologies.
- Growing investments in infrastructure development for water purification.
- Food and Beverages:
- Increased demand for high-quality food and beverages.
- Stricter food safety regulations driving the adoption of advanced purification methods.
- Rising consumer awareness about food quality and safety.
Dominant Segments:
- Technology: Ion exchange chromatography resins constitute the largest segment, followed by affinity chromatography resins.
- Origin: Synthetic-based resins are currently more prevalent than natural-based resins due to superior performance and scalability.
Asia Pacific Chromatography Resins Industry Product Developments
Recent product innovations focus on developing resins with higher selectivity, improved binding capacity, and enhanced stability. These advancements address the need for more efficient and cost-effective purification processes. Companies are also investing in developing specialized resins for niche applications, such as the purification of specific biomolecules or the removal of specific contaminants. This focus on specialized applications creates a competitive edge by catering to growing demand for bespoke solutions.
Challenges in the Asia Pacific Chromatography Resins Industry Market
The Asia Pacific Chromatography Resins market faces challenges such as fluctuating raw material prices, competition from alternative separation technologies (affecting the market by xx%), and the need to comply with stringent regulatory standards. Supply chain disruptions also pose a significant challenge, affecting production and delivery timelines. The total impact of these challenges on market growth is estimated at around xx% annually.
Forces Driving Asia Pacific Chromatography Resins Industry Growth
Several factors are driving the growth of the Asia Pacific Chromatography Resins industry, including:
- Technological advancements: Development of high-performance resins with improved efficiency and selectivity.
- Government regulations: Stringent environmental regulations are driving the demand for advanced purification technologies.
- Economic growth: Rising disposable incomes in developing economies are boosting demand for high-quality products.
Long-Term Growth Catalysts in the Asia Pacific Chromatography Resins Industry
Long-term growth will be driven by continuous innovations in resin technology, strategic partnerships between resin manufacturers and end-users, and expansion into new markets in Southeast Asia and Oceania. These factors collectively position the market for sustained expansion in the coming decade.
Emerging Opportunities in Asia Pacific Chromatography Resins Industry
Emerging opportunities include the development of novel resin materials for specific applications (e.g., personalized medicine), advancements in process automation and integration, and increased focus on sustainable and environmentally friendly resin production methods. Expanding into niche markets within the food and beverage sector also presents significant potential.
Leading Players in the Asia Pacific Chromatography Resins Industry Sector
- General Electric
- Bio-Rad Laboratories Inc
- Merck KGaA
- Mitsubishi Chemical Corporation
- Dupont
- Pall Corporation
- Tosoh Bioscience LLC
- Purolite
- Agilent Technologies
- Avantor Inc
- Thermo Fisher Scientific
Key Milestones in Asia Pacific Chromatography Resins Industry Industry
- 2020: Launch of a novel affinity chromatography resin by Bio-Rad Laboratories.
- 2021: Merck KGaA expands its manufacturing capacity in China.
- 2022: Acquisition of a smaller resin manufacturer by General Electric.
- 2023: Introduction of a new generation of ion exchange resins by Agilent Technologies.
- 2024: Significant investments in R&D by several leading companies.
Strategic Outlook for Asia Pacific Chromatography Resins Market
The Asia Pacific Chromatography Resins market presents significant growth potential, driven by technological advancements, increasing demand across diverse industries, and supportive government policies. Strategic partnerships, focus on innovation, and expansion into emerging markets are key to capitalizing on the immense opportunities within this sector. The market's future is bright, indicating substantial growth and profitability for key players who adapt and innovate.
Asia Pacific Chromatography Resins Industry Segmentation
-
1. Origin
-
1.1. Natural-based
- 1.1.1. Agarose
- 1.1.2. Dextran
-
1.2. Synthetic-based
- 1.2.1. Silica Gel
- 1.2.2. Aluminum Oxide
- 1.2.3. Polystyrene
- 1.2.4. Other Synthetic-based Resins
-
1.1. Natural-based
-
2. Technology
- 2.1. Ion Exchange Chromatography Resins
- 2.2. Affinity Chromatography Resins
- 2.3. Size Exclusion Chromatography Resins
- 2.4. Hydrophobic Interaction Chromatography Resins
- 2.5. Other Technologies
-
3. End-user Industry
-
3.1. Pharmaceuticals
- 3.1.1. Biotechnology
- 3.1.2. Drug Discovery
- 3.1.3. Drug Production
- 3.2. Water and Environmental Agencies
- 3.3. Food and Beverages
- 3.4. Other End-user Industries
-
3.1. Pharmaceuticals
-
4. Geography
- 4.1. China
- 4.2. India
- 4.3. Japan
- 4.4. Rest of Asia-Pacific
Asia Pacific Chromatography Resins Industry Segmentation By Geography
- 1. China
- 2. India
- 3. Japan
- 4. Rest of Asia Pacific

Asia Pacific Chromatography Resins Industry REPORT HIGHLIGHTS
| Aspects | Details |
|---|---|
| Study Period | 2019-2033 |
| Base Year | 2024 |
| Estimated Year | 2025 |
| Forecast Period | 2025-2033 |
| Historical Period | 2019-2024 |
| Growth Rate | CAGR of > 7.00% from 2019-2033 |
| Segmentation |
|
Table of Contents
- 1. Introduction
- 1.1. Research Scope
- 1.2. Market Segmentation
- 1.3. Research Methodology
- 1.4. Definitions and Assumptions
- 2. Executive Summary
- 2.1. Introduction
- 3. Market Dynamics
- 3.1. Introduction
- 3.2. Market Drivers
- 3.2.1. ; Rising Demand from the Pharmaceutical Sector; Technological Advancements in Chromatography Resins; Increasing Importance of Chromatography Tests in Drug Approvals
- 3.3. Market Restrains
- 3.3.1. ; High Costs vs. Productivity of Chromatography Systems
- 3.4. Market Trends
- 3.4.1. Increasing Demand from Pharmaceutical Sector
- 4. Market Factor Analysis
- 4.1. Porters Five Forces
- 4.2. Supply/Value Chain
- 4.3. PESTEL analysis
- 4.4. Market Entropy
- 4.5. Patent/Trademark Analysis
- 5. Asia Pacific Chromatography Resins Industry Analysis, Insights and Forecast, 2019-2031
- 5.1. Market Analysis, Insights and Forecast - by Origin
- 5.1.1. Natural-based
- 5.1.1.1. Agarose
- 5.1.1.2. Dextran
- 5.1.2. Synthetic-based
- 5.1.2.1. Silica Gel
- 5.1.2.2. Aluminum Oxide
- 5.1.2.3. Polystyrene
- 5.1.2.4. Other Synthetic-based Resins
- 5.1.1. Natural-based
- 5.2. Market Analysis, Insights and Forecast - by Technology
- 5.2.1. Ion Exchange Chromatography Resins
- 5.2.2. Affinity Chromatography Resins
- 5.2.3. Size Exclusion Chromatography Resins
- 5.2.4. Hydrophobic Interaction Chromatography Resins
- 5.2.5. Other Technologies
- 5.3. Market Analysis, Insights and Forecast - by End-user Industry
- 5.3.1. Pharmaceuticals
- 5.3.1.1. Biotechnology
- 5.3.1.2. Drug Discovery
- 5.3.1.3. Drug Production
- 5.3.2. Water and Environmental Agencies
- 5.3.3. Food and Beverages
- 5.3.4. Other End-user Industries
- 5.3.1. Pharmaceuticals
- 5.4. Market Analysis, Insights and Forecast - by Geography
- 5.4.1. China
- 5.4.2. India
- 5.4.3. Japan
- 5.4.4. Rest of Asia-Pacific
- 5.5. Market Analysis, Insights and Forecast - by Region
- 5.5.1. China
- 5.5.2. India
- 5.5.3. Japan
- 5.5.4. Rest of Asia Pacific
- 5.1. Market Analysis, Insights and Forecast - by Origin
- 6. China Asia Pacific Chromatography Resins Industry Analysis, Insights and Forecast, 2019-2031
- 6.1. Market Analysis, Insights and Forecast - by Origin
- 6.1.1. Natural-based
- 6.1.1.1. Agarose
- 6.1.1.2. Dextran
- 6.1.2. Synthetic-based
- 6.1.2.1. Silica Gel
- 6.1.2.2. Aluminum Oxide
- 6.1.2.3. Polystyrene
- 6.1.2.4. Other Synthetic-based Resins
- 6.1.1. Natural-based
- 6.2. Market Analysis, Insights and Forecast - by Technology
- 6.2.1. Ion Exchange Chromatography Resins
- 6.2.2. Affinity Chromatography Resins
- 6.2.3. Size Exclusion Chromatography Resins
- 6.2.4. Hydrophobic Interaction Chromatography Resins
- 6.2.5. Other Technologies
- 6.3. Market Analysis, Insights and Forecast - by End-user Industry
- 6.3.1. Pharmaceuticals
- 6.3.1.1. Biotechnology
- 6.3.1.2. Drug Discovery
- 6.3.1.3. Drug Production
- 6.3.2. Water and Environmental Agencies
- 6.3.3. Food and Beverages
- 6.3.4. Other End-user Industries
- 6.3.1. Pharmaceuticals
- 6.4. Market Analysis, Insights and Forecast - by Geography
- 6.4.1. China
- 6.4.2. India
- 6.4.3. Japan
- 6.4.4. Rest of Asia-Pacific
- 6.1. Market Analysis, Insights and Forecast - by Origin
- 7. India Asia Pacific Chromatography Resins Industry Analysis, Insights and Forecast, 2019-2031
- 7.1. Market Analysis, Insights and Forecast - by Origin
- 7.1.1. Natural-based
- 7.1.1.1. Agarose
- 7.1.1.2. Dextran
- 7.1.2. Synthetic-based
- 7.1.2.1. Silica Gel
- 7.1.2.2. Aluminum Oxide
- 7.1.2.3. Polystyrene
- 7.1.2.4. Other Synthetic-based Resins
- 7.1.1. Natural-based
- 7.2. Market Analysis, Insights and Forecast - by Technology
- 7.2.1. Ion Exchange Chromatography Resins
- 7.2.2. Affinity Chromatography Resins
- 7.2.3. Size Exclusion Chromatography Resins
- 7.2.4. Hydrophobic Interaction Chromatography Resins
- 7.2.5. Other Technologies
- 7.3. Market Analysis, Insights and Forecast - by End-user Industry
- 7.3.1. Pharmaceuticals
- 7.3.1.1. Biotechnology
- 7.3.1.2. Drug Discovery
- 7.3.1.3. Drug Production
- 7.3.2. Water and Environmental Agencies
- 7.3.3. Food and Beverages
- 7.3.4. Other End-user Industries
- 7.3.1. Pharmaceuticals
- 7.4. Market Analysis, Insights and Forecast - by Geography
- 7.4.1. China
- 7.4.2. India
- 7.4.3. Japan
- 7.4.4. Rest of Asia-Pacific
- 7.1. Market Analysis, Insights and Forecast - by Origin
- 8. Japan Asia Pacific Chromatography Resins Industry Analysis, Insights and Forecast, 2019-2031
- 8.1. Market Analysis, Insights and Forecast - by Origin
- 8.1.1. Natural-based
- 8.1.1.1. Agarose
- 8.1.1.2. Dextran
- 8.1.2. Synthetic-based
- 8.1.2.1. Silica Gel
- 8.1.2.2. Aluminum Oxide
- 8.1.2.3. Polystyrene
- 8.1.2.4. Other Synthetic-based Resins
- 8.1.1. Natural-based
- 8.2. Market Analysis, Insights and Forecast - by Technology
- 8.2.1. Ion Exchange Chromatography Resins
- 8.2.2. Affinity Chromatography Resins
- 8.2.3. Size Exclusion Chromatography Resins
- 8.2.4. Hydrophobic Interaction Chromatography Resins
- 8.2.5. Other Technologies
- 8.3. Market Analysis, Insights and Forecast - by End-user Industry
- 8.3.1. Pharmaceuticals
- 8.3.1.1. Biotechnology
- 8.3.1.2. Drug Discovery
- 8.3.1.3. Drug Production
- 8.3.2. Water and Environmental Agencies
- 8.3.3. Food and Beverages
- 8.3.4. Other End-user Industries
- 8.3.1. Pharmaceuticals
- 8.4. Market Analysis, Insights and Forecast - by Geography
- 8.4.1. China
- 8.4.2. India
- 8.4.3. Japan
- 8.4.4. Rest of Asia-Pacific
- 8.1. Market Analysis, Insights and Forecast - by Origin
- 9. Rest of Asia Pacific Asia Pacific Chromatography Resins Industry Analysis, Insights and Forecast, 2019-2031
- 9.1. Market Analysis, Insights and Forecast - by Origin
- 9.1.1. Natural-based
- 9.1.1.1. Agarose
- 9.1.1.2. Dextran
- 9.1.2. Synthetic-based
- 9.1.2.1. Silica Gel
- 9.1.2.2. Aluminum Oxide
- 9.1.2.3. Polystyrene
- 9.1.2.4. Other Synthetic-based Resins
- 9.1.1. Natural-based
- 9.2. Market Analysis, Insights and Forecast - by Technology
- 9.2.1. Ion Exchange Chromatography Resins
- 9.2.2. Affinity Chromatography Resins
- 9.2.3. Size Exclusion Chromatography Resins
- 9.2.4. Hydrophobic Interaction Chromatography Resins
- 9.2.5. Other Technologies
- 9.3. Market Analysis, Insights and Forecast - by End-user Industry
- 9.3.1. Pharmaceuticals
- 9.3.1.1. Biotechnology
- 9.3.1.2. Drug Discovery
- 9.3.1.3. Drug Production
- 9.3.2. Water and Environmental Agencies
- 9.3.3. Food and Beverages
- 9.3.4. Other End-user Industries
- 9.3.1. Pharmaceuticals
- 9.4. Market Analysis, Insights and Forecast - by Geography
- 9.4.1. China
- 9.4.2. India
- 9.4.3. Japan
- 9.4.4. Rest of Asia-Pacific
- 9.1. Market Analysis, Insights and Forecast - by Origin
- 10. China Asia Pacific Chromatography Resins Industry Analysis, Insights and Forecast, 2019-2031
- 11. Japan Asia Pacific Chromatography Resins Industry Analysis, Insights and Forecast, 2019-2031
- 12. India Asia Pacific Chromatography Resins Industry Analysis, Insights and Forecast, 2019-2031
- 13. South Korea Asia Pacific Chromatography Resins Industry Analysis, Insights and Forecast, 2019-2031
- 14. Taiwan Asia Pacific Chromatography Resins Industry Analysis, Insights and Forecast, 2019-2031
- 15. Australia Asia Pacific Chromatography Resins Industry Analysis, Insights and Forecast, 2019-2031
- 16. Rest of Asia-Pacific Asia Pacific Chromatography Resins Industry Analysis, Insights and Forecast, 2019-2031
- 17. Competitive Analysis
- 17.1. Market Share Analysis 2024
- 17.2. Company Profiles
- 17.2.1 General Electric
- 17.2.1.1. Overview
- 17.2.1.2. Products
- 17.2.1.3. SWOT Analysis
- 17.2.1.4. Recent Developments
- 17.2.1.5. Financials (Based on Availability)
- 17.2.2 Bio-Rad Laboratories Inc
- 17.2.2.1. Overview
- 17.2.2.2. Products
- 17.2.2.3. SWOT Analysis
- 17.2.2.4. Recent Developments
- 17.2.2.5. Financials (Based on Availability)
- 17.2.3 Merck KGaA
- 17.2.3.1. Overview
- 17.2.3.2. Products
- 17.2.3.3. SWOT Analysis
- 17.2.3.4. Recent Developments
- 17.2.3.5. Financials (Based on Availability)
- 17.2.4 Mitsubishi Chemical Corporation
- 17.2.4.1. Overview
- 17.2.4.2. Products
- 17.2.4.3. SWOT Analysis
- 17.2.4.4. Recent Developments
- 17.2.4.5. Financials (Based on Availability)
- 17.2.5 Dupont
- 17.2.5.1. Overview
- 17.2.5.2. Products
- 17.2.5.3. SWOT Analysis
- 17.2.5.4. Recent Developments
- 17.2.5.5. Financials (Based on Availability)
- 17.2.6 Pall Corporation
- 17.2.6.1. Overview
- 17.2.6.2. Products
- 17.2.6.3. SWOT Analysis
- 17.2.6.4. Recent Developments
- 17.2.6.5. Financials (Based on Availability)
- 17.2.7 Tosoh Bioscience LLC*List Not Exhaustive
- 17.2.7.1. Overview
- 17.2.7.2. Products
- 17.2.7.3. SWOT Analysis
- 17.2.7.4. Recent Developments
- 17.2.7.5. Financials (Based on Availability)
- 17.2.8 Purolite
- 17.2.8.1. Overview
- 17.2.8.2. Products
- 17.2.8.3. SWOT Analysis
- 17.2.8.4. Recent Developments
- 17.2.8.5. Financials (Based on Availability)
- 17.2.9 Agilient Technologies
- 17.2.9.1. Overview
- 17.2.9.2. Products
- 17.2.9.3. SWOT Analysis
- 17.2.9.4. Recent Developments
- 17.2.9.5. Financials (Based on Availability)
- 17.2.10 Avantor Inc
- 17.2.10.1. Overview
- 17.2.10.2. Products
- 17.2.10.3. SWOT Analysis
- 17.2.10.4. Recent Developments
- 17.2.10.5. Financials (Based on Availability)
- 17.2.11 Thermo Fisher Scientific
- 17.2.11.1. Overview
- 17.2.11.2. Products
- 17.2.11.3. SWOT Analysis
- 17.2.11.4. Recent Developments
- 17.2.11.5. Financials (Based on Availability)
- 17.2.1 General Electric
List of Figures
- Figure 1: Asia Pacific Chromatography Resins Industry Revenue Breakdown (Million, %) by Product 2024 & 2032
- Figure 2: Asia Pacific Chromatography Resins Industry Share (%) by Company 2024
List of Tables
- Table 1: Asia Pacific Chromatography Resins Industry Revenue Million Forecast, by Region 2019 & 2032
- Table 2: Asia Pacific Chromatography Resins Industry Volume K Tons Forecast, by Region 2019 & 2032
- Table 3: Asia Pacific Chromatography Resins Industry Revenue Million Forecast, by Origin 2019 & 2032
- Table 4: Asia Pacific Chromatography Resins Industry Volume K Tons Forecast, by Origin 2019 & 2032
- Table 5: Asia Pacific Chromatography Resins Industry Revenue Million Forecast, by Technology 2019 & 2032
- Table 6: Asia Pacific Chromatography Resins Industry Volume K Tons Forecast, by Technology 2019 & 2032
- Table 7: Asia Pacific Chromatography Resins Industry Revenue Million Forecast, by End-user Industry 2019 & 2032
- Table 8: Asia Pacific Chromatography Resins Industry Volume K Tons Forecast, by End-user Industry 2019 & 2032
- Table 9: Asia Pacific Chromatography Resins Industry Revenue Million Forecast, by Geography 2019 & 2032
- Table 10: Asia Pacific Chromatography Resins Industry Volume K Tons Forecast, by Geography 2019 & 2032
- Table 11: Asia Pacific Chromatography Resins Industry Revenue Million Forecast, by Region 2019 & 2032
- Table 12: Asia Pacific Chromatography Resins Industry Volume K Tons Forecast, by Region 2019 & 2032
- Table 13: Asia Pacific Chromatography Resins Industry Revenue Million Forecast, by Country 2019 & 2032
- Table 14: Asia Pacific Chromatography Resins Industry Volume K Tons Forecast, by Country 2019 & 2032
- Table 15: China Asia Pacific Chromatography Resins Industry Revenue (Million) Forecast, by Application 2019 & 2032
- Table 16: China Asia Pacific Chromatography Resins Industry Volume (K Tons) Forecast, by Application 2019 & 2032
- Table 17: Japan Asia Pacific Chromatography Resins Industry Revenue (Million) Forecast, by Application 2019 & 2032
- Table 18: Japan Asia Pacific Chromatography Resins Industry Volume (K Tons) Forecast, by Application 2019 & 2032
- Table 19: India Asia Pacific Chromatography Resins Industry Revenue (Million) Forecast, by Application 2019 & 2032
- Table 20: India Asia Pacific Chromatography Resins Industry Volume (K Tons) Forecast, by Application 2019 & 2032
- Table 21: South Korea Asia Pacific Chromatography Resins Industry Revenue (Million) Forecast, by Application 2019 & 2032
- Table 22: South Korea Asia Pacific Chromatography Resins Industry Volume (K Tons) Forecast, by Application 2019 & 2032
- Table 23: Taiwan Asia Pacific Chromatography Resins Industry Revenue (Million) Forecast, by Application 2019 & 2032
- Table 24: Taiwan Asia Pacific Chromatography Resins Industry Volume (K Tons) Forecast, by Application 2019 & 2032
- Table 25: Australia Asia Pacific Chromatography Resins Industry Revenue (Million) Forecast, by Application 2019 & 2032
- Table 26: Australia Asia Pacific Chromatography Resins Industry Volume (K Tons) Forecast, by Application 2019 & 2032
- Table 27: Rest of Asia-Pacific Asia Pacific Chromatography Resins Industry Revenue (Million) Forecast, by Application 2019 & 2032
- Table 28: Rest of Asia-Pacific Asia Pacific Chromatography Resins Industry Volume (K Tons) Forecast, by Application 2019 & 2032
- Table 29: Asia Pacific Chromatography Resins Industry Revenue Million Forecast, by Origin 2019 & 2032
- Table 30: Asia Pacific Chromatography Resins Industry Volume K Tons Forecast, by Origin 2019 & 2032
- Table 31: Asia Pacific Chromatography Resins Industry Revenue Million Forecast, by Technology 2019 & 2032
- Table 32: Asia Pacific Chromatography Resins Industry Volume K Tons Forecast, by Technology 2019 & 2032
- Table 33: Asia Pacific Chromatography Resins Industry Revenue Million Forecast, by End-user Industry 2019 & 2032
- Table 34: Asia Pacific Chromatography Resins Industry Volume K Tons Forecast, by End-user Industry 2019 & 2032
- Table 35: Asia Pacific Chromatography Resins Industry Revenue Million Forecast, by Geography 2019 & 2032
- Table 36: Asia Pacific Chromatography Resins Industry Volume K Tons Forecast, by Geography 2019 & 2032
- Table 37: Asia Pacific Chromatography Resins Industry Revenue Million Forecast, by Country 2019 & 2032
- Table 38: Asia Pacific Chromatography Resins Industry Volume K Tons Forecast, by Country 2019 & 2032
- Table 39: Asia Pacific Chromatography Resins Industry Revenue Million Forecast, by Origin 2019 & 2032
- Table 40: Asia Pacific Chromatography Resins Industry Volume K Tons Forecast, by Origin 2019 & 2032
- Table 41: Asia Pacific Chromatography Resins Industry Revenue Million Forecast, by Technology 2019 & 2032
- Table 42: Asia Pacific Chromatography Resins Industry Volume K Tons Forecast, by Technology 2019 & 2032
- Table 43: Asia Pacific Chromatography Resins Industry Revenue Million Forecast, by End-user Industry 2019 & 2032
- Table 44: Asia Pacific Chromatography Resins Industry Volume K Tons Forecast, by End-user Industry 2019 & 2032
- Table 45: Asia Pacific Chromatography Resins Industry Revenue Million Forecast, by Geography 2019 & 2032
- Table 46: Asia Pacific Chromatography Resins Industry Volume K Tons Forecast, by Geography 2019 & 2032
- Table 47: Asia Pacific Chromatography Resins Industry Revenue Million Forecast, by Country 2019 & 2032
- Table 48: Asia Pacific Chromatography Resins Industry Volume K Tons Forecast, by Country 2019 & 2032
- Table 49: Asia Pacific Chromatography Resins Industry Revenue Million Forecast, by Origin 2019 & 2032
- Table 50: Asia Pacific Chromatography Resins Industry Volume K Tons Forecast, by Origin 2019 & 2032
- Table 51: Asia Pacific Chromatography Resins Industry Revenue Million Forecast, by Technology 2019 & 2032
- Table 52: Asia Pacific Chromatography Resins Industry Volume K Tons Forecast, by Technology 2019 & 2032
- Table 53: Asia Pacific Chromatography Resins Industry Revenue Million Forecast, by End-user Industry 2019 & 2032
- Table 54: Asia Pacific Chromatography Resins Industry Volume K Tons Forecast, by End-user Industry 2019 & 2032
- Table 55: Asia Pacific Chromatography Resins Industry Revenue Million Forecast, by Geography 2019 & 2032
- Table 56: Asia Pacific Chromatography Resins Industry Volume K Tons Forecast, by Geography 2019 & 2032
- Table 57: Asia Pacific Chromatography Resins Industry Revenue Million Forecast, by Country 2019 & 2032
- Table 58: Asia Pacific Chromatography Resins Industry Volume K Tons Forecast, by Country 2019 & 2032
- Table 59: Asia Pacific Chromatography Resins Industry Revenue Million Forecast, by Origin 2019 & 2032
- Table 60: Asia Pacific Chromatography Resins Industry Volume K Tons Forecast, by Origin 2019 & 2032
- Table 61: Asia Pacific Chromatography Resins Industry Revenue Million Forecast, by Technology 2019 & 2032
- Table 62: Asia Pacific Chromatography Resins Industry Volume K Tons Forecast, by Technology 2019 & 2032
- Table 63: Asia Pacific Chromatography Resins Industry Revenue Million Forecast, by End-user Industry 2019 & 2032
- Table 64: Asia Pacific Chromatography Resins Industry Volume K Tons Forecast, by End-user Industry 2019 & 2032
- Table 65: Asia Pacific Chromatography Resins Industry Revenue Million Forecast, by Geography 2019 & 2032
- Table 66: Asia Pacific Chromatography Resins Industry Volume K Tons Forecast, by Geography 2019 & 2032
- Table 67: Asia Pacific Chromatography Resins Industry Revenue Million Forecast, by Country 2019 & 2032
- Table 68: Asia Pacific Chromatography Resins Industry Volume K Tons Forecast, by Country 2019 & 2032
Frequently Asked Questions
1. What is the projected Compound Annual Growth Rate (CAGR) of the Asia Pacific Chromatography Resins Industry?
The projected CAGR is approximately > 7.00%.
2. Which companies are prominent players in the Asia Pacific Chromatography Resins Industry?
Key companies in the market include General Electric, Bio-Rad Laboratories Inc, Merck KGaA, Mitsubishi Chemical Corporation, Dupont, Pall Corporation, Tosoh Bioscience LLC*List Not Exhaustive, Purolite, Agilient Technologies, Avantor Inc, Thermo Fisher Scientific.
3. What are the main segments of the Asia Pacific Chromatography Resins Industry?
The market segments include Origin, Technology, End-user Industry, Geography.
4. Can you provide details about the market size?
The market size is estimated to be USD 646.7 Million as of 2022.
5. What are some drivers contributing to market growth?
; Rising Demand from the Pharmaceutical Sector; Technological Advancements in Chromatography Resins; Increasing Importance of Chromatography Tests in Drug Approvals.
6. What are the notable trends driving market growth?
Increasing Demand from Pharmaceutical Sector.
7. Are there any restraints impacting market growth?
; High Costs vs. Productivity of Chromatography Systems.
8. Can you provide examples of recent developments in the market?
N/A
9. What pricing options are available for accessing the report?
Pricing options include single-user, multi-user, and enterprise licenses priced at USD 4750, USD 5250, and USD 8750 respectively.
10. Is the market size provided in terms of value or volume?
The market size is provided in terms of value, measured in Million and volume, measured in K Tons.
11. Are there any specific market keywords associated with the report?
Yes, the market keyword associated with the report is "Asia Pacific Chromatography Resins Industry," which aids in identifying and referencing the specific market segment covered.
12. How do I determine which pricing option suits my needs best?
The pricing options vary based on user requirements and access needs. Individual users may opt for single-user licenses, while businesses requiring broader access may choose multi-user or enterprise licenses for cost-effective access to the report.
13. Are there any additional resources or data provided in the Asia Pacific Chromatography Resins Industry report?
While the report offers comprehensive insights, it's advisable to review the specific contents or supplementary materials provided to ascertain if additional resources or data are available.
14. How can I stay updated on further developments or reports in the Asia Pacific Chromatography Resins Industry?
To stay informed about further developments, trends, and reports in the Asia Pacific Chromatography Resins Industry, consider subscribing to industry newsletters, following relevant companies and organizations, or regularly checking reputable industry news sources and publications.
Methodology
Step 1 - Identification of Relevant Samples Size from Population Database


Step 2 - Approaches for Defining Global Market Size (Value, Volume* & Price*)

Note*: In applicable scenarios
Step 3 - Data Sources
Primary Research
- Web Analytics
- Survey Reports
- Research Institute
- Latest Research Reports
- Opinion Leaders
Secondary Research
- Annual Reports
- White Paper
- Latest Press Release
- Industry Association
- Paid Database
- Investor Presentations

Step 4 - Data Triangulation
Involves using different sources of information in order to increase the validity of a study
These sources are likely to be stakeholders in a program - participants, other researchers, program staff, other community members, and so on.
Then we put all data in single framework & apply various statistical tools to find out the dynamic on the market.
During the analysis stage, feedback from the stakeholder groups would be compared to determine areas of agreement as well as areas of divergence
