

Key Insights
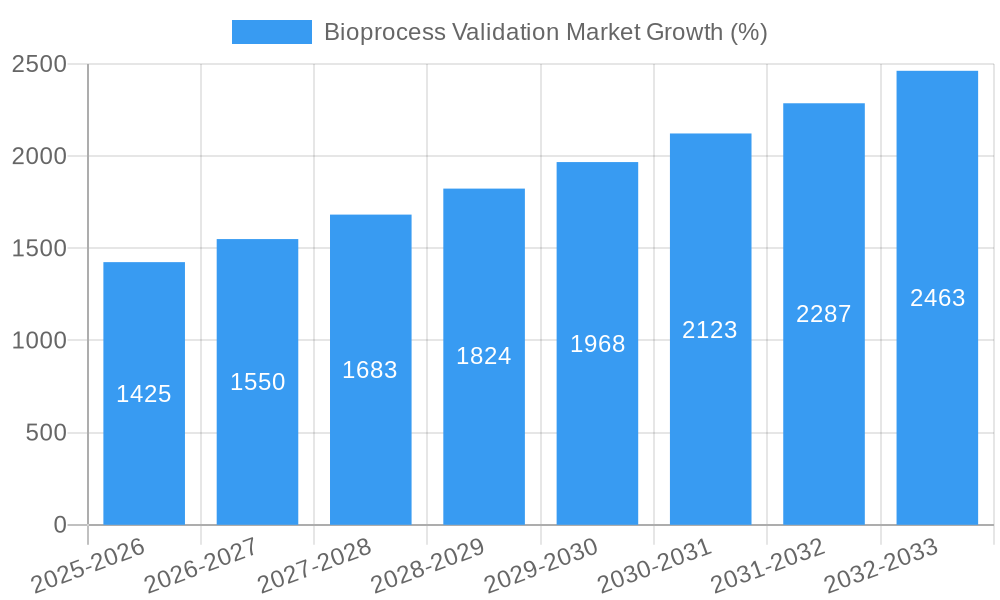
The bioprocess validation market, currently exhibiting robust growth, is projected to reach a substantial size driven by the increasing demand for biopharmaceuticals and advanced therapies. A CAGR of 9.50% from 2019-2033 indicates a significant expansion, fueled primarily by the rising prevalence of chronic diseases necessitating innovative biological treatments. The market is segmented by test type (extractables, microbiological, physiochemical, integrity, compatibility, and others), process component (filters, containers, bags, mixing systems, bioreactors, transfer systems, and others), and end-user (pharmaceutical & biotechnology companies, contract development & manufacturing organizations, and others). The pharmaceutical and biotechnology sectors are key drivers, investing heavily in ensuring product quality, safety, and regulatory compliance. Technological advancements, particularly in automation and data analytics, are streamlining validation processes and enhancing efficiency. Furthermore, the growing adoption of single-use technologies is contributing to market expansion, offering advantages in cost-effectiveness, sterility, and reduced cleaning validation requirements. However, the high cost of validation services and stringent regulatory requirements could pose challenges to market growth. North America and Europe currently hold significant market shares, driven by established biopharmaceutical industries and robust regulatory frameworks; however, the Asia-Pacific region is expected to witness considerable growth due to rising healthcare expenditure and increasing investments in biomanufacturing infrastructure.
The competitive landscape includes prominent players like SGS S.A., Merck KGaA, and Thermo Fisher Scientific, among others. These companies are actively involved in developing innovative validation technologies and expanding their service offerings to cater to the growing needs of the industry. Future growth will likely be influenced by the introduction of novel bioprocessing technologies, the increasing adoption of continuous manufacturing processes, and the expanding application of bioprocess validation in emerging therapeutic areas such as cell and gene therapies. The market's trajectory suggests a strong outlook for continued expansion, driven by the confluence of technological advancements, regulatory compliance needs, and the escalating demand for biologics worldwide. Strategic collaborations, acquisitions, and the development of comprehensive validation packages will be crucial for companies seeking to gain a competitive edge in this dynamic market.

Bioprocess Validation Market: A Comprehensive Report (2019-2033)
This comprehensive report provides an in-depth analysis of the Bioprocess Validation Market, offering valuable insights for stakeholders across the pharmaceutical, biotechnology, and contract manufacturing sectors. The study covers the period 2019-2033, with 2025 as the base and estimated year, and forecasts extending to 2033. The report meticulously examines market dynamics, segmentation, leading players, emerging trends, and growth opportunities, providing actionable intelligence to navigate this rapidly evolving landscape. The market size in 2025 is estimated at xx Million, with a projected CAGR of xx% during the forecast period.
Bioprocess Validation Market Concentration & Dynamics
The Bioprocess Validation market exhibits a moderately concentrated landscape, with several key players holding significant market share. The market share of the top five players is estimated at xx%. However, the presence of numerous smaller players indicates a competitive environment. Innovation plays a crucial role, with companies continuously investing in developing advanced technologies and services to cater to the stringent requirements of the biopharmaceutical industry. Regulatory frameworks, particularly those related to Good Manufacturing Practices (GMP), significantly influence market growth and operational procedures. Substitute products are limited due to the highly specialized nature of bioprocess validation services. End-user trends show a growing preference for outsourcing validation services due to cost-effectiveness and access to specialized expertise. M&A activities are prevalent, with an estimated xx M&A deals in the historical period (2019-2024).
- Market Concentration: Moderately concentrated, top 5 players holding approximately xx% market share.
- Innovation Ecosystem: High level of R&D investment driving technological advancements.
- Regulatory Frameworks: Stringent GMP regulations shaping market practices and growth.
- Substitute Products: Limited due to the specialized nature of the services.
- End-User Trends: Increasing outsourcing of validation services.
- M&A Activity: xx M&A deals during 2019-2024, indicating consolidation and expansion strategies.
Bioprocess Validation Market Industry Insights & Trends
The Bioprocess Validation market is experiencing robust growth driven by the burgeoning biopharmaceutical industry and increasing demand for high-quality biotherapeutics. The market size is estimated at xx Million in 2025 and is projected to reach xx Million by 2033, driven by a CAGR of xx%. Technological disruptions, such as advancements in automation, data analytics, and digital technologies are streamlining validation processes and improving efficiency. Evolving consumer behaviors, including increased focus on quality, safety, and regulatory compliance, further fuel market growth. The rising prevalence of chronic diseases and an aging global population are key factors pushing the demand for biopharmaceuticals, directly benefiting the bioprocess validation market. The increasing demand for personalized medicines is also contributing to the market growth.
Key Markets & Segments Leading Bioprocess Validation Market
The pharmaceutical and biotechnology companies segment dominates the end-user landscape, accounting for the largest market share (approximately xx%). Geographically, North America holds the leading position, followed by Europe. Within the segmentation:
By Test Type: Extractables testing services are currently the largest segment, reflecting stringent regulatory scrutiny.
By Process Component: Filter elements represent the largest segment due to their critical role in bioprocessing.
Growth Drivers:
- Economic Growth: Increased investment in biopharmaceutical R&D in key regions.
- Technological Advancements: Automation, data analytics, and digital technologies.
- Stringent Regulatory Compliance: Growing need for rigorous validation and quality control.
- Infrastructure Development: Expansion of manufacturing facilities and R&D centers.
Dominance Analysis:
North America's dominance stems from established biopharmaceutical industries, stringent regulatory environments, and higher investment in R&D. The large market share held by pharmaceutical & biotechnology companies reflects the industry's dependence on reliable bioprocess validation. Extractables testing services are crucial for ensuring product safety and meeting regulatory requirements. Similarly, filter elements are an indispensable component of bioprocessing, driving demand for their validation.
Bioprocess Validation Market Product Developments
Recent product innovations have focused on enhancing the speed, accuracy, and efficiency of validation processes. The introduction of automated testing systems and advanced analytical techniques has significantly improved throughput and reduced manual errors. Integration of data analytics and AI-powered solutions is optimizing validation protocols and enabling predictive maintenance of bioprocessing equipment. These advancements provide competitive advantages by enhancing product quality, reducing costs, and accelerating time-to-market for biopharmaceuticals.
Challenges in the Bioprocess Validation Market Market
The Bioprocess Validation market faces challenges, including high upfront costs associated with setting up sophisticated testing facilities, regulatory hurdles and evolving compliance requirements, and supply chain disruptions affecting the availability of critical reagents and equipment. Intense competition among service providers also puts pressure on pricing and profit margins. The overall impact of these challenges is an estimated xx% reduction in market growth compared to projected growth without these factors.
Forces Driving Bioprocess Validation Market Growth
Key growth drivers include increasing demand for biologics, technological advancements (automation, AI), stringent regulatory requirements promoting compliance, and rising investments in biopharmaceutical manufacturing capacity expansion. For instance, the expansion of Eppendorf's bioprocess site highlights the industry's growth and consequent demand for validation services.
Challenges in the Bioprocess Validation Market Market (Long-Term Growth Catalysts)
Long-term growth is supported by continuous innovations in bioprocessing technologies, strategic partnerships between service providers and biopharmaceutical companies to offer comprehensive solutions, and expansion into emerging markets such as Asia-Pacific where investment in biopharmaceutical facilities is rapidly growing. These factors will mitigate some of the current challenges and propel market growth beyond 2033.
Emerging Opportunities in Bioprocess Validation Market
Emerging opportunities lie in the growing demand for personalized medicine driving specialized validation needs, the development of novel bioprocessing technologies demanding new validation methods, and the expansion into cell and gene therapy manufacturing, a rapidly growing sector with unique validation challenges.
Leading Players in the Bioprocess Validation Market Sector
- SGS S A
- Meissner Filtration Products
- Labcorp (Toxikon Corporation)
- Almac Group
- Merck KGaA
- Eurofins Scientific
- Cobetter Filtration Equipments Co Ltd
- Pall Corporation
- Sartorius AG
- Thermo Fisher Scientific
- DOC S r l
Key Milestones in Bioprocess Validation Market Industry
- May 2022: Qosina launched its new Bioprocess Resource Center, enhancing industry knowledge and support.
- September 2022: Eppendorf SE expanded its bioprocess site in Jülich, Germany, signifying significant investment in biomanufacturing capacity. This expansion directly increases the demand for validation services.
Strategic Outlook for Bioprocess Validation Market Market
The Bioprocess Validation market presents significant growth potential fueled by continuous technological advancements, increasing demand for biopharmaceuticals, and stringent regulatory landscapes. Strategic opportunities for players include investing in advanced technologies, forging partnerships to offer comprehensive solutions, and expanding into new and emerging markets to capitalize on the long-term growth trajectory.
Bioprocess Validation Market Segmentation
-
1. Test Type
- 1.1. Extractables Testing Services
- 1.2. Microbiological Testing Services
- 1.3. Physiochemical Testing Services
- 1.4. Integrity Testing Services
- 1.5. Compatibility Testing Services
- 1.6. Other Testing Services
-
2. Process Component
- 2.1. Filter Elements
- 2.2. Media containers and bags
- 2.3. Freezing And Thawing Process Bags
- 2.4. Mixing Systems
- 2.5. Bioreactors
- 2.6. Transfer Systems
- 2.7. Others
-
3. End User
- 3.1. Pharmaceutical & Biotechnology Companies
- 3.2. Contract Development & Manufacturing Organizations
- 3.3. Other End Users
Bioprocess Validation Market Segmentation By Geography
-
1. North America
- 1.1. United States
- 1.2. Canada
- 1.3. Mexico
-
2. Europe
- 2.1. Germany
- 2.2. United Kingdom
- 2.3. France
- 2.4. Italy
- 2.5. Spain
- 2.6. Rest of Europe
-
3. Asia Pacific
- 3.1. China
- 3.2. Japan
- 3.3. India
- 3.4. Australia
- 3.5. South Korea
- 3.6. Rest of Asia Pacific
-
4. Middle East and Africa
- 4.1. GCC
- 4.2. South Africa
- 4.3. Rest of Middle East and Africa
-
5. South America
- 5.1. Brazil
- 5.2. Argentina
- 5.3. Rest of South America

Bioprocess Validation Market REPORT HIGHLIGHTS
| Aspects | Details |
|---|---|
| Study Period | 2019-2033 |
| Base Year | 2024 |
| Estimated Year | 2025 |
| Forecast Period | 2025-2033 |
| Historical Period | 2019-2024 |
| Growth Rate | CAGR of 9.50% from 2019-2033 |
| Segmentation |
|
Table of Contents
- 1. Introduction
- 1.1. Research Scope
- 1.2. Market Segmentation
- 1.3. Research Methodology
- 1.4. Definitions and Assumptions
- 2. Executive Summary
- 2.1. Introduction
- 3. Market Dynamics
- 3.1. Introduction
- 3.2. Market Drivers
- 3.2.1. Increasing Demand for Biopharmaceuticals; Increasing Demand for Outsourcing Bioprocess Validation; Rising Life Science R&D Expenditure
- 3.3. Market Restrains
- 3.3.1. Issues Related to Extractables & Leachables
- 3.4. Market Trends
- 3.4.1. Bioreactor Expected to Hold Significant Market Share
- 4. Market Factor Analysis
- 4.1. Porters Five Forces
- 4.2. Supply/Value Chain
- 4.3. PESTEL analysis
- 4.4. Market Entropy
- 4.5. Patent/Trademark Analysis
- 5. Global Bioprocess Validation Market Analysis, Insights and Forecast, 2019-2031
- 5.1. Market Analysis, Insights and Forecast - by Test Type
- 5.1.1. Extractables Testing Services
- 5.1.2. Microbiological Testing Services
- 5.1.3. Physiochemical Testing Services
- 5.1.4. Integrity Testing Services
- 5.1.5. Compatibility Testing Services
- 5.1.6. Other Testing Services
- 5.2. Market Analysis, Insights and Forecast - by Process Component
- 5.2.1. Filter Elements
- 5.2.2. Media containers and bags
- 5.2.3. Freezing And Thawing Process Bags
- 5.2.4. Mixing Systems
- 5.2.5. Bioreactors
- 5.2.6. Transfer Systems
- 5.2.7. Others
- 5.3. Market Analysis, Insights and Forecast - by End User
- 5.3.1. Pharmaceutical & Biotechnology Companies
- 5.3.2. Contract Development & Manufacturing Organizations
- 5.3.3. Other End Users
- 5.4. Market Analysis, Insights and Forecast - by Region
- 5.4.1. North America
- 5.4.2. Europe
- 5.4.3. Asia Pacific
- 5.4.4. Middle East and Africa
- 5.4.5. South America
- 5.1. Market Analysis, Insights and Forecast - by Test Type
- 6. North America Bioprocess Validation Market Analysis, Insights and Forecast, 2019-2031
- 6.1. Market Analysis, Insights and Forecast - by Test Type
- 6.1.1. Extractables Testing Services
- 6.1.2. Microbiological Testing Services
- 6.1.3. Physiochemical Testing Services
- 6.1.4. Integrity Testing Services
- 6.1.5. Compatibility Testing Services
- 6.1.6. Other Testing Services
- 6.2. Market Analysis, Insights and Forecast - by Process Component
- 6.2.1. Filter Elements
- 6.2.2. Media containers and bags
- 6.2.3. Freezing And Thawing Process Bags
- 6.2.4. Mixing Systems
- 6.2.5. Bioreactors
- 6.2.6. Transfer Systems
- 6.2.7. Others
- 6.3. Market Analysis, Insights and Forecast - by End User
- 6.3.1. Pharmaceutical & Biotechnology Companies
- 6.3.2. Contract Development & Manufacturing Organizations
- 6.3.3. Other End Users
- 6.1. Market Analysis, Insights and Forecast - by Test Type
- 7. Europe Bioprocess Validation Market Analysis, Insights and Forecast, 2019-2031
- 7.1. Market Analysis, Insights and Forecast - by Test Type
- 7.1.1. Extractables Testing Services
- 7.1.2. Microbiological Testing Services
- 7.1.3. Physiochemical Testing Services
- 7.1.4. Integrity Testing Services
- 7.1.5. Compatibility Testing Services
- 7.1.6. Other Testing Services
- 7.2. Market Analysis, Insights and Forecast - by Process Component
- 7.2.1. Filter Elements
- 7.2.2. Media containers and bags
- 7.2.3. Freezing And Thawing Process Bags
- 7.2.4. Mixing Systems
- 7.2.5. Bioreactors
- 7.2.6. Transfer Systems
- 7.2.7. Others
- 7.3. Market Analysis, Insights and Forecast - by End User
- 7.3.1. Pharmaceutical & Biotechnology Companies
- 7.3.2. Contract Development & Manufacturing Organizations
- 7.3.3. Other End Users
- 7.1. Market Analysis, Insights and Forecast - by Test Type
- 8. Asia Pacific Bioprocess Validation Market Analysis, Insights and Forecast, 2019-2031
- 8.1. Market Analysis, Insights and Forecast - by Test Type
- 8.1.1. Extractables Testing Services
- 8.1.2. Microbiological Testing Services
- 8.1.3. Physiochemical Testing Services
- 8.1.4. Integrity Testing Services
- 8.1.5. Compatibility Testing Services
- 8.1.6. Other Testing Services
- 8.2. Market Analysis, Insights and Forecast - by Process Component
- 8.2.1. Filter Elements
- 8.2.2. Media containers and bags
- 8.2.3. Freezing And Thawing Process Bags
- 8.2.4. Mixing Systems
- 8.2.5. Bioreactors
- 8.2.6. Transfer Systems
- 8.2.7. Others
- 8.3. Market Analysis, Insights and Forecast - by End User
- 8.3.1. Pharmaceutical & Biotechnology Companies
- 8.3.2. Contract Development & Manufacturing Organizations
- 8.3.3. Other End Users
- 8.1. Market Analysis, Insights and Forecast - by Test Type
- 9. Middle East and Africa Bioprocess Validation Market Analysis, Insights and Forecast, 2019-2031
- 9.1. Market Analysis, Insights and Forecast - by Test Type
- 9.1.1. Extractables Testing Services
- 9.1.2. Microbiological Testing Services
- 9.1.3. Physiochemical Testing Services
- 9.1.4. Integrity Testing Services
- 9.1.5. Compatibility Testing Services
- 9.1.6. Other Testing Services
- 9.2. Market Analysis, Insights and Forecast - by Process Component
- 9.2.1. Filter Elements
- 9.2.2. Media containers and bags
- 9.2.3. Freezing And Thawing Process Bags
- 9.2.4. Mixing Systems
- 9.2.5. Bioreactors
- 9.2.6. Transfer Systems
- 9.2.7. Others
- 9.3. Market Analysis, Insights and Forecast - by End User
- 9.3.1. Pharmaceutical & Biotechnology Companies
- 9.3.2. Contract Development & Manufacturing Organizations
- 9.3.3. Other End Users
- 9.1. Market Analysis, Insights and Forecast - by Test Type
- 10. South America Bioprocess Validation Market Analysis, Insights and Forecast, 2019-2031
- 10.1. Market Analysis, Insights and Forecast - by Test Type
- 10.1.1. Extractables Testing Services
- 10.1.2. Microbiological Testing Services
- 10.1.3. Physiochemical Testing Services
- 10.1.4. Integrity Testing Services
- 10.1.5. Compatibility Testing Services
- 10.1.6. Other Testing Services
- 10.2. Market Analysis, Insights and Forecast - by Process Component
- 10.2.1. Filter Elements
- 10.2.2. Media containers and bags
- 10.2.3. Freezing And Thawing Process Bags
- 10.2.4. Mixing Systems
- 10.2.5. Bioreactors
- 10.2.6. Transfer Systems
- 10.2.7. Others
- 10.3. Market Analysis, Insights and Forecast - by End User
- 10.3.1. Pharmaceutical & Biotechnology Companies
- 10.3.2. Contract Development & Manufacturing Organizations
- 10.3.3. Other End Users
- 10.1. Market Analysis, Insights and Forecast - by Test Type
- 11. North America Bioprocess Validation Market Analysis, Insights and Forecast, 2019-2031
- 11.1. Market Analysis, Insights and Forecast - By Country/Sub-region
- 11.1.1 United States
- 11.1.2 Canada
- 11.1.3 Mexico
- 12. Europe Bioprocess Validation Market Analysis, Insights and Forecast, 2019-2031
- 12.1. Market Analysis, Insights and Forecast - By Country/Sub-region
- 12.1.1 Germany
- 12.1.2 United Kingdom
- 12.1.3 France
- 12.1.4 Italy
- 12.1.5 Spain
- 12.1.6 Rest of Europe
- 13. Asia Pacific Bioprocess Validation Market Analysis, Insights and Forecast, 2019-2031
- 13.1. Market Analysis, Insights and Forecast - By Country/Sub-region
- 13.1.1 China
- 13.1.2 Japan
- 13.1.3 India
- 13.1.4 Australia
- 13.1.5 South Korea
- 13.1.6 Rest of Asia Pacific
- 14. Middle East and Africa Bioprocess Validation Market Analysis, Insights and Forecast, 2019-2031
- 14.1. Market Analysis, Insights and Forecast - By Country/Sub-region
- 14.1.1 GCC
- 14.1.2 South Africa
- 14.1.3 Rest of Middle East and Africa
- 15. South America Bioprocess Validation Market Analysis, Insights and Forecast, 2019-2031
- 15.1. Market Analysis, Insights and Forecast - By Country/Sub-region
- 15.1.1 Brazil
- 15.1.2 Argentina
- 15.1.3 Rest of South America
- 16. Competitive Analysis
- 16.1. Global Market Share Analysis 2024
- 16.2. Company Profiles
- 16.2.1 SGS S A
- 16.2.1.1. Overview
- 16.2.1.2. Products
- 16.2.1.3. SWOT Analysis
- 16.2.1.4. Recent Developments
- 16.2.1.5. Financials (Based on Availability)
- 16.2.2 Meissner Filtration Products
- 16.2.2.1. Overview
- 16.2.2.2. Products
- 16.2.2.3. SWOT Analysis
- 16.2.2.4. Recent Developments
- 16.2.2.5. Financials (Based on Availability)
- 16.2.3 Labcorp (Toxikon Corporation)
- 16.2.3.1. Overview
- 16.2.3.2. Products
- 16.2.3.3. SWOT Analysis
- 16.2.3.4. Recent Developments
- 16.2.3.5. Financials (Based on Availability)
- 16.2.4 Almac Group
- 16.2.4.1. Overview
- 16.2.4.2. Products
- 16.2.4.3. SWOT Analysis
- 16.2.4.4. Recent Developments
- 16.2.4.5. Financials (Based on Availability)
- 16.2.5 Merck KGaA
- 16.2.5.1. Overview
- 16.2.5.2. Products
- 16.2.5.3. SWOT Analysis
- 16.2.5.4. Recent Developments
- 16.2.5.5. Financials (Based on Availability)
- 16.2.6 Eurofins Scientific
- 16.2.6.1. Overview
- 16.2.6.2. Products
- 16.2.6.3. SWOT Analysis
- 16.2.6.4. Recent Developments
- 16.2.6.5. Financials (Based on Availability)
- 16.2.7 Cobetter Filtration Equipments Co Ltd
- 16.2.7.1. Overview
- 16.2.7.2. Products
- 16.2.7.3. SWOT Analysis
- 16.2.7.4. Recent Developments
- 16.2.7.5. Financials (Based on Availability)
- 16.2.8 Pall Corporation
- 16.2.8.1. Overview
- 16.2.8.2. Products
- 16.2.8.3. SWOT Analysis
- 16.2.8.4. Recent Developments
- 16.2.8.5. Financials (Based on Availability)
- 16.2.9 Sartorius AG
- 16.2.9.1. Overview
- 16.2.9.2. Products
- 16.2.9.3. SWOT Analysis
- 16.2.9.4. Recent Developments
- 16.2.9.5. Financials (Based on Availability)
- 16.2.10 Thermo Fisher Scientific
- 16.2.10.1. Overview
- 16.2.10.2. Products
- 16.2.10.3. SWOT Analysis
- 16.2.10.4. Recent Developments
- 16.2.10.5. Financials (Based on Availability)
- 16.2.11 DOC S r l
- 16.2.11.1. Overview
- 16.2.11.2. Products
- 16.2.11.3. SWOT Analysis
- 16.2.11.4. Recent Developments
- 16.2.11.5. Financials (Based on Availability)
- 16.2.1 SGS S A
List of Figures
- Figure 1: Global Bioprocess Validation Market Revenue Breakdown (Million, %) by Region 2024 & 2032
- Figure 2: Global Bioprocess Validation Market Volume Breakdown (K Unit, %) by Region 2024 & 2032
- Figure 3: North America Bioprocess Validation Market Revenue (Million), by Country 2024 & 2032
- Figure 4: North America Bioprocess Validation Market Volume (K Unit), by Country 2024 & 2032
- Figure 5: North America Bioprocess Validation Market Revenue Share (%), by Country 2024 & 2032
- Figure 6: North America Bioprocess Validation Market Volume Share (%), by Country 2024 & 2032
- Figure 7: Europe Bioprocess Validation Market Revenue (Million), by Country 2024 & 2032
- Figure 8: Europe Bioprocess Validation Market Volume (K Unit), by Country 2024 & 2032
- Figure 9: Europe Bioprocess Validation Market Revenue Share (%), by Country 2024 & 2032
- Figure 10: Europe Bioprocess Validation Market Volume Share (%), by Country 2024 & 2032
- Figure 11: Asia Pacific Bioprocess Validation Market Revenue (Million), by Country 2024 & 2032
- Figure 12: Asia Pacific Bioprocess Validation Market Volume (K Unit), by Country 2024 & 2032
- Figure 13: Asia Pacific Bioprocess Validation Market Revenue Share (%), by Country 2024 & 2032
- Figure 14: Asia Pacific Bioprocess Validation Market Volume Share (%), by Country 2024 & 2032
- Figure 15: Middle East and Africa Bioprocess Validation Market Revenue (Million), by Country 2024 & 2032
- Figure 16: Middle East and Africa Bioprocess Validation Market Volume (K Unit), by Country 2024 & 2032
- Figure 17: Middle East and Africa Bioprocess Validation Market Revenue Share (%), by Country 2024 & 2032
- Figure 18: Middle East and Africa Bioprocess Validation Market Volume Share (%), by Country 2024 & 2032
- Figure 19: South America Bioprocess Validation Market Revenue (Million), by Country 2024 & 2032
- Figure 20: South America Bioprocess Validation Market Volume (K Unit), by Country 2024 & 2032
- Figure 21: South America Bioprocess Validation Market Revenue Share (%), by Country 2024 & 2032
- Figure 22: South America Bioprocess Validation Market Volume Share (%), by Country 2024 & 2032
- Figure 23: North America Bioprocess Validation Market Revenue (Million), by Test Type 2024 & 2032
- Figure 24: North America Bioprocess Validation Market Volume (K Unit), by Test Type 2024 & 2032
- Figure 25: North America Bioprocess Validation Market Revenue Share (%), by Test Type 2024 & 2032
- Figure 26: North America Bioprocess Validation Market Volume Share (%), by Test Type 2024 & 2032
- Figure 27: North America Bioprocess Validation Market Revenue (Million), by Process Component 2024 & 2032
- Figure 28: North America Bioprocess Validation Market Volume (K Unit), by Process Component 2024 & 2032
- Figure 29: North America Bioprocess Validation Market Revenue Share (%), by Process Component 2024 & 2032
- Figure 30: North America Bioprocess Validation Market Volume Share (%), by Process Component 2024 & 2032
- Figure 31: North America Bioprocess Validation Market Revenue (Million), by End User 2024 & 2032
- Figure 32: North America Bioprocess Validation Market Volume (K Unit), by End User 2024 & 2032
- Figure 33: North America Bioprocess Validation Market Revenue Share (%), by End User 2024 & 2032
- Figure 34: North America Bioprocess Validation Market Volume Share (%), by End User 2024 & 2032
- Figure 35: North America Bioprocess Validation Market Revenue (Million), by Country 2024 & 2032
- Figure 36: North America Bioprocess Validation Market Volume (K Unit), by Country 2024 & 2032
- Figure 37: North America Bioprocess Validation Market Revenue Share (%), by Country 2024 & 2032
- Figure 38: North America Bioprocess Validation Market Volume Share (%), by Country 2024 & 2032
- Figure 39: Europe Bioprocess Validation Market Revenue (Million), by Test Type 2024 & 2032
- Figure 40: Europe Bioprocess Validation Market Volume (K Unit), by Test Type 2024 & 2032
- Figure 41: Europe Bioprocess Validation Market Revenue Share (%), by Test Type 2024 & 2032
- Figure 42: Europe Bioprocess Validation Market Volume Share (%), by Test Type 2024 & 2032
- Figure 43: Europe Bioprocess Validation Market Revenue (Million), by Process Component 2024 & 2032
- Figure 44: Europe Bioprocess Validation Market Volume (K Unit), by Process Component 2024 & 2032
- Figure 45: Europe Bioprocess Validation Market Revenue Share (%), by Process Component 2024 & 2032
- Figure 46: Europe Bioprocess Validation Market Volume Share (%), by Process Component 2024 & 2032
- Figure 47: Europe Bioprocess Validation Market Revenue (Million), by End User 2024 & 2032
- Figure 48: Europe Bioprocess Validation Market Volume (K Unit), by End User 2024 & 2032
- Figure 49: Europe Bioprocess Validation Market Revenue Share (%), by End User 2024 & 2032
- Figure 50: Europe Bioprocess Validation Market Volume Share (%), by End User 2024 & 2032
- Figure 51: Europe Bioprocess Validation Market Revenue (Million), by Country 2024 & 2032
- Figure 52: Europe Bioprocess Validation Market Volume (K Unit), by Country 2024 & 2032
- Figure 53: Europe Bioprocess Validation Market Revenue Share (%), by Country 2024 & 2032
- Figure 54: Europe Bioprocess Validation Market Volume Share (%), by Country 2024 & 2032
- Figure 55: Asia Pacific Bioprocess Validation Market Revenue (Million), by Test Type 2024 & 2032
- Figure 56: Asia Pacific Bioprocess Validation Market Volume (K Unit), by Test Type 2024 & 2032
- Figure 57: Asia Pacific Bioprocess Validation Market Revenue Share (%), by Test Type 2024 & 2032
- Figure 58: Asia Pacific Bioprocess Validation Market Volume Share (%), by Test Type 2024 & 2032
- Figure 59: Asia Pacific Bioprocess Validation Market Revenue (Million), by Process Component 2024 & 2032
- Figure 60: Asia Pacific Bioprocess Validation Market Volume (K Unit), by Process Component 2024 & 2032
- Figure 61: Asia Pacific Bioprocess Validation Market Revenue Share (%), by Process Component 2024 & 2032
- Figure 62: Asia Pacific Bioprocess Validation Market Volume Share (%), by Process Component 2024 & 2032
- Figure 63: Asia Pacific Bioprocess Validation Market Revenue (Million), by End User 2024 & 2032
- Figure 64: Asia Pacific Bioprocess Validation Market Volume (K Unit), by End User 2024 & 2032
- Figure 65: Asia Pacific Bioprocess Validation Market Revenue Share (%), by End User 2024 & 2032
- Figure 66: Asia Pacific Bioprocess Validation Market Volume Share (%), by End User 2024 & 2032
- Figure 67: Asia Pacific Bioprocess Validation Market Revenue (Million), by Country 2024 & 2032
- Figure 68: Asia Pacific Bioprocess Validation Market Volume (K Unit), by Country 2024 & 2032
- Figure 69: Asia Pacific Bioprocess Validation Market Revenue Share (%), by Country 2024 & 2032
- Figure 70: Asia Pacific Bioprocess Validation Market Volume Share (%), by Country 2024 & 2032
- Figure 71: Middle East and Africa Bioprocess Validation Market Revenue (Million), by Test Type 2024 & 2032
- Figure 72: Middle East and Africa Bioprocess Validation Market Volume (K Unit), by Test Type 2024 & 2032
- Figure 73: Middle East and Africa Bioprocess Validation Market Revenue Share (%), by Test Type 2024 & 2032
- Figure 74: Middle East and Africa Bioprocess Validation Market Volume Share (%), by Test Type 2024 & 2032
- Figure 75: Middle East and Africa Bioprocess Validation Market Revenue (Million), by Process Component 2024 & 2032
- Figure 76: Middle East and Africa Bioprocess Validation Market Volume (K Unit), by Process Component 2024 & 2032
- Figure 77: Middle East and Africa Bioprocess Validation Market Revenue Share (%), by Process Component 2024 & 2032
- Figure 78: Middle East and Africa Bioprocess Validation Market Volume Share (%), by Process Component 2024 & 2032
- Figure 79: Middle East and Africa Bioprocess Validation Market Revenue (Million), by End User 2024 & 2032
- Figure 80: Middle East and Africa Bioprocess Validation Market Volume (K Unit), by End User 2024 & 2032
- Figure 81: Middle East and Africa Bioprocess Validation Market Revenue Share (%), by End User 2024 & 2032
- Figure 82: Middle East and Africa Bioprocess Validation Market Volume Share (%), by End User 2024 & 2032
- Figure 83: Middle East and Africa Bioprocess Validation Market Revenue (Million), by Country 2024 & 2032
- Figure 84: Middle East and Africa Bioprocess Validation Market Volume (K Unit), by Country 2024 & 2032
- Figure 85: Middle East and Africa Bioprocess Validation Market Revenue Share (%), by Country 2024 & 2032
- Figure 86: Middle East and Africa Bioprocess Validation Market Volume Share (%), by Country 2024 & 2032
- Figure 87: South America Bioprocess Validation Market Revenue (Million), by Test Type 2024 & 2032
- Figure 88: South America Bioprocess Validation Market Volume (K Unit), by Test Type 2024 & 2032
- Figure 89: South America Bioprocess Validation Market Revenue Share (%), by Test Type 2024 & 2032
- Figure 90: South America Bioprocess Validation Market Volume Share (%), by Test Type 2024 & 2032
- Figure 91: South America Bioprocess Validation Market Revenue (Million), by Process Component 2024 & 2032
- Figure 92: South America Bioprocess Validation Market Volume (K Unit), by Process Component 2024 & 2032
- Figure 93: South America Bioprocess Validation Market Revenue Share (%), by Process Component 2024 & 2032
- Figure 94: South America Bioprocess Validation Market Volume Share (%), by Process Component 2024 & 2032
- Figure 95: South America Bioprocess Validation Market Revenue (Million), by End User 2024 & 2032
- Figure 96: South America Bioprocess Validation Market Volume (K Unit), by End User 2024 & 2032
- Figure 97: South America Bioprocess Validation Market Revenue Share (%), by End User 2024 & 2032
- Figure 98: South America Bioprocess Validation Market Volume Share (%), by End User 2024 & 2032
- Figure 99: South America Bioprocess Validation Market Revenue (Million), by Country 2024 & 2032
- Figure 100: South America Bioprocess Validation Market Volume (K Unit), by Country 2024 & 2032
- Figure 101: South America Bioprocess Validation Market Revenue Share (%), by Country 2024 & 2032
- Figure 102: South America Bioprocess Validation Market Volume Share (%), by Country 2024 & 2032
List of Tables
- Table 1: Global Bioprocess Validation Market Revenue Million Forecast, by Region 2019 & 2032
- Table 2: Global Bioprocess Validation Market Volume K Unit Forecast, by Region 2019 & 2032
- Table 3: Global Bioprocess Validation Market Revenue Million Forecast, by Test Type 2019 & 2032
- Table 4: Global Bioprocess Validation Market Volume K Unit Forecast, by Test Type 2019 & 2032
- Table 5: Global Bioprocess Validation Market Revenue Million Forecast, by Process Component 2019 & 2032
- Table 6: Global Bioprocess Validation Market Volume K Unit Forecast, by Process Component 2019 & 2032
- Table 7: Global Bioprocess Validation Market Revenue Million Forecast, by End User 2019 & 2032
- Table 8: Global Bioprocess Validation Market Volume K Unit Forecast, by End User 2019 & 2032
- Table 9: Global Bioprocess Validation Market Revenue Million Forecast, by Region 2019 & 2032
- Table 10: Global Bioprocess Validation Market Volume K Unit Forecast, by Region 2019 & 2032
- Table 11: Global Bioprocess Validation Market Revenue Million Forecast, by Country 2019 & 2032
- Table 12: Global Bioprocess Validation Market Volume K Unit Forecast, by Country 2019 & 2032
- Table 13: United States Bioprocess Validation Market Revenue (Million) Forecast, by Application 2019 & 2032
- Table 14: United States Bioprocess Validation Market Volume (K Unit) Forecast, by Application 2019 & 2032
- Table 15: Canada Bioprocess Validation Market Revenue (Million) Forecast, by Application 2019 & 2032
- Table 16: Canada Bioprocess Validation Market Volume (K Unit) Forecast, by Application 2019 & 2032
- Table 17: Mexico Bioprocess Validation Market Revenue (Million) Forecast, by Application 2019 & 2032
- Table 18: Mexico Bioprocess Validation Market Volume (K Unit) Forecast, by Application 2019 & 2032
- Table 19: Global Bioprocess Validation Market Revenue Million Forecast, by Country 2019 & 2032
- Table 20: Global Bioprocess Validation Market Volume K Unit Forecast, by Country 2019 & 2032
- Table 21: Germany Bioprocess Validation Market Revenue (Million) Forecast, by Application 2019 & 2032
- Table 22: Germany Bioprocess Validation Market Volume (K Unit) Forecast, by Application 2019 & 2032
- Table 23: United Kingdom Bioprocess Validation Market Revenue (Million) Forecast, by Application 2019 & 2032
- Table 24: United Kingdom Bioprocess Validation Market Volume (K Unit) Forecast, by Application 2019 & 2032
- Table 25: France Bioprocess Validation Market Revenue (Million) Forecast, by Application 2019 & 2032
- Table 26: France Bioprocess Validation Market Volume (K Unit) Forecast, by Application 2019 & 2032
- Table 27: Italy Bioprocess Validation Market Revenue (Million) Forecast, by Application 2019 & 2032
- Table 28: Italy Bioprocess Validation Market Volume (K Unit) Forecast, by Application 2019 & 2032
- Table 29: Spain Bioprocess Validation Market Revenue (Million) Forecast, by Application 2019 & 2032
- Table 30: Spain Bioprocess Validation Market Volume (K Unit) Forecast, by Application 2019 & 2032
- Table 31: Rest of Europe Bioprocess Validation Market Revenue (Million) Forecast, by Application 2019 & 2032
- Table 32: Rest of Europe Bioprocess Validation Market Volume (K Unit) Forecast, by Application 2019 & 2032
- Table 33: Global Bioprocess Validation Market Revenue Million Forecast, by Country 2019 & 2032
- Table 34: Global Bioprocess Validation Market Volume K Unit Forecast, by Country 2019 & 2032
- Table 35: China Bioprocess Validation Market Revenue (Million) Forecast, by Application 2019 & 2032
- Table 36: China Bioprocess Validation Market Volume (K Unit) Forecast, by Application 2019 & 2032
- Table 37: Japan Bioprocess Validation Market Revenue (Million) Forecast, by Application 2019 & 2032
- Table 38: Japan Bioprocess Validation Market Volume (K Unit) Forecast, by Application 2019 & 2032
- Table 39: India Bioprocess Validation Market Revenue (Million) Forecast, by Application 2019 & 2032
- Table 40: India Bioprocess Validation Market Volume (K Unit) Forecast, by Application 2019 & 2032
- Table 41: Australia Bioprocess Validation Market Revenue (Million) Forecast, by Application 2019 & 2032
- Table 42: Australia Bioprocess Validation Market Volume (K Unit) Forecast, by Application 2019 & 2032
- Table 43: South Korea Bioprocess Validation Market Revenue (Million) Forecast, by Application 2019 & 2032
- Table 44: South Korea Bioprocess Validation Market Volume (K Unit) Forecast, by Application 2019 & 2032
- Table 45: Rest of Asia Pacific Bioprocess Validation Market Revenue (Million) Forecast, by Application 2019 & 2032
- Table 46: Rest of Asia Pacific Bioprocess Validation Market Volume (K Unit) Forecast, by Application 2019 & 2032
- Table 47: Global Bioprocess Validation Market Revenue Million Forecast, by Country 2019 & 2032
- Table 48: Global Bioprocess Validation Market Volume K Unit Forecast, by Country 2019 & 2032
- Table 49: GCC Bioprocess Validation Market Revenue (Million) Forecast, by Application 2019 & 2032
- Table 50: GCC Bioprocess Validation Market Volume (K Unit) Forecast, by Application 2019 & 2032
- Table 51: South Africa Bioprocess Validation Market Revenue (Million) Forecast, by Application 2019 & 2032
- Table 52: South Africa Bioprocess Validation Market Volume (K Unit) Forecast, by Application 2019 & 2032
- Table 53: Rest of Middle East and Africa Bioprocess Validation Market Revenue (Million) Forecast, by Application 2019 & 2032
- Table 54: Rest of Middle East and Africa Bioprocess Validation Market Volume (K Unit) Forecast, by Application 2019 & 2032
- Table 55: Global Bioprocess Validation Market Revenue Million Forecast, by Country 2019 & 2032
- Table 56: Global Bioprocess Validation Market Volume K Unit Forecast, by Country 2019 & 2032
- Table 57: Brazil Bioprocess Validation Market Revenue (Million) Forecast, by Application 2019 & 2032
- Table 58: Brazil Bioprocess Validation Market Volume (K Unit) Forecast, by Application 2019 & 2032
- Table 59: Argentina Bioprocess Validation Market Revenue (Million) Forecast, by Application 2019 & 2032
- Table 60: Argentina Bioprocess Validation Market Volume (K Unit) Forecast, by Application 2019 & 2032
- Table 61: Rest of South America Bioprocess Validation Market Revenue (Million) Forecast, by Application 2019 & 2032
- Table 62: Rest of South America Bioprocess Validation Market Volume (K Unit) Forecast, by Application 2019 & 2032
- Table 63: Global Bioprocess Validation Market Revenue Million Forecast, by Test Type 2019 & 2032
- Table 64: Global Bioprocess Validation Market Volume K Unit Forecast, by Test Type 2019 & 2032
- Table 65: Global Bioprocess Validation Market Revenue Million Forecast, by Process Component 2019 & 2032
- Table 66: Global Bioprocess Validation Market Volume K Unit Forecast, by Process Component 2019 & 2032
- Table 67: Global Bioprocess Validation Market Revenue Million Forecast, by End User 2019 & 2032
- Table 68: Global Bioprocess Validation Market Volume K Unit Forecast, by End User 2019 & 2032
- Table 69: Global Bioprocess Validation Market Revenue Million Forecast, by Country 2019 & 2032
- Table 70: Global Bioprocess Validation Market Volume K Unit Forecast, by Country 2019 & 2032
- Table 71: United States Bioprocess Validation Market Revenue (Million) Forecast, by Application 2019 & 2032
- Table 72: United States Bioprocess Validation Market Volume (K Unit) Forecast, by Application 2019 & 2032
- Table 73: Canada Bioprocess Validation Market Revenue (Million) Forecast, by Application 2019 & 2032
- Table 74: Canada Bioprocess Validation Market Volume (K Unit) Forecast, by Application 2019 & 2032
- Table 75: Mexico Bioprocess Validation Market Revenue (Million) Forecast, by Application 2019 & 2032
- Table 76: Mexico Bioprocess Validation Market Volume (K Unit) Forecast, by Application 2019 & 2032
- Table 77: Global Bioprocess Validation Market Revenue Million Forecast, by Test Type 2019 & 2032
- Table 78: Global Bioprocess Validation Market Volume K Unit Forecast, by Test Type 2019 & 2032
- Table 79: Global Bioprocess Validation Market Revenue Million Forecast, by Process Component 2019 & 2032
- Table 80: Global Bioprocess Validation Market Volume K Unit Forecast, by Process Component 2019 & 2032
- Table 81: Global Bioprocess Validation Market Revenue Million Forecast, by End User 2019 & 2032
- Table 82: Global Bioprocess Validation Market Volume K Unit Forecast, by End User 2019 & 2032
- Table 83: Global Bioprocess Validation Market Revenue Million Forecast, by Country 2019 & 2032
- Table 84: Global Bioprocess Validation Market Volume K Unit Forecast, by Country 2019 & 2032
- Table 85: Germany Bioprocess Validation Market Revenue (Million) Forecast, by Application 2019 & 2032
- Table 86: Germany Bioprocess Validation Market Volume (K Unit) Forecast, by Application 2019 & 2032
- Table 87: United Kingdom Bioprocess Validation Market Revenue (Million) Forecast, by Application 2019 & 2032
- Table 88: United Kingdom Bioprocess Validation Market Volume (K Unit) Forecast, by Application 2019 & 2032
- Table 89: France Bioprocess Validation Market Revenue (Million) Forecast, by Application 2019 & 2032
- Table 90: France Bioprocess Validation Market Volume (K Unit) Forecast, by Application 2019 & 2032
- Table 91: Italy Bioprocess Validation Market Revenue (Million) Forecast, by Application 2019 & 2032
- Table 92: Italy Bioprocess Validation Market Volume (K Unit) Forecast, by Application 2019 & 2032
- Table 93: Spain Bioprocess Validation Market Revenue (Million) Forecast, by Application 2019 & 2032
- Table 94: Spain Bioprocess Validation Market Volume (K Unit) Forecast, by Application 2019 & 2032
- Table 95: Rest of Europe Bioprocess Validation Market Revenue (Million) Forecast, by Application 2019 & 2032
- Table 96: Rest of Europe Bioprocess Validation Market Volume (K Unit) Forecast, by Application 2019 & 2032
- Table 97: Global Bioprocess Validation Market Revenue Million Forecast, by Test Type 2019 & 2032
- Table 98: Global Bioprocess Validation Market Volume K Unit Forecast, by Test Type 2019 & 2032
- Table 99: Global Bioprocess Validation Market Revenue Million Forecast, by Process Component 2019 & 2032
- Table 100: Global Bioprocess Validation Market Volume K Unit Forecast, by Process Component 2019 & 2032
- Table 101: Global Bioprocess Validation Market Revenue Million Forecast, by End User 2019 & 2032
- Table 102: Global Bioprocess Validation Market Volume K Unit Forecast, by End User 2019 & 2032
- Table 103: Global Bioprocess Validation Market Revenue Million Forecast, by Country 2019 & 2032
- Table 104: Global Bioprocess Validation Market Volume K Unit Forecast, by Country 2019 & 2032
- Table 105: China Bioprocess Validation Market Revenue (Million) Forecast, by Application 2019 & 2032
- Table 106: China Bioprocess Validation Market Volume (K Unit) Forecast, by Application 2019 & 2032
- Table 107: Japan Bioprocess Validation Market Revenue (Million) Forecast, by Application 2019 & 2032
- Table 108: Japan Bioprocess Validation Market Volume (K Unit) Forecast, by Application 2019 & 2032
- Table 109: India Bioprocess Validation Market Revenue (Million) Forecast, by Application 2019 & 2032
- Table 110: India Bioprocess Validation Market Volume (K Unit) Forecast, by Application 2019 & 2032
- Table 111: Australia Bioprocess Validation Market Revenue (Million) Forecast, by Application 2019 & 2032
- Table 112: Australia Bioprocess Validation Market Volume (K Unit) Forecast, by Application 2019 & 2032
- Table 113: South Korea Bioprocess Validation Market Revenue (Million) Forecast, by Application 2019 & 2032
- Table 114: South Korea Bioprocess Validation Market Volume (K Unit) Forecast, by Application 2019 & 2032
- Table 115: Rest of Asia Pacific Bioprocess Validation Market Revenue (Million) Forecast, by Application 2019 & 2032
- Table 116: Rest of Asia Pacific Bioprocess Validation Market Volume (K Unit) Forecast, by Application 2019 & 2032
- Table 117: Global Bioprocess Validation Market Revenue Million Forecast, by Test Type 2019 & 2032
- Table 118: Global Bioprocess Validation Market Volume K Unit Forecast, by Test Type 2019 & 2032
- Table 119: Global Bioprocess Validation Market Revenue Million Forecast, by Process Component 2019 & 2032
- Table 120: Global Bioprocess Validation Market Volume K Unit Forecast, by Process Component 2019 & 2032
- Table 121: Global Bioprocess Validation Market Revenue Million Forecast, by End User 2019 & 2032
- Table 122: Global Bioprocess Validation Market Volume K Unit Forecast, by End User 2019 & 2032
- Table 123: Global Bioprocess Validation Market Revenue Million Forecast, by Country 2019 & 2032
- Table 124: Global Bioprocess Validation Market Volume K Unit Forecast, by Country 2019 & 2032
- Table 125: GCC Bioprocess Validation Market Revenue (Million) Forecast, by Application 2019 & 2032
- Table 126: GCC Bioprocess Validation Market Volume (K Unit) Forecast, by Application 2019 & 2032
- Table 127: South Africa Bioprocess Validation Market Revenue (Million) Forecast, by Application 2019 & 2032
- Table 128: South Africa Bioprocess Validation Market Volume (K Unit) Forecast, by Application 2019 & 2032
- Table 129: Rest of Middle East and Africa Bioprocess Validation Market Revenue (Million) Forecast, by Application 2019 & 2032
- Table 130: Rest of Middle East and Africa Bioprocess Validation Market Volume (K Unit) Forecast, by Application 2019 & 2032
- Table 131: Global Bioprocess Validation Market Revenue Million Forecast, by Test Type 2019 & 2032
- Table 132: Global Bioprocess Validation Market Volume K Unit Forecast, by Test Type 2019 & 2032
- Table 133: Global Bioprocess Validation Market Revenue Million Forecast, by Process Component 2019 & 2032
- Table 134: Global Bioprocess Validation Market Volume K Unit Forecast, by Process Component 2019 & 2032
- Table 135: Global Bioprocess Validation Market Revenue Million Forecast, by End User 2019 & 2032
- Table 136: Global Bioprocess Validation Market Volume K Unit Forecast, by End User 2019 & 2032
- Table 137: Global Bioprocess Validation Market Revenue Million Forecast, by Country 2019 & 2032
- Table 138: Global Bioprocess Validation Market Volume K Unit Forecast, by Country 2019 & 2032
- Table 139: Brazil Bioprocess Validation Market Revenue (Million) Forecast, by Application 2019 & 2032
- Table 140: Brazil Bioprocess Validation Market Volume (K Unit) Forecast, by Application 2019 & 2032
- Table 141: Argentina Bioprocess Validation Market Revenue (Million) Forecast, by Application 2019 & 2032
- Table 142: Argentina Bioprocess Validation Market Volume (K Unit) Forecast, by Application 2019 & 2032
- Table 143: Rest of South America Bioprocess Validation Market Revenue (Million) Forecast, by Application 2019 & 2032
- Table 144: Rest of South America Bioprocess Validation Market Volume (K Unit) Forecast, by Application 2019 & 2032
Frequently Asked Questions
1. What is the projected Compound Annual Growth Rate (CAGR) of the Bioprocess Validation Market?
The projected CAGR is approximately 9.50%.
2. Which companies are prominent players in the Bioprocess Validation Market?
Key companies in the market include SGS S A, Meissner Filtration Products, Labcorp (Toxikon Corporation), Almac Group, Merck KGaA, Eurofins Scientific, Cobetter Filtration Equipments Co Ltd, Pall Corporation, Sartorius AG, Thermo Fisher Scientific, DOC S r l.
3. What are the main segments of the Bioprocess Validation Market?
The market segments include Test Type, Process Component, End User.
4. Can you provide details about the market size?
The market size is estimated to be USD XX Million as of 2022.
5. What are some drivers contributing to market growth?
Increasing Demand for Biopharmaceuticals; Increasing Demand for Outsourcing Bioprocess Validation; Rising Life Science R&D Expenditure.
6. What are the notable trends driving market growth?
Bioreactor Expected to Hold Significant Market Share.
7. Are there any restraints impacting market growth?
Issues Related to Extractables & Leachables.
8. Can you provide examples of recent developments in the market?
May 2022: Qosina launched its new Bioprocess Resource Center, an information source for the bioprocess industry.
9. What pricing options are available for accessing the report?
Pricing options include single-user, multi-user, and enterprise licenses priced at USD 4750, USD 5250, and USD 8750 respectively.
10. Is the market size provided in terms of value or volume?
The market size is provided in terms of value, measured in Million and volume, measured in K Unit.
11. Are there any specific market keywords associated with the report?
Yes, the market keyword associated with the report is "Bioprocess Validation Market," which aids in identifying and referencing the specific market segment covered.
12. How do I determine which pricing option suits my needs best?
The pricing options vary based on user requirements and access needs. Individual users may opt for single-user licenses, while businesses requiring broader access may choose multi-user or enterprise licenses for cost-effective access to the report.
13. Are there any additional resources or data provided in the Bioprocess Validation Market report?
While the report offers comprehensive insights, it's advisable to review the specific contents or supplementary materials provided to ascertain if additional resources or data are available.
14. How can I stay updated on further developments or reports in the Bioprocess Validation Market?
To stay informed about further developments, trends, and reports in the Bioprocess Validation Market, consider subscribing to industry newsletters, following relevant companies and organizations, or regularly checking reputable industry news sources and publications.
Methodology
Step 1 - Identification of Relevant Samples Size from Population Database


Step 2 - Approaches for Defining Global Market Size (Value, Volume* & Price*)

Note*: In applicable scenarios
Step 3 - Data Sources
Primary Research
- Web Analytics
- Survey Reports
- Research Institute
- Latest Research Reports
- Opinion Leaders
Secondary Research
- Annual Reports
- White Paper
- Latest Press Release
- Industry Association
- Paid Database
- Investor Presentations

Step 4 - Data Triangulation
Involves using different sources of information in order to increase the validity of a study
These sources are likely to be stakeholders in a program - participants, other researchers, program staff, other community members, and so on.
Then we put all data in single framework & apply various statistical tools to find out the dynamic on the market.
During the analysis stage, feedback from the stakeholder groups would be compared to determine areas of agreement as well as areas of divergence
